Download presentation
Presentation is loading. Please wait.

1
Estimating Response of Douglas-fir to Urea in Western Oregon & Washington By: Eric Sucre M.S. Thesis Defense

2
Outline Fertilization History and Background Research Objectives Locations of Study Sites Site Descriptives Brief Description of Experimental Design & Sampling Methodology Soil & Site Properties Examined Statistical Model for Calculating % Response Significant Chemical And Physical Soil Property Differences Regression Models Conclusions

3
Background Regional Forest Nutrition Research Project-RFNRP Lake Shawnigan Study in British Columbia Stand Management Cooperative (SMC) >55 hectares of forests fertilized annually Fertilizers Typically Used: 1) Urea ([NH 2 ] 2 CO) 2) Ammonium Nitrate (NH 4 NO 3 ) 3) Biosolids
![Background Regional Forest Nutrition Research Project-RFNRP Lake Shawnigan Study in British Columbia Stand Management Cooperative (SMC) >55 hectares of forests fertilized annually Fertilizers Typically Used: 1) Urea ([NH 2 ] 2 CO) 2) Ammonium Nitrate (NH 4 NO 3 ) 3) Biosolids](http://images.slideplayer.com/16/5165684/slides/slide_3.jpg "Background Regional Forest Nutrition Research Project-RFNRP Lake Shawnigan Study in British Columbia Stand Management Cooperative (SMC) >55 hectares of forests fertilized annually Fertilizers Typically Used: 1) Urea ([NH 2 ] 2 CO) 2) Ammonium Nitrate (NH 4 NO 3 ) 3) Biosolids")
4
Background cont…… Nitrogen Pools in Pacific Northwest Soils Total Nitrogen vs. Available Nitrogen Mineralization Rates Potential Negative Effects of N Fertilization Response Time for Douglas-fir Varies Predictors for Douglas-fir Response to N Fertilization: 1) C:N ratio & Total N 2) Foliar SO 4 -S 3) Genotypes 4) Site Index
 C:N ratio & Total N 2) Foliar SO 4 -S 3) Genotypes 4) Site Index.")
5
An Example in the PNW 2000-4000 kg ha -1 of Total N 1-2% Mineralization Rate 20 to 80 kg ha -1 of Available N per year Fertilizer Rate of 224 to 448 kg ha -1 Approximately 25% of total goes to Biomass Increment Typically 10% to 20% of Added Fertilizer Enters Trees Where does the remaining fertilizer go?

6
Forest Nitrogen Cycling Process Representing Major Fates and Effects of N Fertilization (Nason and Myrold, 1992)
")
7
Factors Influencing Timing of Fertilization 1) Time of Year 2) Temperature 3) Wind Speeds 4) Precipitation Patterns
 Time of Year 2) Temperature 3) Wind Speeds 4) Precipitation Patterns")
8
Project Objectives 1.Assess Relative % Response for Total Volume and 4-year PAI 2.Test for differences between site, stand and soil variables 3.Examine relationships between %Response and site, stand and soil variables

9
Locations of SMC Type I Fertilized Research Installations

10
Site Descriptives

11
Experimental Design Six 0.4 hectare Douglas-fir plots per installation were examined for this study. 3 pairs of fertilized and non-fertilized plots with different initial stocking levels were compared to each other. 1) ISPHA Fertilized vs. ISPHA Non-fertilized 2) ISPHA/2 Fertilized vs. ISPHA/2 Non-fertilized 3) ISPHA/4 Fertilized vs. ISPHA/4 Non-fertilized
 ISPHA Fertilized vs. ISPHA Non-fertilized 2) ISPHA/2 Fertilized vs. ISPHA/2 Non-fertilized 3) ISPHA/4 Fertilized vs. ISPHA/4 Non-fertilized.")
12
ISPHA

13
ISPHA/2

14
ISPHA/4

15
Pretreatment Conditions

16
ISPHA, Repeated thinning: RD55->RD35, RD55->RD40, subsequent RD60->RD40 ISPHA, Repeated thinning: RD55->RD35, RD55->RD40, subsequent RD60->RD40, fertilized with 224 kg N ha -1 as urea every 4 years ISPHA/2, Minimal thinning: RD55->RD35, no further thinning ISPHA/2, Minimal thinning: RD55->RD35, no further thinning, fertilized with 224 kg N ha -1 as urea every 4 years ISPHA/4, No further thinning ISPHA/4, No further thinning, fertilized 224 kg N ha -1 as urea every 4 years { { { Density Management Regimes for Plots Examined within Each Installation

17
Sampling points for soil and forest floor in SMC Type 1 plots.

18
Soil & Site Properties Used in Stepwise Regression Analysis Mean Annual Precipitation Elevation % Slope Relative Density (RD) Quadratic Mean Diameter (QMD) bulk density (Db) pH Total C & N %C & %N C:N ratio cation exchange capacity (CEC)* Inorganic nitrogen (NO 3 - and NH 4 + )* *Mineral Soil only
 Quadratic Mean Diameter (QMD) bulk density (Db) pH Total C & N %C & %N C:N ratio cation exchange capacity (CEC)* Inorganic nitrogen (NO 3 - and NH 4 + )* *Mineral Soil only")
19
Statistical Model y ijk = µ + α i + γ j + αγ ij + β1x1 ijk + β2x2 ijk + β3x3 ijk + є ijk y ijk = is total volume & 4-yr PAI for the fertilization level i, thinning j µ = is overall average of D.F. volume α i = is the fixed effect of the i-th fertilizer regime γ j = is the fixed effect of j-th thinning regime αγ ij = is the interaction effect of the i-th fertilizer & j-th thinning regime β = is the slope of volume vs. various covariates x1 ijk = is Site Index for given plot/installation x2 ijk = is ISPHA before treatment x3 ijk = is Breast Height Age of plot before treatment

20
Total Volume & 4-yr PAI relative response for each Density Management Regime 4-yrs following the 1 st Treatment

21
Total Volume & 4-yr PAI relative response for each Density Management Regime 4-yrs following the 2 nd Treatment

22
Total Volume & 4-yr PAI relative response for each Density Management Regime 4-yrs following the 3 rd Treatment

23
ANCOVA by Treatment Intervals

24
H.L. Allen, 2002

25
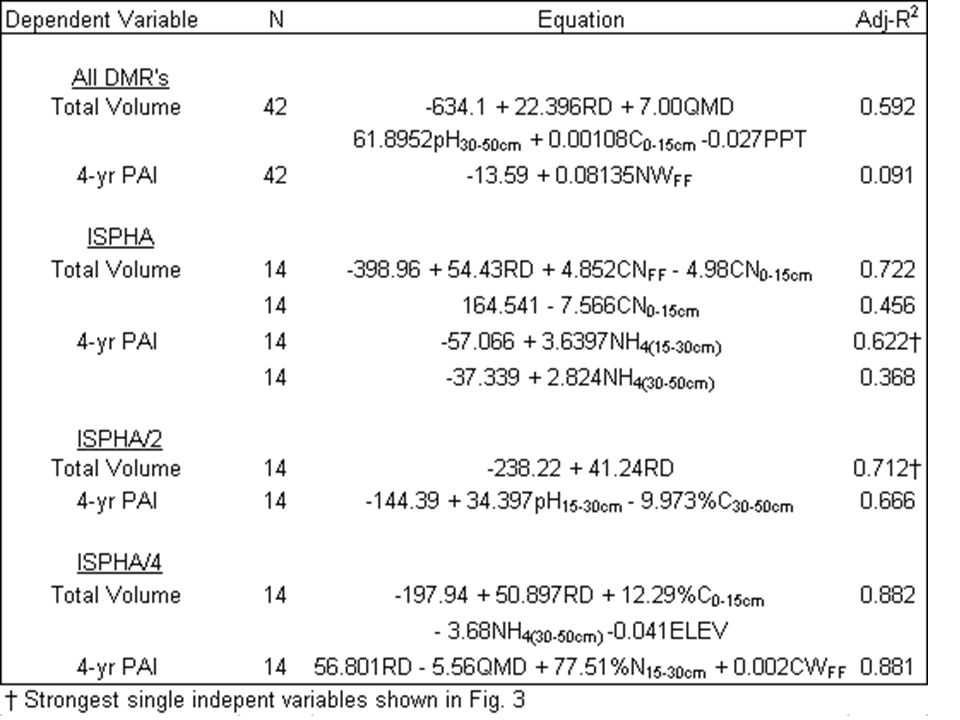
Significant Chemical And Physical Soil Property Differences

26
Adj. R 2 =.622 Y= -57.066 +.001(NH 4 + (30-50cm) ) p <.001
 ) p <.001")
27
Adj. R 2 =.712 Y= -238.22 +41.24RD p = <.001

29
Conclusions Thinning effects were significant across all treatment intervals. 4-yr PAI was significant during the first 2 treatment intervals, but insignificant during the latest interval Longer Fertilization Periods (8 years) RD most influential variable Significant contribution of soil variables to regression equations
 RD most influential variable Significant contribution of soil variables to regression equations.")
30
Acknowledgements Committee Members SMC Cooperative Members for Funding Fellow Soil Grad Students Dongsen Xue SMC Staff

31
Questions/Comments ??????

Similar presentations
 R.W. Negrave Coast Region, MFR.>")


 Environmental sampling and analysis.>")


