Download presentation
Presentation is loading. Please wait.

1
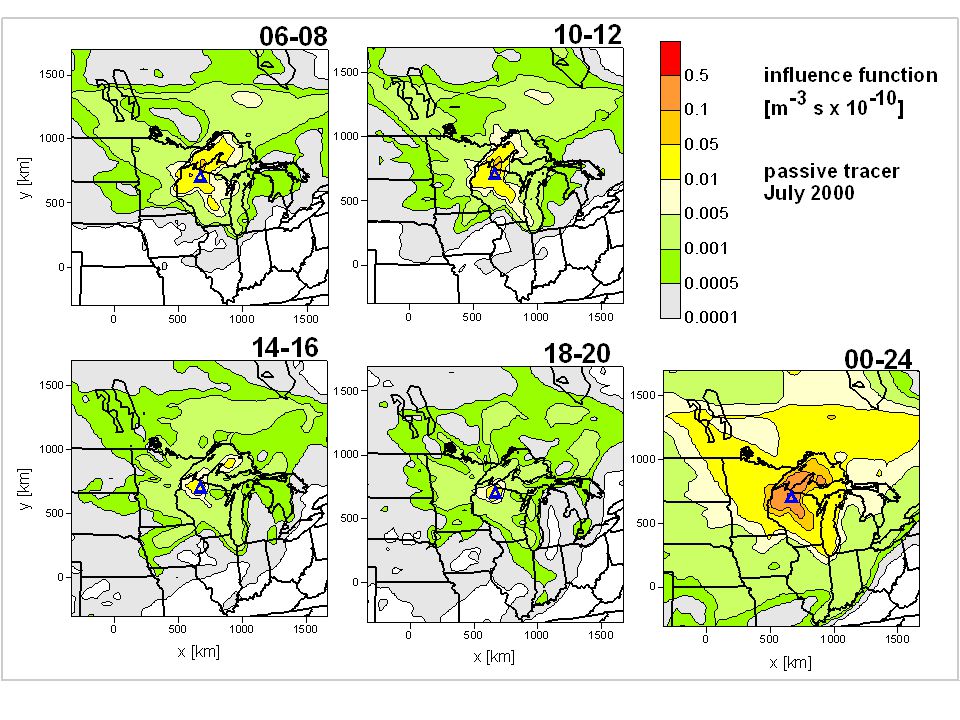
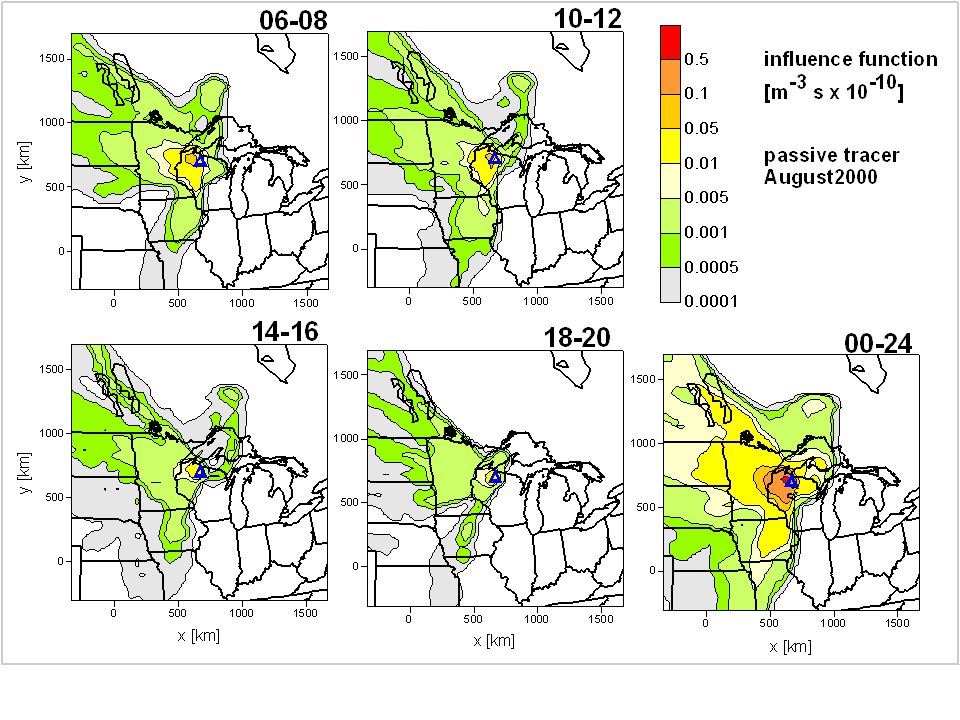
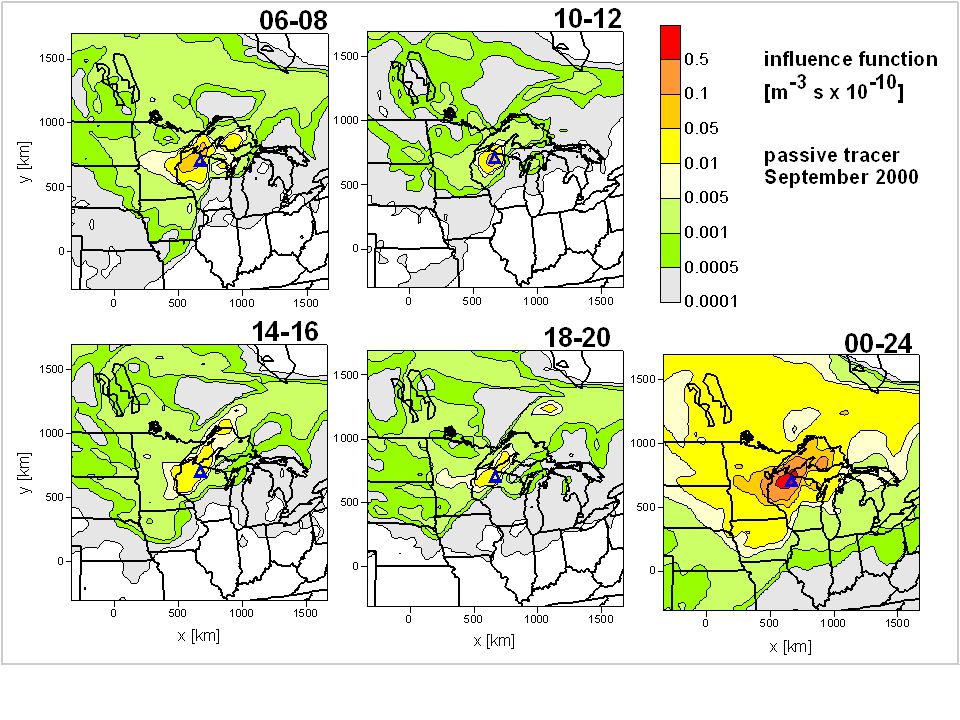
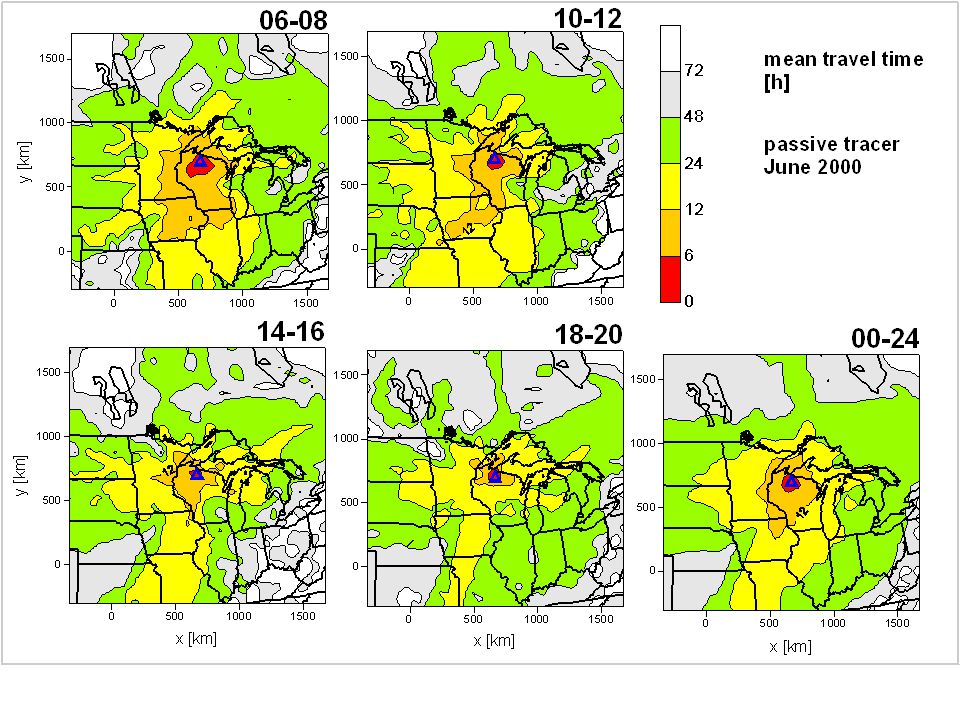
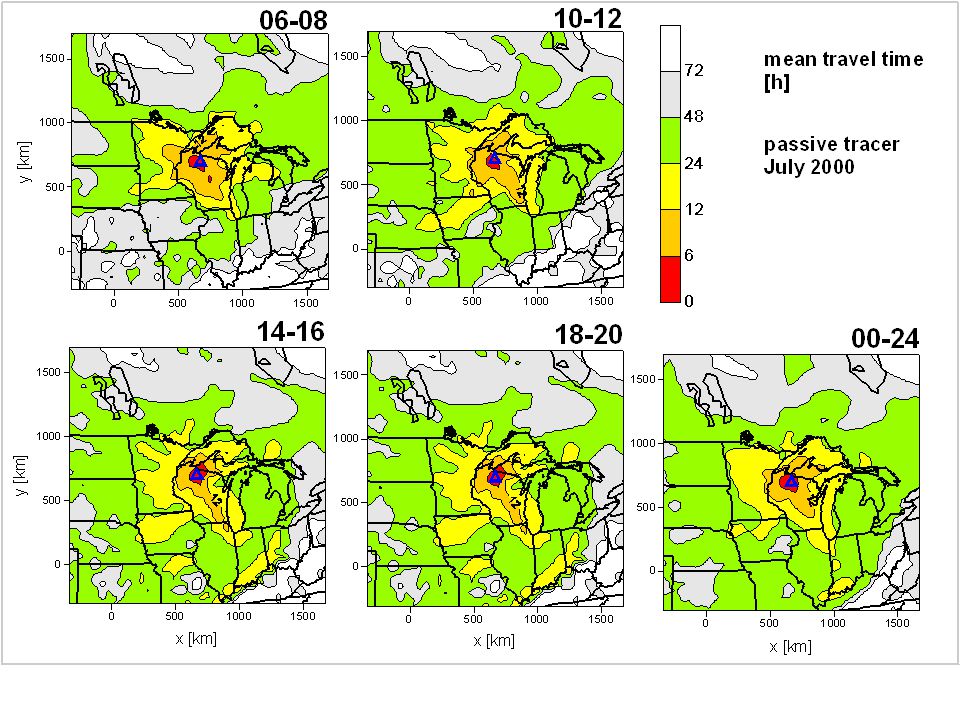
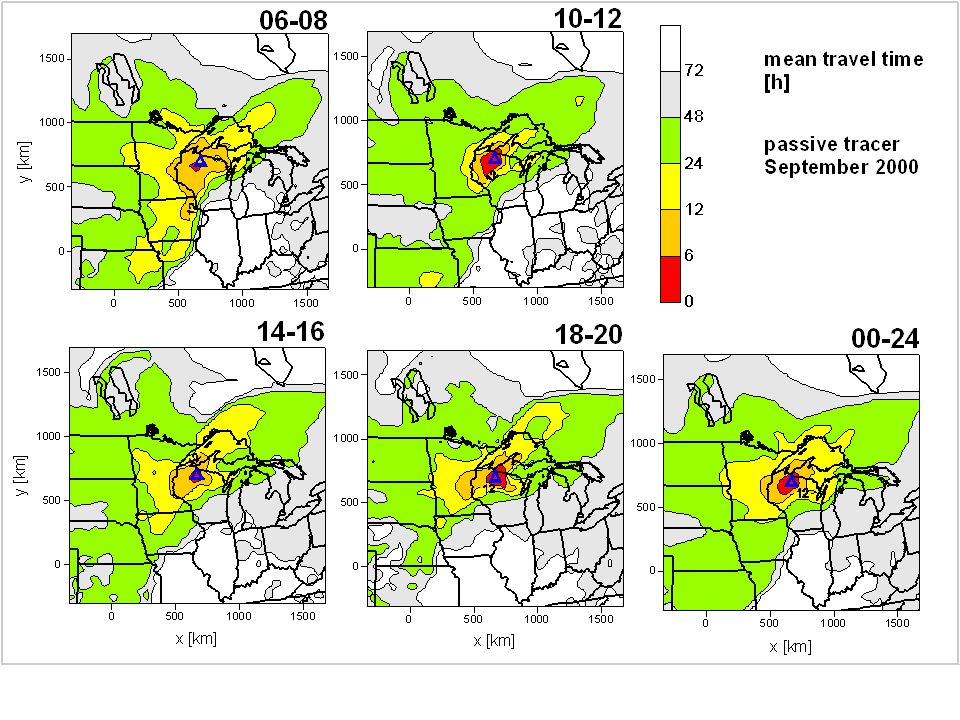
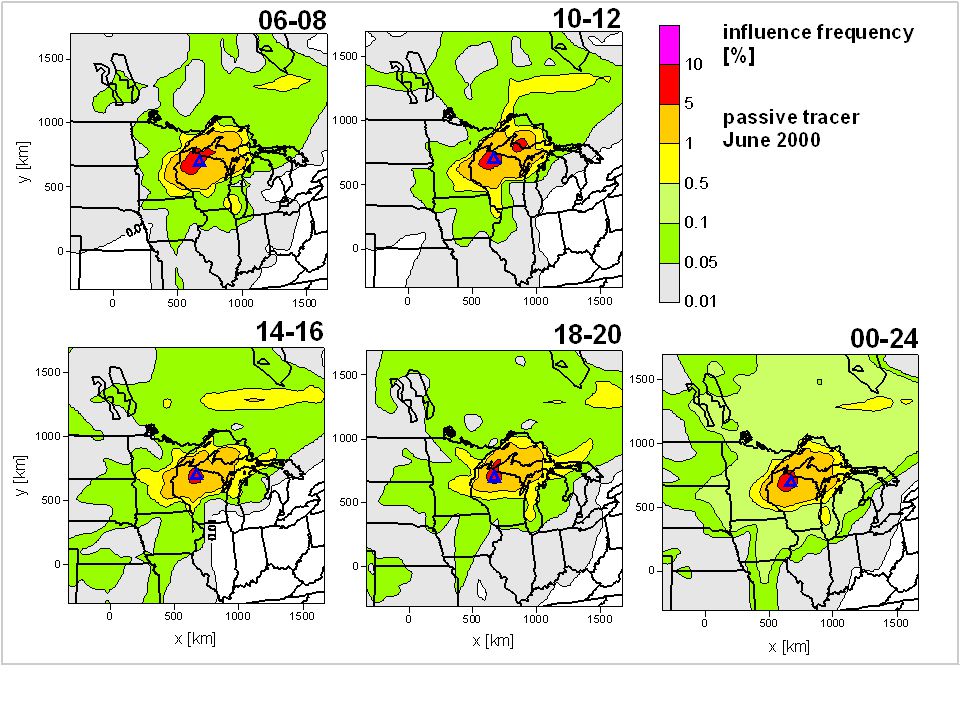
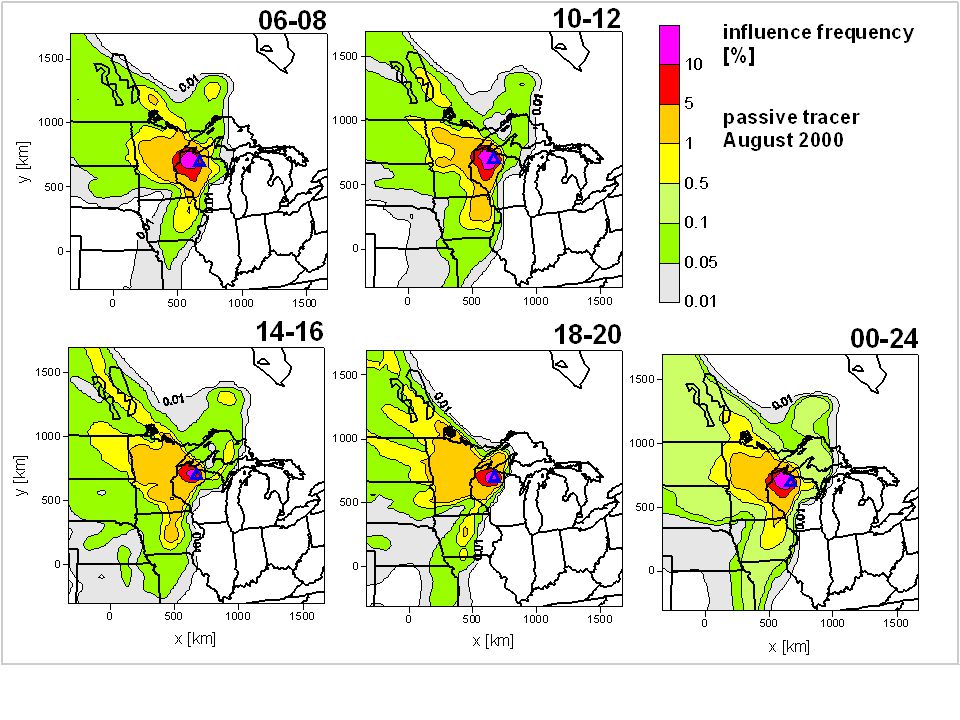
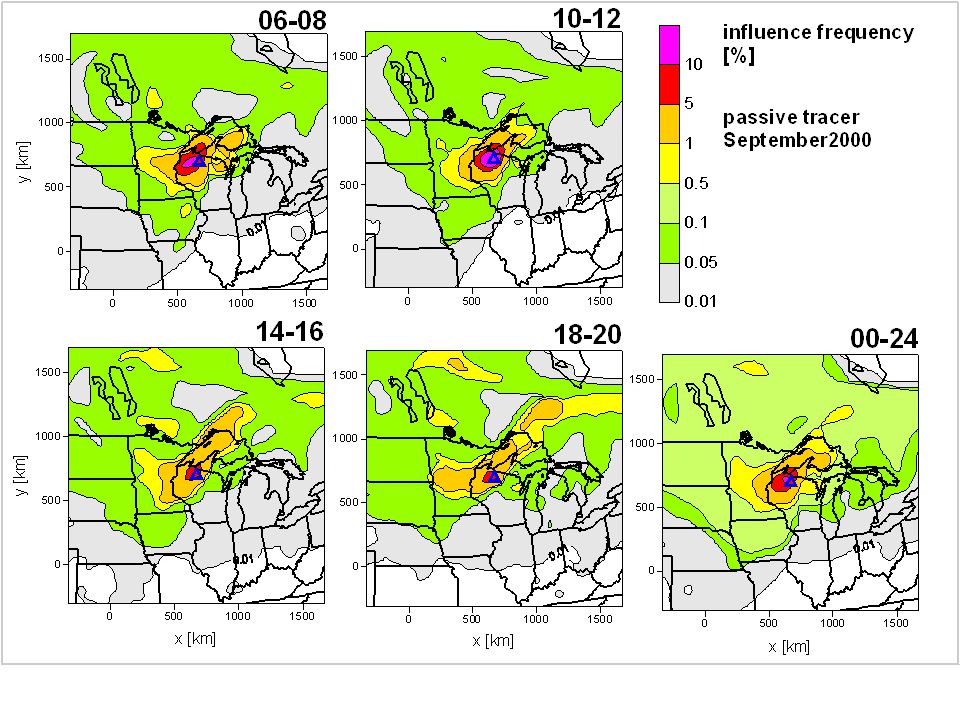
Influence functions for the WLEF tower (z=400m) for the June, July, August and September 2000 Simulation: RAMS v4.3 with two nested grids (Δx=100km and 20 km) + LPD (Lagrangian Particle Dispersion) model in a receptor- oriented mode. The 2 nd finer grid covers the domain around the WLEF tower used for dispersion calculations. Concentration sampling: The influence functions, travel time and influence frequency are presented for selected 2 hour sampling periods during the day during the August 2000. The 00-24 hour period represents the results for all samplings during the month. All sampling times are local (GMT-6h). The results can be plotted for any additional 2 hour sampling periods. The influence frequency is derived in reference to the sampling period (i.e., how often the signal from a given source area is observed at the receptor during the sampling period). Travel distance is derived from the presented influence functions but averaged over 45 o sectors and shown in polar coordinates. Tracers: 1. Passive tracer with a constant flux – the spatial distributions are the same as for the respiration flux including dependence on the soil temperature. 2. A-tracer (assimilation tracer) with a daytime flux driven by shortwave radiation Reference: Uliasz, M. and A. S. Denning, 2002: Deriving mesoscale surface fluxes of trace gases from concentration data. submitted to: J. Appl. Meteor. Download: http://biocycle.atmos.colostate.edu/~marek/research/publications.htm
. The results can be plotted for any additional 2 hour sampling periods. The influence frequency is derived in reference to the sampling period (i.e., how often the signal from a given source area is observed at the receptor during the sampling period). Travel distance is derived from the presented influence functions but averaged over 45 o sectors and shown in polar coordinates. Tracers: 1. Passive tracer with a constant flux – the spatial distributions are the same as for the respiration flux including dependence on the soil temperature. 2. A-tracer (assimilation tracer) with a daytime flux driven by shortwave radiation Reference: Uliasz, M. and A. S. Denning, 2002: Deriving mesoscale surface fluxes of trace gases from concentration data. submitted to: J. Appl. Meteor. Download:")
2
Influence function climatology

15
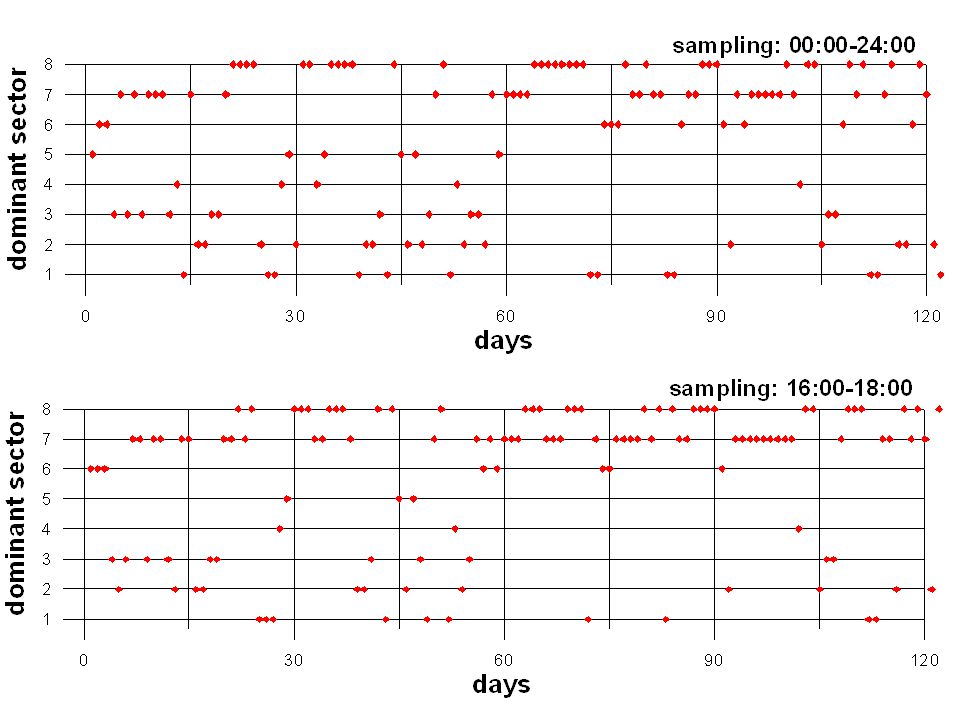
Daily variability of transport patterns Influence functions derived for each day during the period June-September 2000 were integrated in polar coordinates Within 8 sectors (45 o ) up to 1000 km upwind from the WLEF tower. For each day the dominant sector was selected (next figure). Daily variability of atmospheric transport patterns were evaluated as the difference between the dominant sector at the current and previous days, i.e., 0 – no change in dominant transport, 1- 45 o change in direction of dominant transport, 4 – change of the dominant transport to the opposite direction (2 nd next figure). Information on direction of changes (clockwise or counterclockwise) was not taken into account. The time periods with 0-1 had rather stable transport pattern while the period with 3-4 highly variable transport patterns. The dominant sectors and transport variability are somewhat sensitive to the sampling time during the day..
. Daily variability of atmospheric transport patterns were evaluated as the difference between the dominant sector at the current and previous days, i.e., 0 – no change in dominant transport, o change in direction of dominant transport, 4 – change of the dominant transport to the opposite direction (2 nd next figure). Information on direction of changes (clockwise or counterclockwise) was not taken into account. The time periods with 0-1 had rather stable transport pattern while the period with 3-4 highly variable transport patterns. The dominant sectors and transport variability are somewhat sensitive to the sampling time during the day...")
18
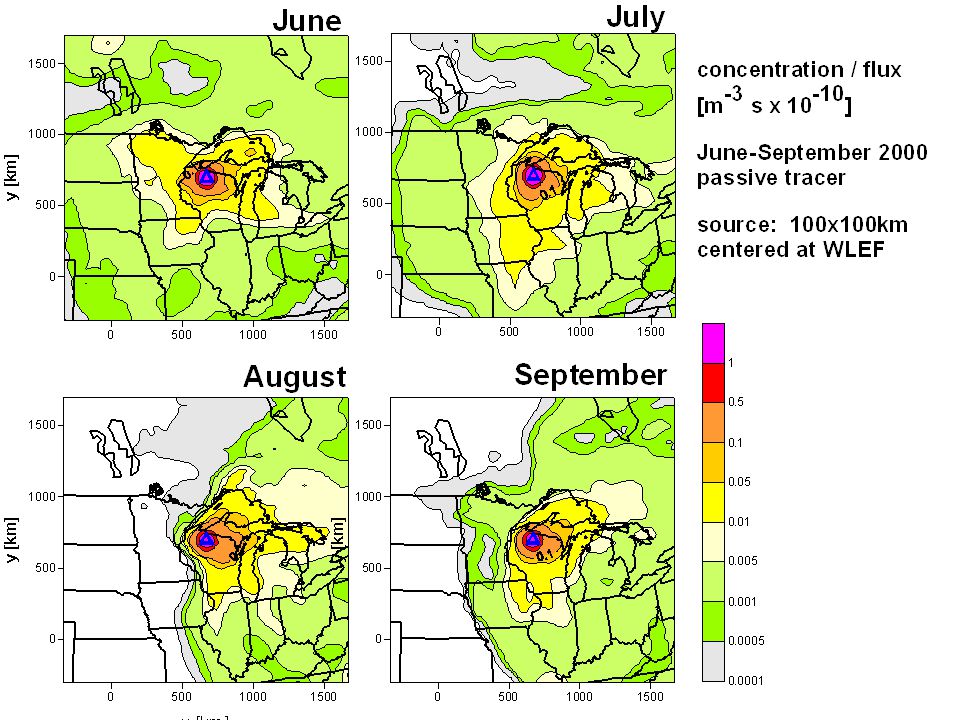
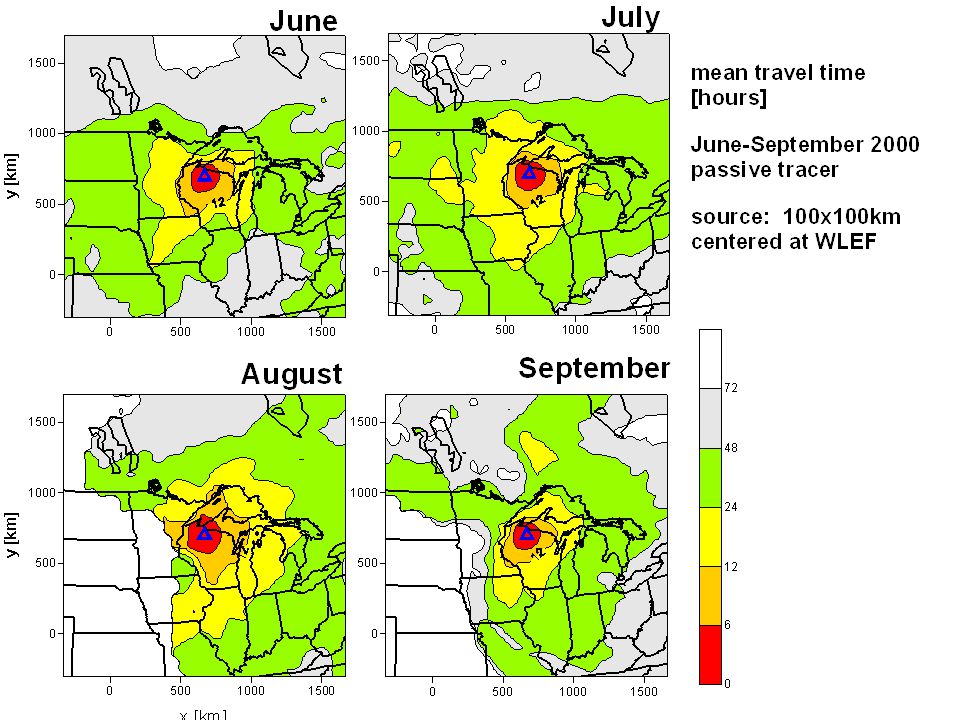
WLEF source plume climatology

Similar presentations


, Christopher Taylor (2), Francoise Guichard (1), Phil Harris (2),>")
>")

 Natasha Miles 1, Marie Obiminda.>")


