Download presentation
Presentation is loading. Please wait.

1
IMPROVE Report 2006 L. Debell, K. Gebhart, B. Schichtel and W. Malm

2
IMPROVE Report Outline Section 1: IMPROVE Data summaries Section 1: IMPROVE Data summaries Chapter 1: Network Overview Chapter 1: Network Overview Chapter 2: IMPROVE-STN Data Comparability Chapter 2: IMPROVE-STN Data Comparability Chapter 3: Spatial trends in the annual average aerosol concentrations and extinction coefficients Chapter 3: Spatial trends in the annual average aerosol concentrations and extinction coefficients Chapter 4: Spatial Variability of monthly patterns in aerosol concentrations and extinction coefficients Chapter 4: Spatial Variability of monthly patterns in aerosol concentrations and extinction coefficients Chapter 5: Trends in aerosol concentrations and extinction coefficients Chapter 5: Trends in aerosol concentrations and extinction coefficients Section 2: Special Study Summaries Section 2: Special Study Summaries Chapter 1: BRAVO Executive Summary and Link to full report Chapter 1: BRAVO Executive Summary and Link to full report Chapter 2: Yosemite Executive Summary and Link to full report Chapter 2: Yosemite Executive Summary and Link to full report Chapter 3: Coarse Mass Study Chapter 3: Coarse Mass Study Chapter 4: IMPROVE Algorithm Review Chapter 4: IMPROVE Algorithm Review Section 3: QA Studies Section 3: QA Studies Chapter 1: Historical Data QA/QC Review Chapter 1: Historical Data QA/QC Review Chapter 2: Denuder Study Chapter 2: Denuder Study Other work Other work Carbon 12/14 study Carbon 12/14 study Hygroscopicity of Smoke and Carbon Aerosols Hygroscopicity of Smoke and Carbon Aerosols

3
IMPROVE Network

4
Fusion of IMPROVE & STN Networks

5
SiOC S Relative Errors from Six Collocated IMPROVE Monitors Average Concentration, (µg/m 3 ) Relative Error [ (x i – y i ) / (x i +y i )/2 ] NO3
![SiOC S Relative Errors from Six Collocated IMPROVE Monitors Average Concentration, (µg/m 3 ) Relative Error [ (x i – y i ) / (x i +y i )/2 ] NO3](http://images.slideplayer.com/16/5148717/slides/slide_5.jpg "SiOC S Relative Errors from Six Collocated IMPROVE Monitors Average Concentration, (µg/m 3 ) Relative Error [ (x i – y i ) / (x i +y i )/2 ] NO3")
6
Relative Errors from Six Collocated IMPROVE & STN Monitors S NO3 Si OC (Blank corrected STN OC data) Average Concentration, (µg/m 3 ) Relative Error (IMPROVE – STN)/Avg
 Average Concentration, (µg/m 3 ) Relative Error (IMPROVE – STN)/Avg")
7
1- Uncertainty IMPROVEin-networkIMPROVE-STN cross network Al19%33% Ca7%28% Fe5%21% Si5%11% Ti4%25% S3%11% SO42%5% NO35%14% EC7%24% OC7%36% blank- corrected STN OC data NA8% Comparability of IMPROVE and STN Measurements X and Y represent the paired annual means Where: Precision in Annual Average Concentrations calculated from collocated data Note, these uncertainties do not contain the error due to a systematic bias

8
IMPROVE Reconstructed Fine Mass

9
IMPROVE & STN Reconstructed Fine Mass

10
IMPROVE Ammonium Sulfate Mass

11
IMPROVE & STN Ammonium Sulfate Mass

12
IMPROVE Organic Carbon Mass

13
IMPROVE & STN Organic Carbon Mass

14
IMPROVE Ammonium Nitrate Mass

15
IMPROVE & STN Ammonium Nitrate Mass

16
IMPROVE Fine Soil Mass

17
IMPROVE & STN Fine Soil Mass

18
IMPROVE Particulate Light Extinction

19
IMPROVE Deciviews

20
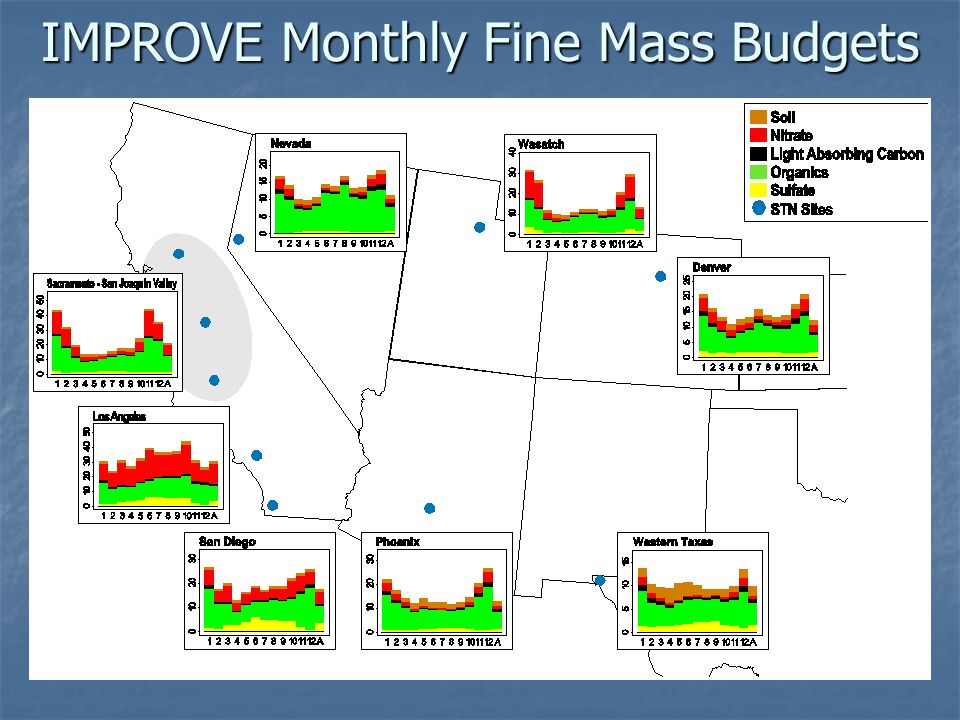
IMPROVE Monthly Fine Mass Budgets

21
STN Monthly Fine Mass Budgets

22
IMPROVE Monthly Fine Mass Budgets

24
Trends in the Best and Worst Haze Days

25
Clear Day Deciview Trend 1995-2004 http://www2.nature.nps.gov/air/Pubs/pdf/gpra/Gpra2005_Report_03202006_Final.pdf

26
Hazy Day Deciview Trend 1995-2004 http://www2.nature.nps.gov/air/Pubs/pdf/gpra/Gpra2005_Report_03202006_Final.pdf

27
Speciated Coarse Mass

28
Coarse Mass

29
Fine Mass

30
Coarse Mass Fraction

31
Fine Mass Fraction

32
Review of Aerosol Optical Properties Derived from IMROVE Particulate and Optical Data

33
Inorganic Light Extinction Efficiencies Organic bext efficiency = (density inorganic / density organic) * inorganic bext efficiency
 * inorganic bext efficiency")
34
Coarse Mass Efficiency Derived from Transmissometer and Particulate data

35
Other NPS/CIRA Work

36
Seasonal Contemporary and Fossil C ( g/m 3 ) The error bars represent the range in six day concentrations
 The error bars represent the range in six day concentrations")
37
Seasonal Fraction Contemporary Carbon The error bars represent the fraction contemporary range

38
Urban Excess Puget Sound, WA - Mount Rainier, WA Puget Sound fossil carbon is primarily due to local sources during winter and summer Puget Sound fossil carbon is primarily due to local sources during winter and summer Summer biogenic carbon is regionally distributed Summer biogenic carbon is regionally distributed ~40% of the winter urban excess is biogenic carbon ~40% of the winter urban excess is biogenic carbon Not all biogenic carbon is “natural” Not all biogenic carbon is “natural”

39
Urban Excess Phoenix, AZ – Tonto, AZ Phoenix fossil carbon is primarily due to local sources during winter and summer Phoenix fossil carbon is primarily due to local sources during winter and summer Summer biogenic carbon is regionally distributed Summer biogenic carbon is regionally distributed About half of the winter urban excess is biogenic carbon About half of the winter urban excess is biogenic carbon Not all biogenic carbon is “natural” Not all biogenic carbon is “natural”

40
Hygroscopicity of Smoke

42
Finished

43
IMPROVE Light Absorbing Carbon Mass

44
IMPROVE & STN Light Absorbing Carbon

45
CM

46
%SO4

48
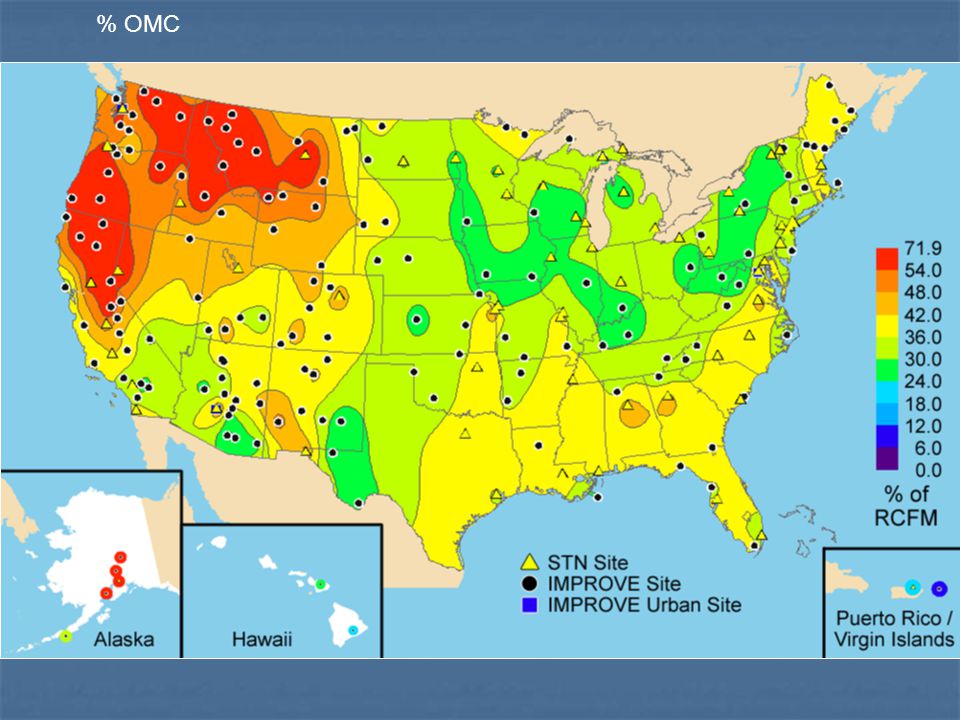
% OMC

50
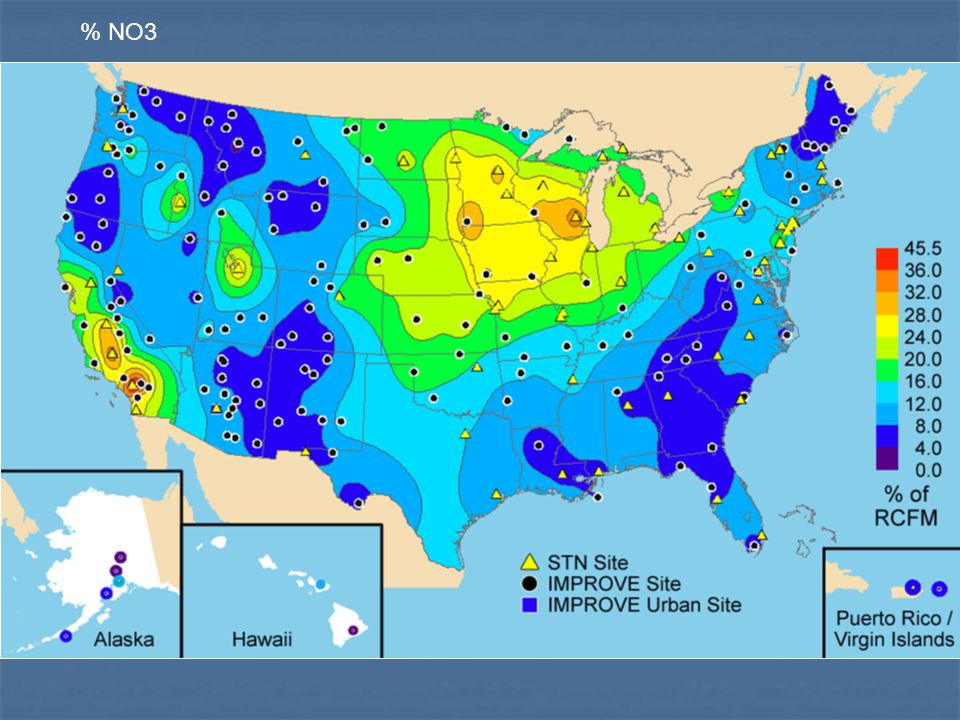
% NO3

52
% LAC

54
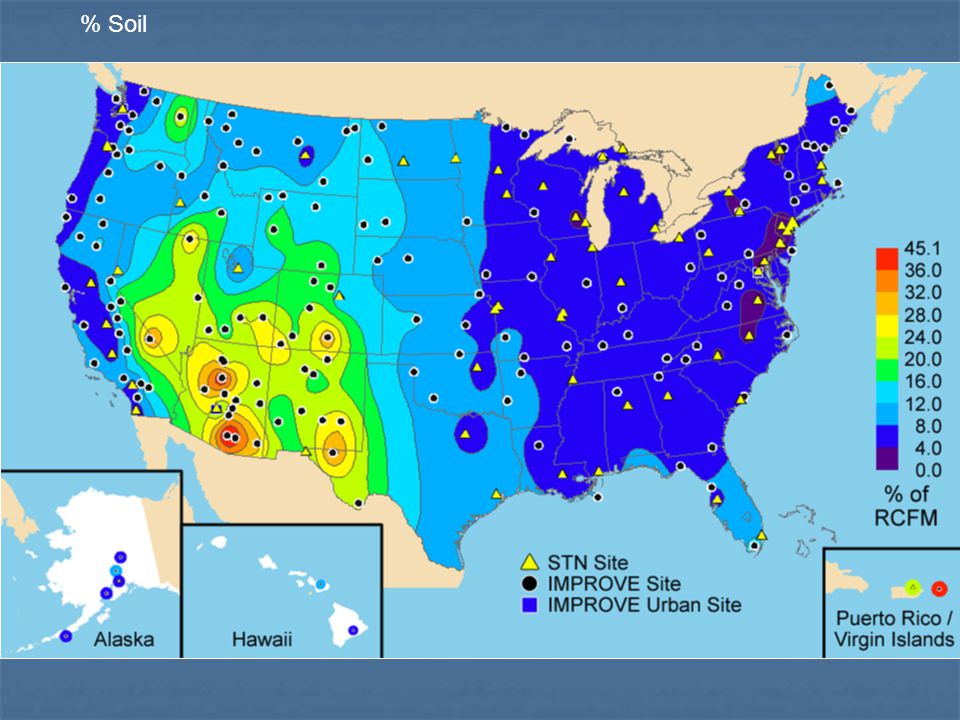
% Soil

56
SO4 extinction

57
OMC extinction

58
NO3 extinction

59
LAC extinction

60
Soil extinction

61
CM extinction

62
STN IMPROVE East STN IMPROVE

63
STN Northwest

64
Southwest STN IMPROVE

65
STN IMPROVE East

66
STN IMPROVE Northwest

67
Southwest

Similar presentations


 William C. Malm (NPS) Graham Bench (LLNL) Graham.>")


 Modeling System Susan M. O'Neill Fire.>")