Download presentation
Presentation is loading. Please wait.

1
GDP – GNP – NNP – NI – PI – DI

2
Real and Nominal GDP “Real“ GDP adjusts for inflation.
Nominal GDP ($GDP) measures national output based on current prices of goods and services. Real GDP measures of the quantity of final goods and services produced Real GDP measures current output at constant prices Real GDP eliminates the influence of price changes from nominal GDP.
 measures national output based on current prices of goods and services. Real GDP measures of the quantity of final goods and services produced. Real GDP measures current output at constant prices. Real GDP eliminates the influence of price changes from nominal GDP.")
3
Did GDP Really Increase?

4
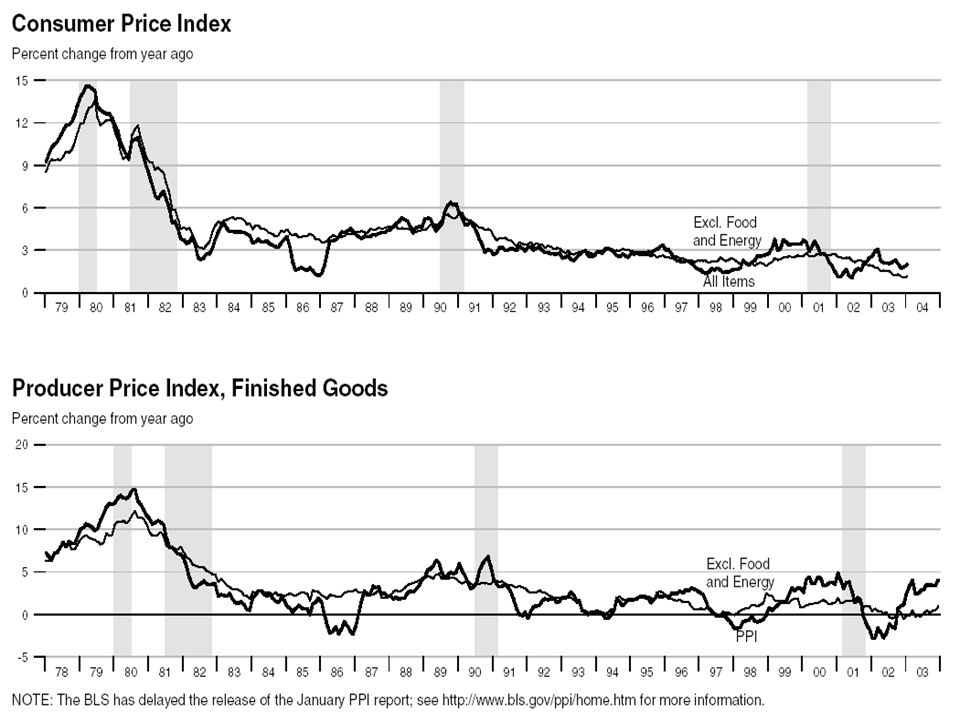
Consumer Price Index (CPI)
measures the cost over time of a typical bundle of goods and services purchased by households. Producer Price Index (PPI) measures average prices received by producers over time for raw materials, intermediate, and final goods. GDP Price Deflator (GDP Price Index, GDPPI) measures average prices over time of all goods and services included in GDP. includes prices of things government buys, capital goods businesses buy, things foreigners buy from us, etc.
 measures average prices received by producers over time for raw materials, intermediate, and final goods. GDP Price Deflator (GDP Price Index, GDPPI) measures average prices over time of all goods and services included in GDP. includes prices of things government buys, capital goods businesses buy, things foreigners buy from us, etc.")
5
Price Indexes The value of a price index in any year indicates how prices have changed relative to a base year. The index is 100 the percent change in prices from the base year. CPI suffers from substitution bias buyers change the mix of goods they buy in response to price changes. Chain-type indexes of real GDP correct for this bias.

6
Composition of CPI: The Shopping Basket

7
GDPPI (GDP Price Deflator), CPI, and PPI
, CPI, and PPI")
8
Business Cycles Business Cycle: the pattern of real GDP rising and falling: expansions and contractions. Recession (Contraction): two or more successive quarters of falling real GDP. Depression: a severe, prolonged economic contraction. Prior to the 1930s, economic downturns were called “crises.” The term depression was introduced so people wouldn’t be scared. The Great Depression gave “depression” a bad name. We now speak of “recessions.”
: two or more successive quarters of falling real GDP. Depression: a severe, prolonged economic contraction. Prior to the 1930s, economic downturns were called crises. The term depression was introduced so people wouldn’t be scared. The Great Depression gave depression a bad name. We now speak of recessions.")
9
The Great Depression Year U.S. Unemployment Rate 1929 3.2% 1930 8.7%
1931 15.9% 1932 23.6% 1933 24.9% 1939 17.2%

10
U.S. Real GDP (Recessions Shaded)
")
11
Annual Growth: Percent Changes in Real GDP

12
The Business Cycle: Some Terminology

13
number in the Labor Force
Unemployment The unemployment rate is the percentage of the labor force that is not working. Rate of Unemployment = number unemployed number in the Labor Force The labor force is: All U.S. residents Over the age of 16 Who are not institutionalized Who are looking for work

14
Understating Unemployment
Discouraged Workers: workers who have looked for work in the past year, but have stopped because they believe no one will offer them a job. Underemployment: employment of workers in jobs that do not fully utilize their productive skills. Overstating Unemployment Employment “off the books in underground economy.

16
Flavors of Unemployment
Seasonal Unemployment Results from recurring changes in hiring needs of certain industries on a seasonal basis. Frictional Unemployment: searching for jobs Results from short-term movement of workers between jobs and job search by those entering the labor force. Improved labor market information can reduce frictional unemployment Structural Unemployment Reflects imperfect match between employee skills and requirements of available jobs. Results from technological change and other changes in the structure of the economy. Cyclical Unemployment Results from business cycle fluctuations. Business activity down cyclical unempl’mt up.

17
Unemployment and Its Costs
“Natural” Rate of Unemployment A normal rate, considering both frictional and structural factors. NAIRU (Nonaccelerating Inflation Rate of Unemployment) -- ~5% for US economy But be aware: The “natural” rate can change! Potential Real GDP The level of output when non-labor resources are fully utilized and unemployment is at its natural rate. GDP gap = potential real GDP – actual GDP
 -- ~5% for US economy. But be aware: The natural rate can change! Potential Real GDP The level of output when non-labor resources are fully utilized and unemployment is at its natural rate. GDP gap = potential real GDP – actual GDP.")
20
Flavors of Price Inflation
Demand-pull inflation: caused by increases in aggregate demand outpacing increases in aggregate supply. Cost-push inflation: increased production costs cause firms to raise prices. Wage-push inflation Energy costs and inflation Hyperinflation: extremely high rate of inflation. Printing money as last resort

22
Rates of Inflation for Selected Countries, 1990-2001

23
Interest Rates Nominal Interest Rate (i): the observed interest rate in the market. Real Interest Rate (r): nominal rate adjusted for inflation (). r = i -

24
The Real Interest Rate on U. S
The Real Interest Rate on U.S. Treasury Bills (Short-Term Securities of US Gov’t)
")
Similar presentations


: two or.>")

: two or more successive.>")
>")

