Download presentation
Presentation is loading. Please wait.

1
Neural Networks Chapter 8

2
8.1 Feed-Forward Neural Networks

3
Figure 8.1 A fully connected feed- forward neural network

5
Equation 8.1 Neural Network Input Format

6
Neural Network Output Format

7
Equation 8.2 The Sigmoid Function

8
Figure 8.2 The sigmoid function

9
8.2 Neural Network Training: A Conceptual View

10
Supervised Learning with Feed-Forward Networks Backpropagation Learning Genetic Learning

12
Unsupervised Clustering with Self-Organizing Maps

13
Figure 8.3 A 3x3 Kohonen network with two input layer nodes

14
8.3 Neural Network Explanation Sensitivity Analysis Average Member Technique

15
8.4 General Considerations What input attributes will be used to build the network? How will the network output be represented? How many hidden layers should the network contain? How many nodes should there be in each hidden layer? What condition will terminate network training?

16
Neural Network Strengths Work well with noisy data. Can process numeric and categorical data. Appropriate for applications requiring a time element. Have performed well in several domains. Appropriate for supervised learning and unsupervised clustering.

17
Weaknesses Lack explanation capabilities. May not provide optimal solutions to problems. Overtraining can be a problem.

18
8.5 Neural Network Training: A Detailed View

19
The Backpropagation Algorithm: An Example

20
Equation 8.3 Backpropagation Error Output Layer

21
Equation 8.4 Backpropagation Error Output Layer

22
Equation 8.5 Backpropagation Error Hidden Layer

23
Equations 8.6 and 8.7 The Delta Rule

24
Equation 8.8 Root Mean Squared Error

25
Kohonen Self-Organizing Maps: An Example

26
Figure 8.4 Connections for two output layer nodes

27
Equation 8.9 Classifying a New Instance Output Node = j

28
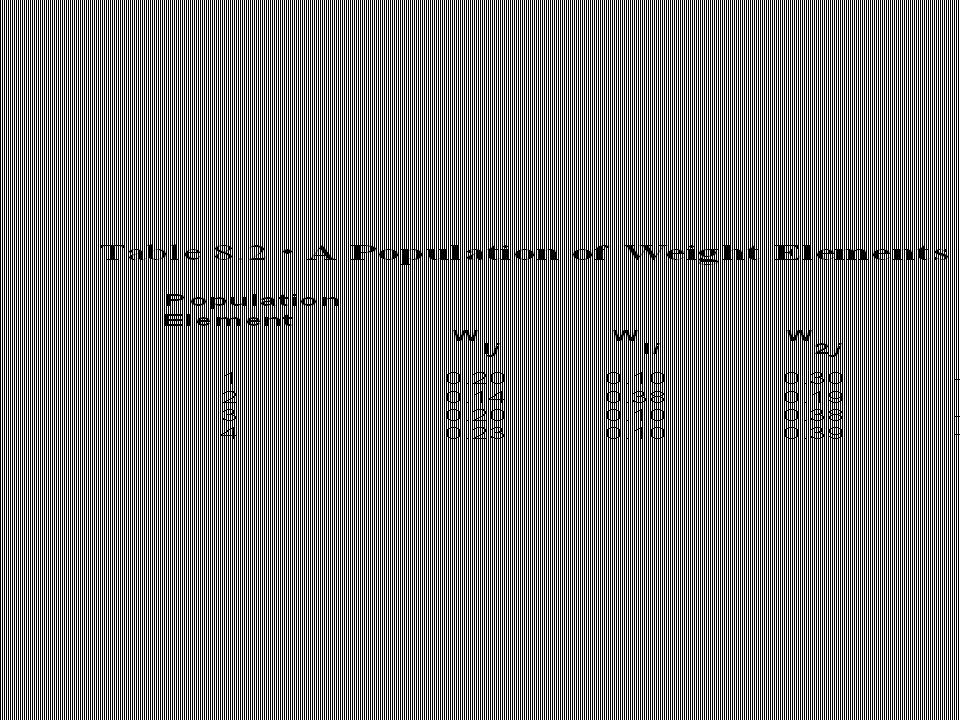
Equation 8.10 Adjusting the Weight Vectors Output Node = j

29
Building Neural Networks with iDA Chapter 9

30
9.1 A Four-Step Approach for Backpropagation Learning 1.Prepare the data to be mined. 2.Define the network architecture. 3.Watch the network train. 4.Read and interpret summary results.

31
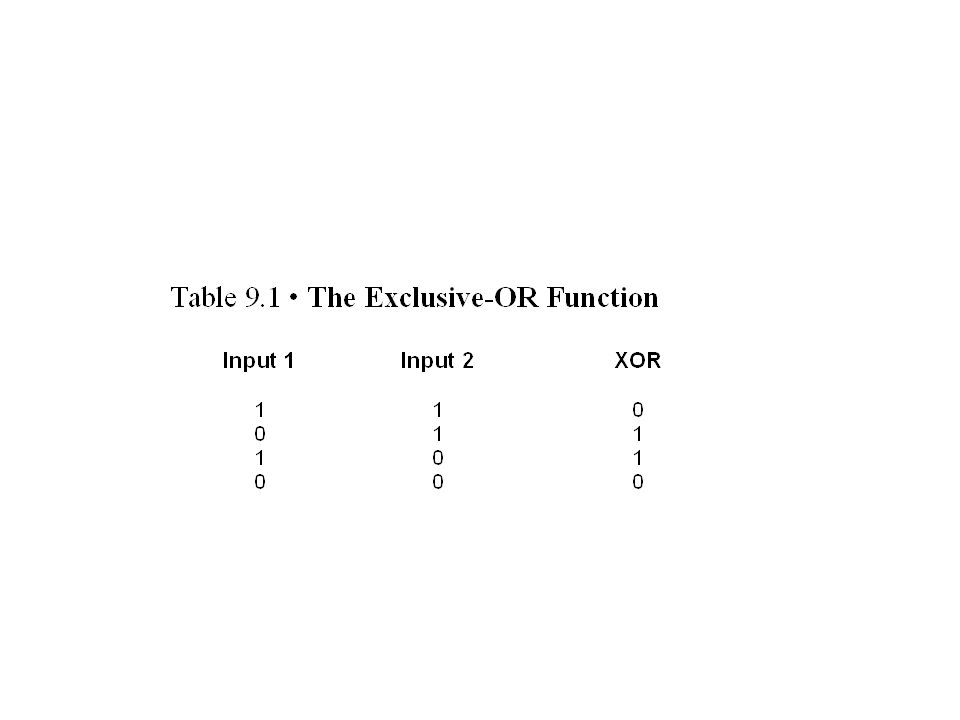
Example 1: Modeling the Exclusive-OR Function

33
Figure 9.1A graph of the XOR function

34
Step 1: Prepare The Data To Be Mined

35
Figure 9.2 XOR training data

36
Step 2: Define The Network Architecture

37
Figure 9.3 Dialog box for supervised learning

38
Figure 9.4 Training options for backpropagation learning

39
Step 3: Watch The Network Train

40
Figure 9.5 Neural network execution window

41
Step 4: Read and Interpret Summary Results

42
Figure 9.6 XOR output file for Experiment 1

43
Figure 9.7 XOR output file for Experiment 2

44
Example 2: The Satellite Image Dataset

45
Step 1: Prepare The Data To Be Mined

46
Figure 9.8 Satellite image data

47
Step 2: Define The Network Architecture

48
Figure 9.9 Backpropagation learning parameters for the satellite image data

49
Step 3: Watch The Network Train

50
Step 4: Read And Interpret Summary Results

51
Figure 9.10 Statistics for the satellite image data

52
Figure 9.11 Satellite image data: Actual and computed output

53
9.2 A Four-Step Approach for Neural Network Clustering

54
Step 1: Prepare The Data To Be Mined The Deer Hunter Dataset

55
Step 2: Define The Network Architecture

56
Figure 9.12 Learning parameters for unsupervised clustering

57
Step 3: Watch The Network Train

58
Figure 9.13 Network execution window

59
Step 4: Read And Interpret Summary Results

60
Figure 9.14 Deer hunter data: Unsupervised summary statistics

61
Figure 9.15 Output clusters for the deer hunter dataset

62
9.3 ESX for Neural Network Cluster Analysis

Similar presentations


 l Biological Neurons l Artificial Neurons l Perceptrons l Multilayer Neural Networks l Backpropagation.>")


>")
 Course website: The back-propagation algorithm Following Hertz chapter 6.>")


