Download presentation
Presentation is loading. Please wait.

1
Long-term variability monitoring of BL Lac and GPS sources at the RATAN-600: the preliminary results Mingaliev M., Sotnikova Yu., Erkenov A. + Metsähovi & Tuorla “extragalactic” people

2
Since 2006 at the RATAN-600 radio telescope under proposal of our Finnish colleagues from Metsähovi and Tuorla observatories the observational program of two samples of sources is carried out: Investigation of radio spectra and variability of GPS sources; Simultaneous spectra of the BL Lacertae Objects. Each program was carried out several times in 2006-2008.

3
The main task of these studies was to determine instantaneous spectra of sources at several epochs in the wide frequency range from 1 to 22 GHz (1, 2.3, 4.8, 7.7, 11.2 and 21.7 GHz). What is the reason for the instantaneous spectra?! Let us look, for example, for the GPS-sources: There are extragalactic radio sources (galaxies and QSO’s) with a spectral peak near 1 GHz; Steep spectrum out of peak frequency; Low variability. About 5-10% of all bright sources are GPS’s.
 with a spectral peak near 1 GHz; Steep spectrum out of peak frequency; Low variability. About 5-10% of all bright sources are GPS’s..")
4
Then if one like to tie physical properties for sources with such spectra he have to deal with the real GPS sources. Compiling spectra from the literature is not correct because of: 1) 1) The results from the different telescopes can be burdened by the huge errors: with the high internal accuracy there can be the large systematic errors (different calibrator scale and so on); 2) 2) The spectra from the different epoch observations might be incorrect due to the variability of radio source itself. That is why it is very important to get instantaneous spectra in a wide wavelength range
 1) The results from the different telescopes can be burdened by the huge errors: with the high internal accuracy there can be the large systematic errors (different calibrator scale and so on); 2) 2) The spectra from the different epoch observations might be incorrect due to the variability of radio source itself. That is why it is very important to get instantaneous spectra in a wide wavelength range.")
5
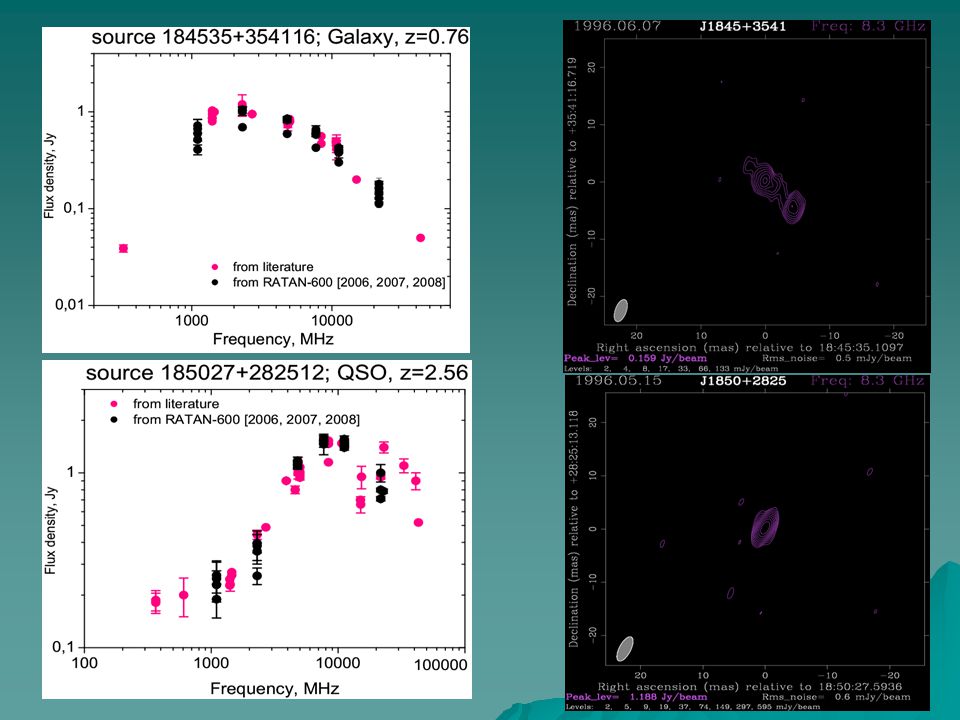
Here are several examples (from the literature and RATAN’s data for the illustration of the state done above :

8
BL Lac objects demonstrate the most violent behavior known among AGNs. Their basic properties include high optical polarization, rapid and strong variability in wide frquency range (Stein et al. 1976; Kollgaard 1994; Jannuzi et al. 1994; Urry & Padovani 1995; and so on…). In the BLO source list are approximately the same number of sources from all BLO subclasses: (HBLs, IBLs and LBLs). The difference between these objects is the peak frequency of the synchrotron component of their spectral energy distribution (HBLs: high-energy peak, LBLs: low-energy peak, IBLs: intermediate).
. In the BLO source list are approximately the same number of sources from all BLO subclasses: (HBLs, IBLs and LBLs). The difference between these objects is the peak frequency of the synchrotron component of their spectral energy distribution (HBLs: high-energy peak, LBLs: low-energy peak, IBLs: intermediate)..")
9
The most of BLOs from the sample have just a few measurements in radio domain (see the lower figure): 29 objects have only 1-3 measurements in radio (data from CATS)..
: 29 objects have only 1-3 measurements in radio (data from CATS)..")
10
RATAN-600 is radio telescope with the ring multi-element antenna about 600 meters in diameter. The main mode of observations is transit mode. Due to the RATAN geometry it is possible to get instantaneous spectra in a wide frequency range. It is possible because of input parts of radiometers with primary feeds are placed along focal line of the cylindrical secondary reflector.

11
λ f0f0f0f0 ΔTΔTΔTΔT T phys T sys CmGHz mK mKK K 1.421.73.515 77 77 2.711.1315 65 65 3.97.7315 62 62 6.34.82.215 39 39 13.02.38310 95 95 31.00.9615310 105 105 49.50.6125310 125 125

12
Four sets of observations were done for each List GPS: 2006 July (N) 2006 October (S) 2007 March (N) 2007 April (S) 2007 September (N+S) 2008 April (N) 2008 June (S) BLac: 2006 September (N) 2006 October (S) 2007 April (S) 2007 June (N) 2007 September (S) 2007 November (N) 2008 May (N) 2008 June (S)
 2006 October (S) 2007 March (N) 2007 April (S) 2007 September (N+S) 2008 April (N) 2008 June (S) BLac: 2006 September (N) 2006 October (S) 2007 April (S) 2007 June (N) 2007 September (S) 2007 November (N) 2008 May (N) 2008 June (S)")
13
Calibration curves for the RATAN North sector (2006); +49° ≤ δ ≤ +82° Calibration curves for the RATAN South sector (2006); -34° ≤ δ ≤ +49°
; +49° ≤ δ ≤ +82° Calibration curves for the RATAN South sector (2006); -34° ≤ δ ≤ +49°")
14
The observations at the RATAN are strict scheduled and in case of missing data because of interferences, bad weather and etc. might be a gap in data For example observations at the elevations of a geostationary satellites are damaged by up-and- down link from satellites at 11.1 GHz (Dec=-10 0 )
.")
15
Set21.7GHz11.2GHz7.7 GHz4.8 GHz2.3 GHz1.1 GHz Flux densities for the GPS List (N = 122) I88.6%94.3%89.4%100% 98.4% II97.6%95.9%100% 97.6% III96.7%95.9%100% 97.5% IV100%97.5%100% 98.3% Flux densities for the BLO List (N = 116) I46.9%85.7%92.9%99%90.8%82.7% I57.6%92.9%98.9%100%87.9%81.8% III87.6%93.8%100% 96.9%89.7% IV Observations done but data reduction did not yet finished
 I88.6%94.3%89.4%100% 98.4% II97.6%95.9%100% 97.6% III96.7%95.9%100% 97.5% IV100%97.5%100% 98.3% Flux densities for the BLO List (N = 116) I46.9%85.7%92.9%99%90.8%82.7% I57.6%92.9%98.9%100%87.9%81.8% III87.6%93.8%100% 96.9%89.7% IV Observations done but data reduction did not yet finished")
16
Results (GPS) 1) For all source spectral types were determined: 64 - spectra with maximum (most of them are QSOs); 12 - falling spectra ( < -0.5) (most of them are galaxies); 46 - flat spectra ( > -0.5) (most of them are QSOs). 2) Objects identified as GPS-quasars mainly have compact structure (core or core/jet); only 14% have a compact symmetrical structure at 8.3 GHz (http://lacerta.gsfc.nasa.gov/vlbi/images). 3) Objects selected as GPS-galaxies mainly have a compact symmetrical structure (36.8%). 4) The others have no identification with optical sources.
 Objects identified as GPS-quasars mainly have compact structure (core or core/jet); only 14% have a compact symmetrical structure at 8.3 GHz ( 3) Objects selected as GPS-galaxies mainly have a compact symmetrical structure (36.8%). 4) The others have no identification with optical sources..")
17
Results (BL Lacs) The source spectral types were determined: 10 - spectra with maximum; 17 - falling spectra ( < -0.5); 62 - flat spectra (-0.5 < < 0); 12 - increasing ( > 0); 10 – with minimum (increasing at high frequency); 5 - the shape of spectra didn’t determine exactly.
 The source spectral types were determined: 10 - spectra with maximum; 17 - falling spectra ( < -0.5); 62 - flat spectra (-0.5 < < 0); 12 - increasing ( > 0); 10 – with minimum (increasing at high frequency); 5 - the shape of spectra didn’t determine exactly.")
18
Spectral index distribution of the GPS-candidates

19
Spectral index distribution for the BLO sample: mean spectral index practically doesn’t change with frequency and corresponds to the flat spectrum.

20
The relation between the variability index and frequency for all BLO subclasses:

21
Average peak frequency for GPS-quasars 4814 MHz, for GPS-galaxies 4291 MHz For GPS-galaxies =0.65 for GPS-quasars = 1.77

22
Some examples

25
Conclusions 1)The multi-frequency spectra measured for objects of two samples at 4 epochs. 2)52.5% of sources from GPS-list were selected as candidates for GPS-sources. The further monitoring of these spectra will allow us to determine if they are GPS sources indeed or these are source at the active stage of burst. 3)Sources with rising spectra might be the GPS- sources with spectra maximum at higher frequencies than the RATAN one. 4)GPS-quasars have greater red shift and average peak frequency than GPS-galaxies. 5)GPS-galaxies have compact symmetrical structure more often than GPS-quasars.
52.5% of sources from GPS-list were selected as candidates for GPS-sources. The further monitoring of these spectra will allow us to determine if they are GPS sources indeed or these are source at the active stage of burst. 3)Sources with rising spectra might be the GPS- sources with spectra maximum at higher frequencies than the RATAN one. 4)GPS-quasars have greater red shift and average peak frequency than GPS-galaxies. 5)GPS-galaxies have compact symmetrical structure more often than GPS-quasars..")
26
What is further? 1)October-November 2008: the next and the last set of observations of these Applications (there were applied for 2 years); 2)Interpretation of data; 3)Further observations?
October-November 2008: the next and the last set of observations of these Applications (there were applied for 2 years); 2)Interpretation of data; 3)Further observations .")
Similar presentations


 Debanjan Bose (On behalf of PACT collaboration) “The Multi-Messenger Approach.>")


 2009.11.4 fermi symposium.>")
>")

 Kousuke Sugimori, Nobuyuki Kawai (Tokyo Tech.) Hitishi Negoro (Nihon Univ.) Mutsumi Sugizaki, Masaru Matsuoka.>")

 Observations of Extragalactic “Point” Sources Bruce Partridge, for Planck WG6 Haverford College, Haverford PA>")
 Blazar properties The Blazar.>")

