Download presentation
Presentation is loading. Please wait.

1
Lecture 172/28/07 LECTURE TONIGHT

2
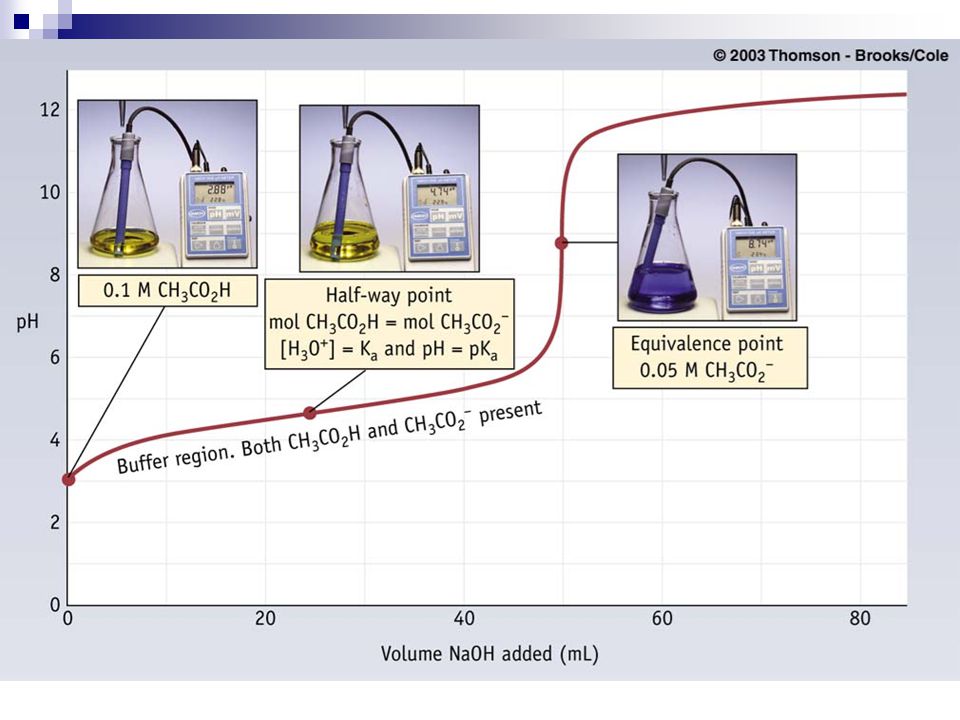
Titration Curve Why do you use one? Equivalence point vs. Endpoint pH vs. acid/base added

5
Building a titration curve via calculations 4 Regions (to build one from calculations): 1) initial pH 2) before equivalence point 3) at equivalence point 4) after equivalence point
: 1) initial pH 2) before equivalence point 3) at equivalence point 4) after equivalence point")
6
Building a titration curve via calculations Comparison of a titration of a strong acid vs. a weak acid Regionx-axis (mL of acid/base) 0.1 M NaOH y-axis (pH) 100 mL of 0.1 M HCl y-axis (pH) 100 mL of 0.1 M HF Initial pH Before the equivalence point (1/2 equiv. point) equivalence point After the equivalence point
 0.1 M NaOH y-axis (pH) 100 mL of 0.1 M HCl y-axis (pH) 100 mL of 0.1 M HF Initial pH Before the equivalence point (1/2 equiv. point) equivalence point After the equivalence point.")
7
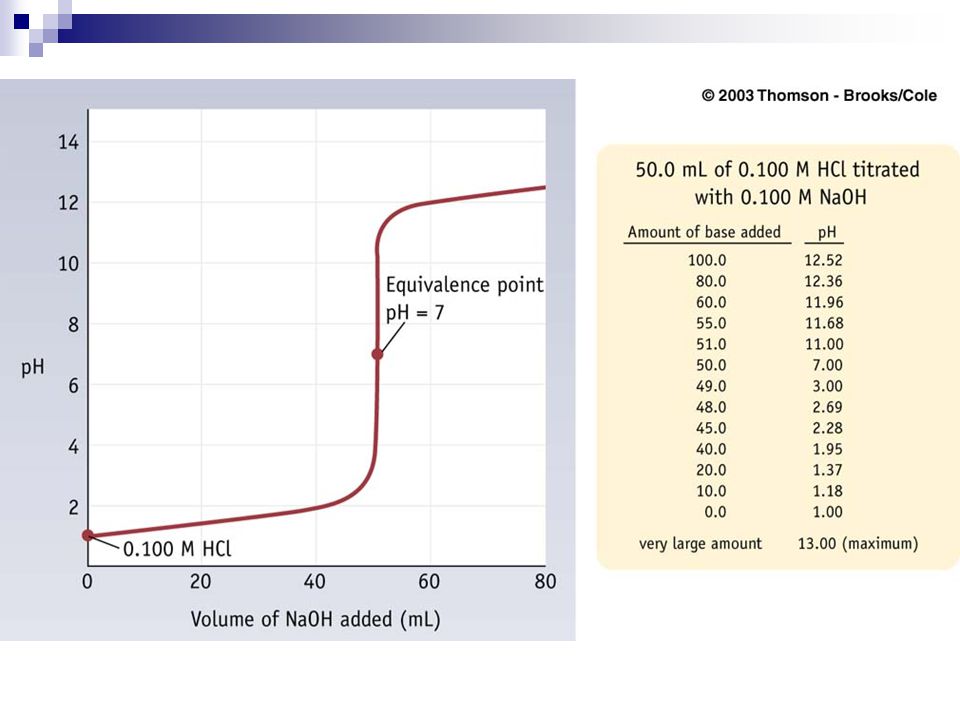
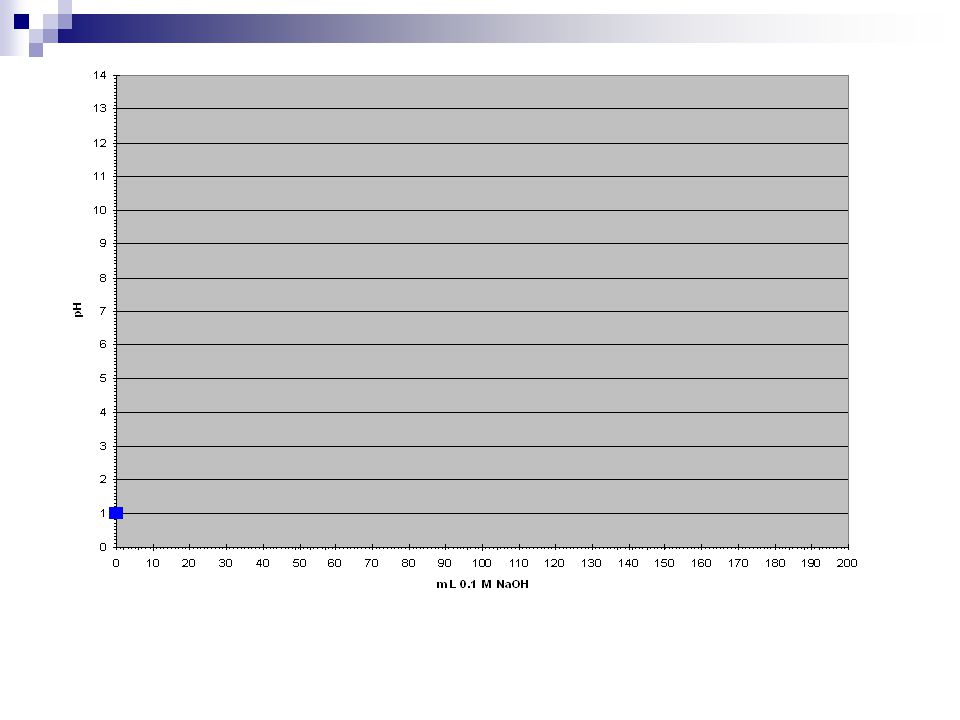
Initial pH (NaOH titrating HCl) X-axis: Y-axis:
 X-axis: Y-axis:")
8
Building a titration curve via calculations Comparison of a titration of a strong acid vs. a weak acid Regionx-axis (mL of acid/base) 0.1 M NaOH y-axis (pH) 100 mL of 0.1 M HCl y-axis (pH) 100 mL of 0.1 M HF Initial pH 01 Before the equivalence point (1/2 equiv. point) equivalence point After the equivalence point
 0.1 M NaOH y-axis (pH) 100 mL of 0.1 M HCl y-axis (pH) 100 mL of 0.1 M HF Initial pH 01 Before the equivalence point (1/2 equiv. point) equivalence point After the equivalence point.")
10
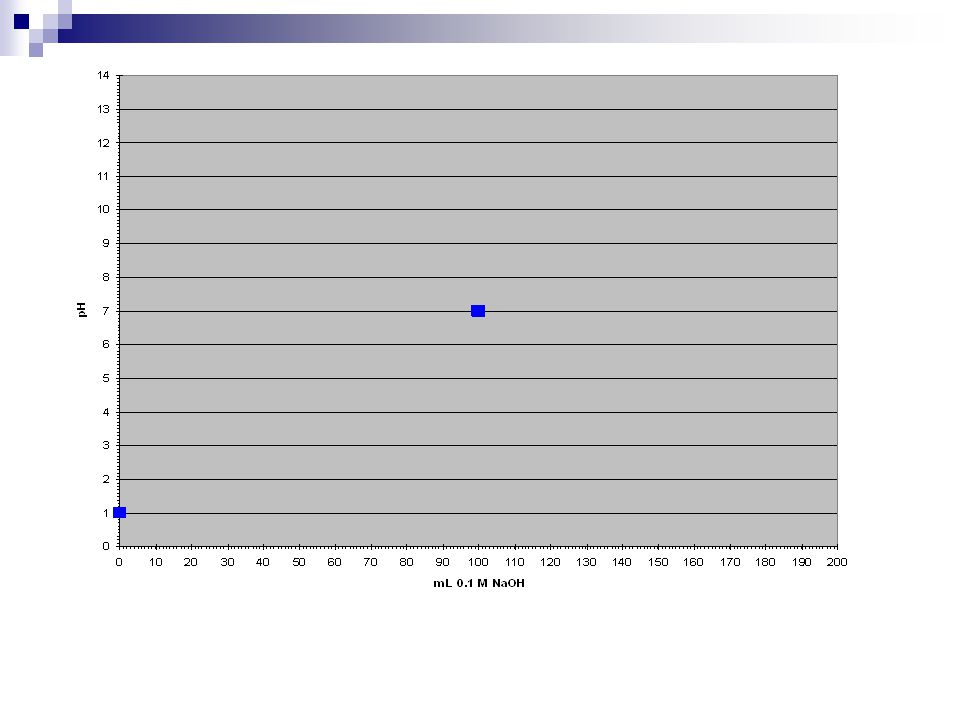
Equivalence point (NaOH titrating HCl) X-axis Y-axis
 X-axis Y-axis")
11
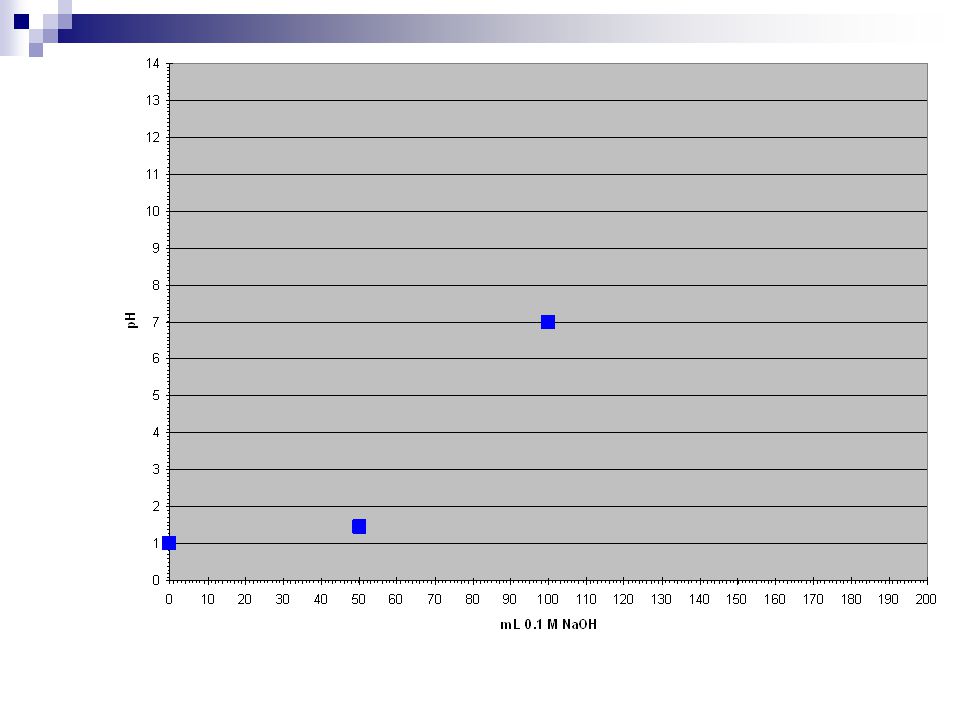
Building a titration curve via calculations Comparison of a titration of a strong acid vs. a weak acid Regionx-axis (mL of acid/base) 0.1 M NaOH y-axis (pH) 100 mL of 0.1 M HCl y-axis (pH) 100 mL of 0.1 M HF Initial pH 01 Before the equivalence point (1/2 equiv. point) equivalence point 1007 After the equivalence point
 0.1 M NaOH y-axis (pH) 100 mL of 0.1 M HCl y-axis (pH) 100 mL of 0.1 M HF Initial pH 01 Before the equivalence point (1/2 equiv. point) equivalence point 1007 After the equivalence point.")
13
½ Equivalence point (NaOH titrating HCl) X-axis Y-axis
 X-axis Y-axis")
14
Building a titration curve via calculations Comparison of a titration of a strong acid vs. a weak acid Regionx-axis (mL of acid/base) 0.1 M NaOH y-axis (pH) 100 mL of 0.1 M HCl y-axis (pH) 100 mL of 0.1 M HF Initial pH 01 Before the equivalence point (1/2 equiv. point) 501.47 equivalence point 1007 After the equivalence point
 0.1 M NaOH y-axis (pH) 100 mL of 0.1 M HCl y-axis (pH) 100 mL of 0.1 M HF Initial pH 01 Before the equivalence point (1/2 equiv. point) equivalence point 1007 After the equivalence point.")
16
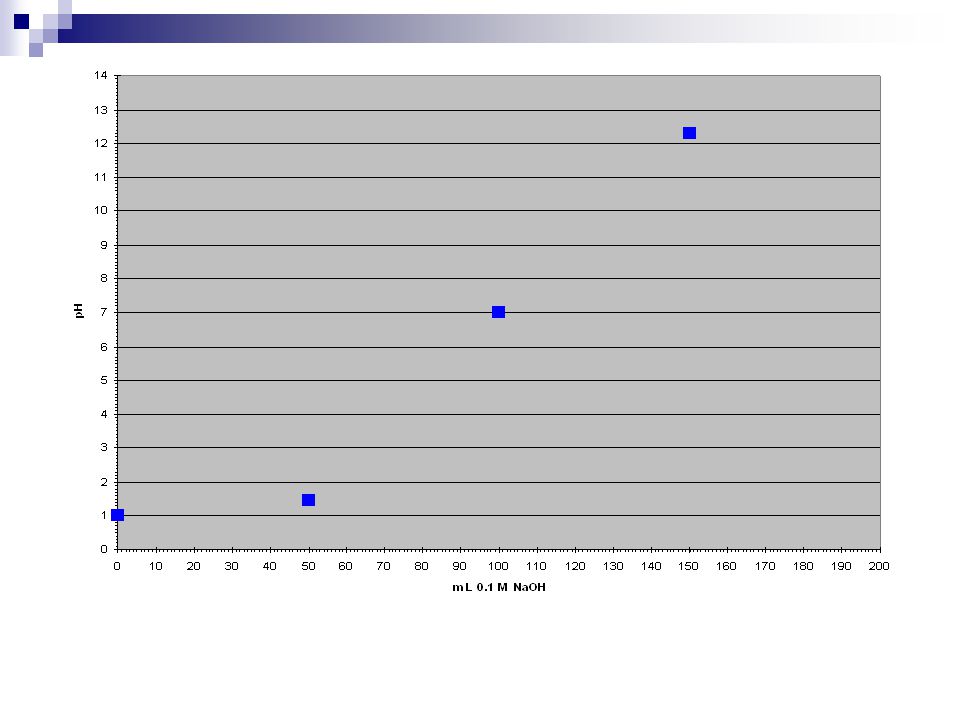
After Equivalence point (NaOH titrating HCl) X-axis Y-axis
 X-axis Y-axis")
17
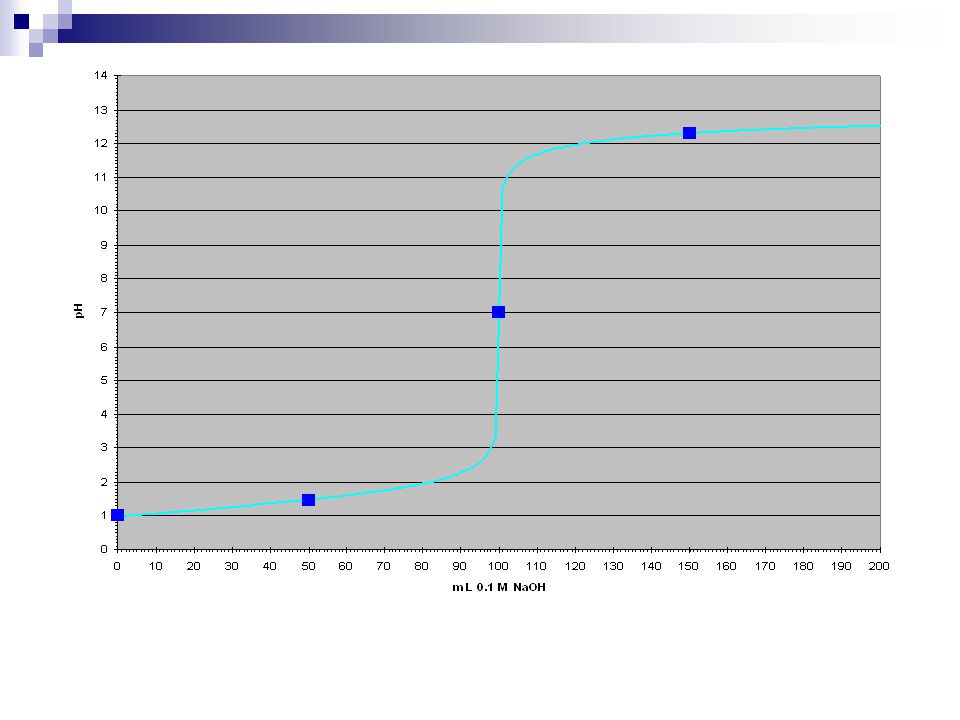
Building a titration curve via calculations Comparison of a titration of a strong acid vs. a weak acid Regionx-axis (mL of acid/base) 0.1 M NaOH y-axis (pH) 100 mL of 0.1 M HCl y-axis (pH) 100 mL of 0.1 M HF Initial pH 01 Before the equivalence point (1/2 equiv. point) 501.47 equivalence point 1007 After the equivalence point 15012.3
 0.1 M NaOH y-axis (pH) 100 mL of 0.1 M HCl y-axis (pH) 100 mL of 0.1 M HF Initial pH 01 Before the equivalence point (1/2 equiv. point) equivalence point 1007 After the equivalence point")
20
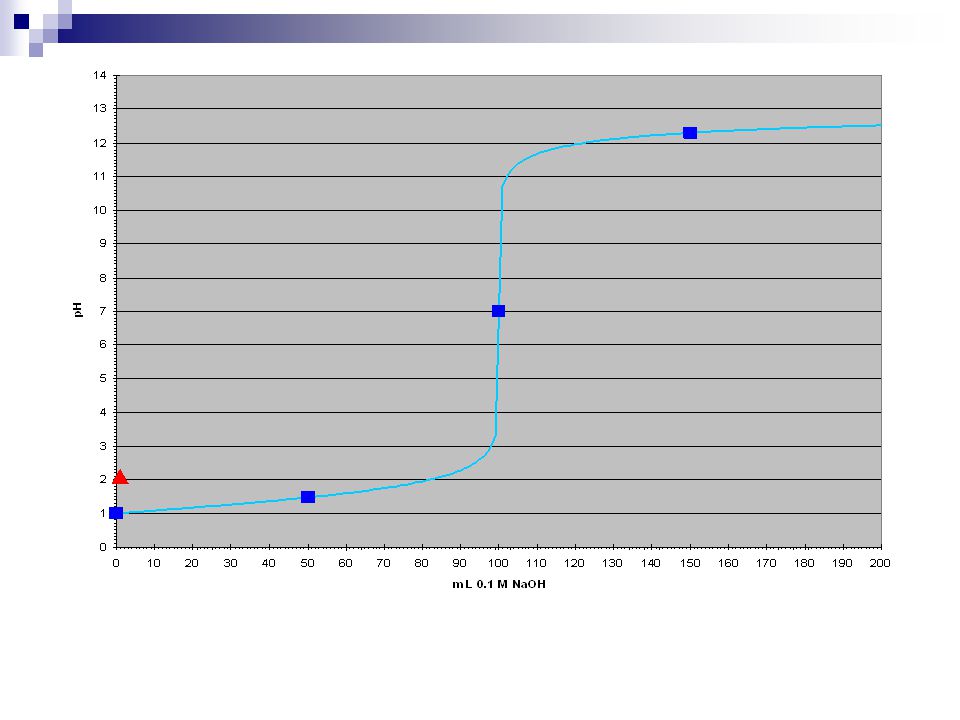
Initial pH (0.1 M NaOH titrating 0.1 M HF) K a = 6.8 x 10 -4 X-axis: Y-axis:
 K a = 6.8 x X-axis: Y-axis:")
21
Building a titration curve via calculations Comparison of a titration of a strong acid vs. a weak acid Region x-axis (mL of acid/base) 0.1 M NaOH y-axis (pH) 100 mL of 0.1 M HCl y-axis (pH) 100 mL of 0.1 M HF Initial pH 012.10 Before the equivalence point (1/2 equiv. point) 501.47 equivalence point 1007 After the equivalence point 15012.3
 0.1 M NaOH y-axis (pH) 100 mL of 0.1 M HCl y-axis (pH) 100 mL of 0.1 M HF Initial pH Before the equivalence point (1/2 equiv. point) equivalence point 1007 After the equivalence point")
23
Equivalence point (NaOH titrating HF) X-axis Y-axis
 X-axis Y-axis")
Similar presentations

 is when.>")


 Titrant (0.2 M) Initial pH pH at equivalence point pH at 2X equivalence point X-axis at equivalence point Strong.>")
![Titrations. Strong Acid with Strong Base Starting pH pH = -log[F Acid ] Just before the Equivalence Point [H + ] = (V acid ·F acid -V base ·F base )/(V.](/16/5205087/big_thumb.jpg "Titrations. Strong Acid with Strong Base Starting pH pH = -log[F Acid ] Just before the Equivalence Point [H + ] = (V acid ·F acid -V base ·F base )/(V.>")


 = 4.5 x 10 -4.>")

 Strong acid with strong base. 2) Strong.>")
 0.00 mL strong.>")


