Download presentation
Presentation is loading. Please wait.

1
Wyoming Department of Revenue The Role of Sales and Use Taxes in Funding Local Government

2
Summary Matrix of Major Revenue Sources Local Government

3
Resort District Tax

4
Economic Development Tax

5
Impact Assistance Funding Impact Assistance provides additional sales tax revenue to local entities impacted by major industrial construction projects. Project must first be qualified for assistance by the Industrial Siting Council. – Once qualified the Department of Revenue calculates a 12 month base period average to establish the baseline for funding. – During the life of the project the department measures the difference between the base period average and the actual sales tax collections from the affected jurisdiction. – The difference between the base period average and actual collections is distributed to the affected jurisdictions based on a percentage supplied by the Industrial Siting Council. The funding formula can be negatively affected by exemptions which minimize the additional taxes collected during construction. Note the $14M dollar decrease in sales tax collected from FY2009 to FY2010.

6
Impact Assistance Tax Program Wyoming Statutes provide for counties that have a major construction project of $170.3 million or larger to receive extra revenue in direct proportion to any increase in their tax collections to help with the impact caused by the project. These funds are transferred from the State General Fund to the county treasurer. EntitySales TaxUse TaxTotal FY-2009Carbon County $ 1,087,114.34 $ - $ 1,087,114.34 Albany County $ 150,558.51 $ - $ 150,558.51 Converse County $ 1,252,801.51 $ 116,384.88 $ 1,369,186.39 Natrona County $ 192,575.18 $ 15,445.96 $ 208,021.14 Campbell County $ 9,502,831.94 $ 1,564,746.31 $ 11,067,578.25 Weston County $ 199,235.37 $ 35,591.41 $ 234,826.78 Crook County $ 1,621,844.45 $ 256,516.41 $ 1,878,360.86 Johnson County $ 123,849.01 $ 22,124.39 $ 145,973.40 Sheridan County $ 134,618.47 $ 24,048.26 $ 158,666.73 Totals $ 14,265,428.78 $ 2,034,857.62 $ 16,300,286.40 FY-2010Albany County $ 24,033.47 $ 7,836.16 $ 31,869.63 Campbell County $ 124,406.07 $ 1,527,377.69 $ 1,651,783.76 Carbon County $ 8,011.16 $ 80,905.74 $ 88,916.90 Converse County $ 170.84 $ 30,013.12 $ 30,183.96 Crook County $ 29,934.12 $ 241,783.92 $ 271,718.04 Johnson County $ 130.98 $ 23,010.06 $ 23,141.04 Sheridan county $ 142.36 $ 25,010.92 $ 25,153.28 Sweetwater County $ - $ 65,364.45 Weston County $ 210.69 $ 37,016.19 $ 37,226.88 Totals $ 187,039.69 $ 2,038,318.25 $ 2,225,357.94

7
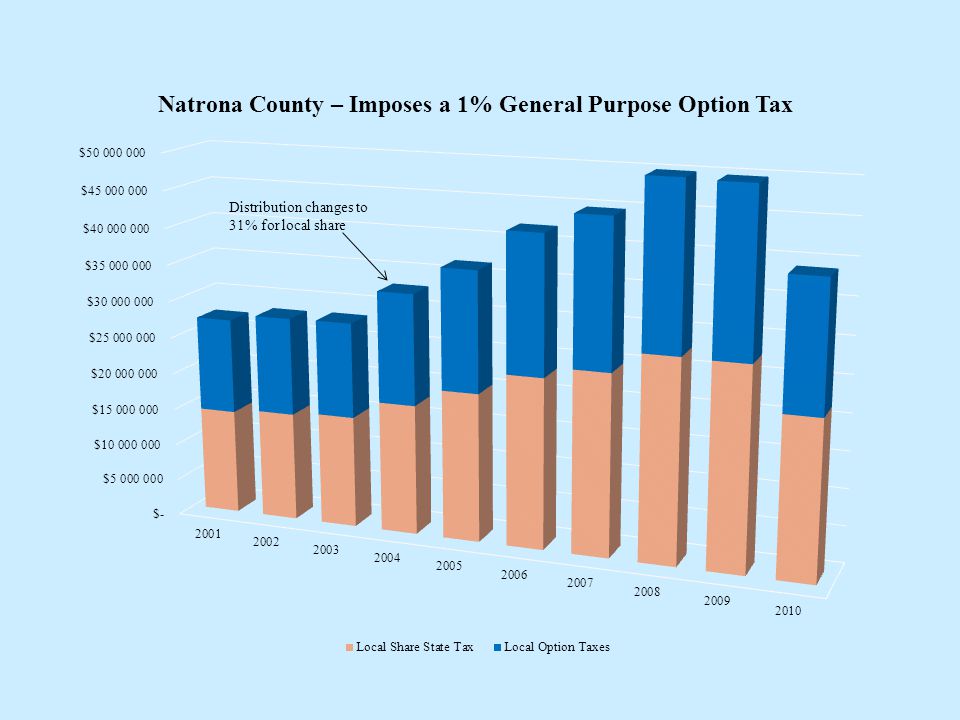
Sales Tax Rates and Distribution Counties may impose up to three percent (3%) in additional general purpose, specific purpose and economic development taxes with voter approval. One percent of the collected option taxes are deposited into the general fund for administrative purposes, and the remainder is allocated to the local governments based on population within the county. The state rate for sales and use taxes is four percent (4%). Sixty- nine percent (69%) of the state tax goes to the state general fund with the remaining thirty-one percent (31%), less administration fees and a set distribution, going to county governments. The remainder is allocated to the local governments proportionally. based on the population within the county where the sale occurred.
. Sixty- nine percent (69%) of the state tax goes to the state general fund with the remaining thirty-one percent (31%), less administration fees and a set distribution, going to county governments. The remainder is allocated to the local governments proportionally. based on the population within the county where the sale occurred..")
8
Recent Changes to Structure July 1, 2002 the legislature altered the distribution formula for the local share of state sales and use taxes. – Formula changed from 72% - 28% (state/local) of the state tax to 69% - 31% (state/local) to be phased in over a 2 year period. – Also phased in a separate distribution to counties from a 1% carve out of the local share. Provided a flat distribution of $40,000 per county per year. Remainder of the 1% carve out distributed based on relative population within each county July 1, 2004 the manufacturer’s exemption was passed and is due to expire on June 30, 2011. July 1, 2005 redistributed penalties to the school foundation fund.
 of the state tax to 69% - 31% (state/local) to be phased in over a 2 year period. – Also phased in a separate distribution to counties from a 1% carve out of the local share. Provided a flat distribution of $40,000 per county per year. Remainder of the 1% carve out distributed based on relative population within each county July 1, 2004 the manufacturer’s exemption was passed and is due to expire on June 30, July 1, 2005 redistributed penalties to the school foundation fund..")
9
Recent Changes to Structure July 1, 2007 made the 4% state sales tax permanent. July 1, 2007 Effective date for the exemption on food for domestic home consumption. July 1, 2007 added the provision for an economic development option tax. July 1, 2007 legislature increased the maximum local levy of general and specific purpose options to 3% from 2%. (To date no county has imposed the maximum local rate). January, 2010 legislature created an exemption on the sales of equipment for qualifying projects used to generate electricity from renewable resources. Exemption is terminated effective December 31, 2011.
. January, 2010 legislature created an exemption on the sales of equipment for qualifying projects used to generate electricity from renewable resources. Exemption is terminated effective December 31,")
10
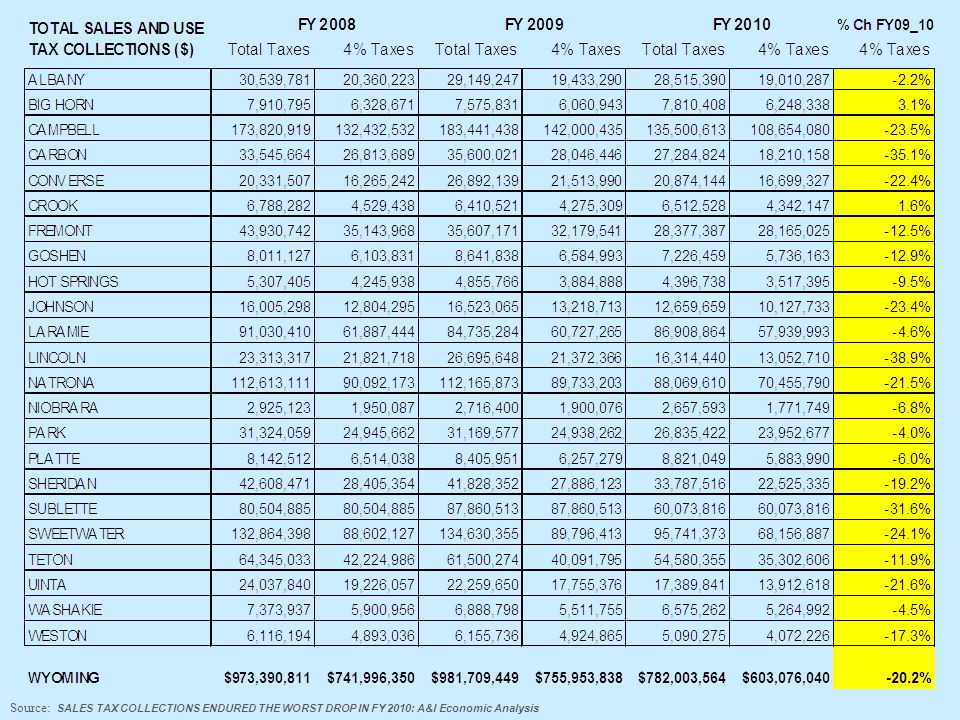
Source: SALES TAX COLLECTIONS ENDURED THE WORST DROP IN FY 2010: A&I Economic Analysis

14
Local Share of State Sales Tax 20062007200820092010 Natrona $ 23,263,527 $ 24,768,665 $ 27,649,207 $ 27,538,440 $ 21,622,882 Laramie 18,866,838 18,054,302 18,992,320 18,636,891 17,781,780 Sheridan 7,473,944 7,159,980 8,715,221 8,557,938 6,912,829 Sweetwater 22,518,622 27,256,333 27,191,902 27,556,328 20,917,336 Albany 6,237,099 6,580,819 6,248,512 5,963,394 5,834,258 Carbon 6,002,628 8,391,195 8,228,992 8,607,402 5,588,595 Goshen 1,815,147 1,677,534 1,873,246 2,020,901 1,760,430 Platte 1,792,674 1,841,539 1,999,021 1,920,335 1,805,797 Big Horn 1,967,109 2,038,091 1,942,256 1,860,059 1,916,316 Fremont 9,429,642 9,663,245 10,785,544 9,875,810 8,643,844 Park 7,620,720 7,455,785 7,655,787 7,652,812 7,350,340 Lincoln 5,684,578 6,619,939 6,697,069 6,559,142 4,005,875 Converse 4,084,651 4,162,915 4,991,791 6,602,611 5,125,025 Niobrara 511,262 555,182 598,480 583,128 543,751 Hot Springs 1,215,216 1,292,606 1,303,072 1,192,258 1,079,489 Johnson 3,479,623 4,135,564 3,929,632 4,056,763 3,106,790 Campbell 32,075,432 36,271,260 40,643,505 43,579,333 33,345,934 Crook 1,160,218 1,266,904 1,390,078 1,312,071 1,332,606 Uinta 5,173,744 5,346,452 5,899,581 5,449,073 4,269,351 Washakie 1,815,177 1,943,651 1,810,991 1,691,529 1,615,828 Weston 1,329,882 1,424,415 1,501,664 1,511,424 1,248,925 Teton 11,649,942 12,259,398 12,958,816 12,303,946 10,834,368 Sublette 16,045,432 23,500,103 24,706,823 26,964,368 18,436,637 $ 191,213,107 $ 213,665,877 $ 227,713,510 $ 231,995,956 $ 185,078,986

15
Local option Taxes 20062007200820092010 Natrona $ 18,760,799 $ 19,974,704 $ 22,295,731 $ 22,207,939 $ 17,437,683 Laramie 30,406,182 29,113,877 28,851,388 23,767,912 28,679,179 Sheridan 12,054,618 11,548,351 14,060,794 13,802,575 11,149,562 Sweetwater 20,230,422 43,521,535 43,819,618 44,385,590 27,308,629 Albany 10,059,776 10,614,061 10,077,763 9,617,822 9,410,056 Carbon 9,650,386 12,891,326 6,664,484 7,478,029 8,983,920 Goshen 1,461,416 1,397,558 1,888,223 2,036,276 1,475,396 Platte 1,445,691 1,485,114 1,612,089 2,127,186 2,907,690 Big Horn 1,586,401 1,645,091 1,566,303 1,499,727 1,546,450 Fremont (1,262) 781,736 8,698,831 3,393,354 210,237 Park 23,486 570,984 6,314,615 6,169,005 2,853,918 Lincoln 4,584,711 5,338,712 1,476,683 5,270,050 3,229,113 Converse 3,294,194 3,356,868 4,025,601 5,324,369 4,133,070 Niobrara 824,618 895,468 965,288 808,162 876,987 Hot Springs 980,005 1,042,427 1,050,852 961,170 870,551 Johnson 2,806,137 3,335,133 3,168,994 3,271,274 2,505,469 Campbell 29,906,348 36,584,255 40,974,508 41,026,566 26,578,068 Crook 1,857,280 2,041,624 2,236,256 2,113,857 2,148,679 Uinta 4,266,490 4,357,260 4,762,965 4,459,231 3,442,450 Washakie 1,450,619 1,552,525 1,458,252 1,363,274 1,297,169 Weston 1,073,439 1,148,726 1,210,927 1,218,561 1,007,869 Teton 19,639,067 20,651,002 21,898,820 21,194,142 19,084,972 Sublette - - - - - $ 176,360,823 $ 213,848,337 $ 229,078,985 $ 223,496,071 $ 177,137,117
 781,736 8,698,831 3,393, ,237 Park 23, ,984 6,314,615 6,169,005 2,853,918 Lincoln 4,584,711 5,338,712 1,476,683 5,270,050 3,229,113 Converse 3,294,194 3,356,868 4,025,601 5,324,369 4,133,070 Niobrara 824, , , , ,987 Hot Springs 980,005 1,042,427 1,050, , ,551 Johnson 2,806,137 3,335,133 3,168,994 3,271,274 2,505,469 Campbell 29,906,348 36,584,255 40,974,508 41,026,566 26,578,068 Crook 1,857,280 2,041,624 2,236,256 2,113,857 2,148,679 Uinta 4,266,490 4,357,260 4,762,965 4,459,231 3,442,450 Washakie 1,450,619 1,552,525 1,458,252 1,363,274 1,297,169 Weston 1,073,439 1,148,726 1,210,927 1,218,561 1,007,869 Teton 19,639,067 20,651,002 21,898,820 21,194,142 19,084,972 Sublette $ 176,360,823 $ 213,848,337 $ 229,078,985 $ 223,496,071 $ 177,137,117")
Similar presentations


 January 2011.>")


