Download presentation
Presentation is loading. Please wait.

1
Office hours 304A Stanley Hall next week 3-4pm Monday Nov 24

2
Genetically identical Genetically different Heritability in exptal organisms

3
Genetic variance = total var - “environmental var” Heritability H 2 = ee tt g = t - e g/tg/t

4
Heritability in humans: MZ twins http://www.sciam.com/media/inline/15DD5B0E-AB41- 23B8-2B1E53E8573428C5_1.jpg http://www.twinsinsurance.net/images/twins.jpg http://www.twinsrealm.com/ot hrpics/sarahandsandra.jpg http://www.twinsrealm.com/othrpics/twins16.jpg Each individual = z ij Total mean sq = (z ij - z) 2 T Mean each pair = z i Within pairs mean sq = (z ij - z i ) 2 N Between pairs mean sq = (z i - z) 2 N-1 = b 2 = w 2 = t 2 h 2 = b 2 w 2 t2t2
 2 T Mean each pair = z i Within pairs mean sq = (z ij - z i ) 2 N Between pairs mean sq = (z i - z) 2 N-1 = b 2 = w 2 = t 2 h 2 = b 2 w 2 t2t2")
5
Significance of heritability? mRNA expression all progeny P1P2 progeny, marker genotype P1 progeny, marker genotype P2

6
How to find genetic determinants of naturally varying traits?

7
Thus far, we have only found linkage to a marker. The causal variant is still unknown.

8
Mapping imprecision wide mapped interval

9
Mapping imprecision wide mapped interval You should now know from the first problem set why the LOD score is highest for markers close to the causal variant locus…

10
Mapping imprecision wide mapped interval But why not just look at the single marker with the best LOD score?

11
Single best locus isn’t the answer observed recombination fraction = 1/8 = 12.5 cM Disease- causing mutation Restriction fragment length polymorphism True distance 30 cM The observed number of recombinants is just a point estimate, with some error associated. this is our observation

12
True variant is “under” peak Fig. 11.17

13
Submergence tolerance in rice

14
Variation in submergence tolerance http://www.a2mediagroup.com/data/images/news/categories/riceplant.jpg

15
Linkage mapping intoleranttolerant

16
Finding the causative variant

19
Transgenic test http://www.plantsci.cam.ac.uk/Haseloff/SITEGRAPHICS/Agrotrans.GIF

20
Transgenic test http://www.plantsci.cam.ac.uk/Haseloff/SITEGRAPHICS/Agrotrans.GIF From Prof. Garriga problem set

21
Transgenic test

23
Only expressed upon submergence

24
Transgenic test Expressed all the time…

25
Now in a real crop strain Swarna INTOLxIR49830 TOL F1 xSwarna INTOL Check for Sub1A+

26
Now in a real crop strain Swarna INTOLxIR49830 TOL F1 xSwarna INTOL B1 xSwarna INTOL Check for Sub1A+

27
Now in a real crop strain Swarna INTOLxIR49830 TOL F1 xSwarna INTOL B1 xSwarna INTOL B2 xSwarna INTOL …

28
Now in a real crop strain Swarna INTOLxIR49830 TOL F1 xSwarna INTOL B1 xSwarna INTOL B2 xSwarna INTOL … Result: Sub1A in Swarna genome

29
Common in plant breeding http://www.anbg.gov.au/cpbr/program/sc/barl_mole.htm Wild: resistant to fungus Cultivated: bred for yield, etc.

30
“Naturally genetically modified”

31
Every linkage study faces this problem What is the causative variant linked to the marker?

32
How to formulate a guess?

33
Here a very obvious hypothesis. Often not such a large gain or loss.

34
Fine-mapping Fig. 11.17

35
Fine-mapping: new markers Fig. 11.17

36
Fine-mapping: new markers Between two humans, 1 polymorphism every 1000 bp; linkage study probably started with a tiny fraction of total.

37
Fine-mapping: new markers Best marker Position of true causal variant A simulation of a qualitative trait in a large mouse cross; sparse marker set

38
Fine-mapping: new markers Best marker Position of true causal variant Peak looks pretty close—why bother improving resolution?

39
Fine-mapping: new markers Best marker Position of true causal variant Because you have to hunt through by hand to find the causal gene, and test experimentally. The smaller the region, the better.

40
Fine-mapping: new markers Position of true causal variant Increased marker density

41
Fine-mapping: new markers Why did the LOD score go up? Position of true causal variant A.More markers increases multiple testing, which boosts LODs in the region. B.Closer markers have more significant linkage, increasing their LODs. C.Peak is narrower, so LODs increase in the region. D.The LOD score scales with the number of markers, so actually it isn’t different if you normalize correctly.

42
What do functional (e.g. disease-causing) variants look like?
 variants look like")
43
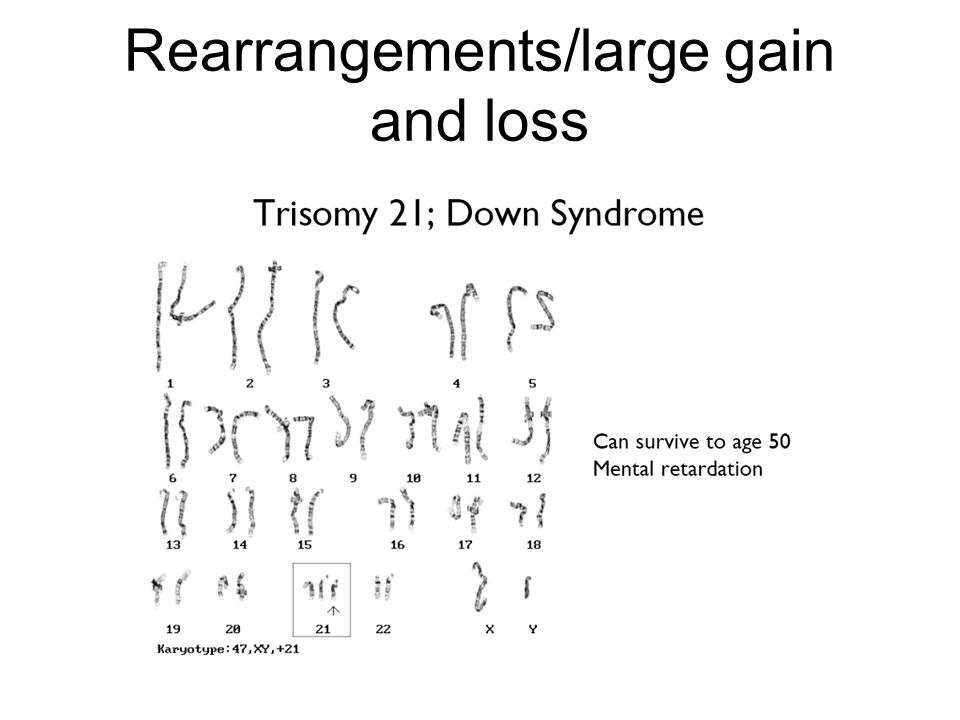
Rearrangements/large gain and loss

45
Coding variants Fig. 7.25

46
Coding variants http://homepages.strath.ac.uk/~dfs99109/BB310/CFTRgene.jpg Fig. 2B

47
Coding variants http://homepages.strath.ac.uk/~dfs99109/BB310/CFTRgene.jpg Fig. 2B New amino acid

48
Coding variants http://homepages.strath.ac.uk/~dfs99109/BB310/CFTRgene.jpg Fig. 2B Premature STOP

49
Coding variants http://homepages.strath.ac.uk/~dfs99109/BB310/CFTRgene.jpg Fig. 2B Regulatory change, not coding!

50
Nucleotide repeat diseases Fig. 11.13 http://graphics.jsonline.com/graphi cs/badger/img/may02/5martin506.j pg

51
Fig. 7A,B http://geneticsmodules.duhs.duke.edu/Design/Print.asp Nucleotide repeat diseases

52
Think about it: most identified variants are rare alleles with strong effect. Most likely to be coding changes.

53
Old school

54
Promoter variants Fig. 9.22

55
Promoter variants Fig. 9.22 Promoter mutations can cause misregulation and disease/phenotype.

56
Promoter variants DOC

57
Promoter variants DOC Subtle single-nucleotide promoter variants probably very common, but hard to find. Stay tuned.

Similar presentations


>")

