Download presentation
Presentation is loading. Please wait.

1
Statistical Process Control
Chapter 14 Statistical Process Control

2
Statistical Quality Control
Acceptance sampling Process Control Attributes Variables Attributes Variables Statistical Quality Control for Acceptance Sampling and for Process Control.

3
Statistical Process Control
Statistical process control is the application of statistical techniques to determine whether a process is delivering what the customer wants. Acceptance sampling is the application of statistical techniques to determine whether a quantity of material should be accepted or rejected based on the inspection or test of a sample.

4
Types of Variations Common Cause Special Cause Random Situational
Chronic Small System problems Mgt controllable Process improvement Process capability Special Cause Situational Sporadic Large Local problems Locally controllable Process control Process stability

6
Variation from Common Causes

7
Variation from Special Causes

8
Causes of Variation Two basic categories of variation in output include common causes and assignable causes. Common causes are the purely random, unidentifiable sources of variation that are unavoidable with the current process. If process variability results solely from common causes of variation, a typical assumption is that the distribution is symmetric, with most observations near the center. Assignable causes of variation are any variation-causing factors that can be identified and eliminated, such as a machine needing repair.

9
Assignable Causes The red distribution line below indicates that the process produced a preponderance of the tests in less than average time. Such a distribution is skewed, or no longer symmetric to the average value. A process is said to be in statistical control when the location, spread, or shape of its distribution does not change over time. After the process is in statistical control, managers use SPC procedures to detect the onset of assignable causes so that they can be eliminated. Location Spread Shape © 2007 Pearson Education

10
Statistical Process Control (SPC)
A methodology for monitoring a process to identify special causes of variation and signal the need to take corrective action when appropriate SPC relies on control charts

11
Control Chart Applications
Establish state of statistical control Monitor a process and signal when it goes out of control Determine process capability

12
Key Idea Capability and Control
Process capability calculations make little sense if the process is not in statistical control because the data are confounded by special causes that do not represent the inherent capability of the process.

13
Capability Versus Control
Capable Not Capable In Control Out of Control IDEAL

14
Commonly Used Control Charts
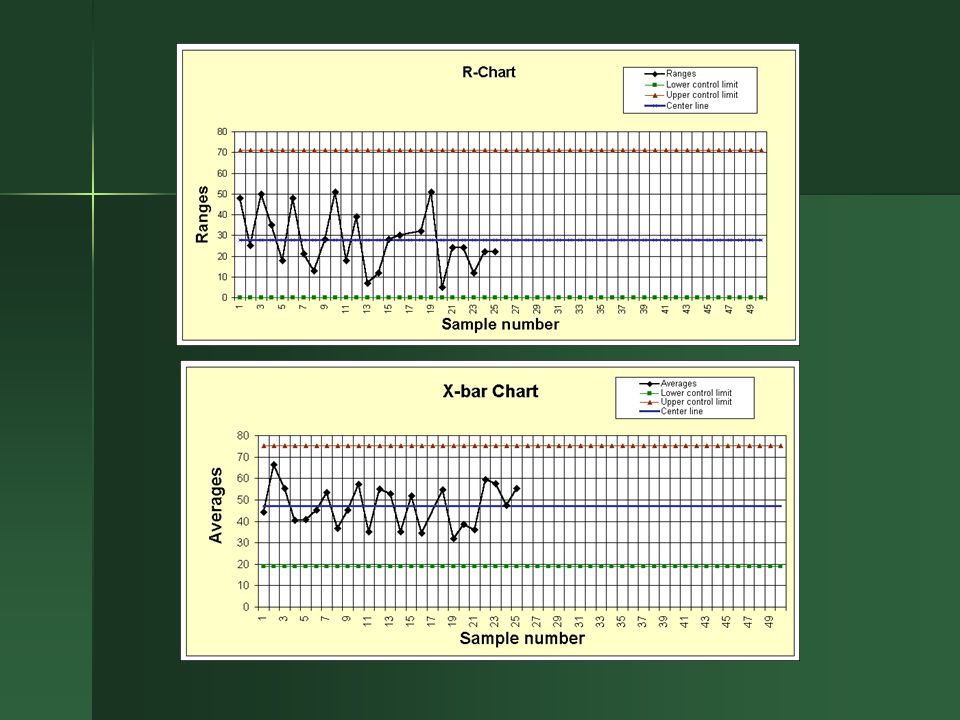
Variables data x-bar and R-charts x-bar and s-charts Charts for individuals (x-charts) Attribute data For “defectives” (p-chart, np-chart) For “defects” (c-chart, u-chart)
 Attribute data. For defectives (p-chart, np-chart) For defects (c-chart, u-chart)")
15
Developing Control Charts
Prepare Choose measurement Determine how to collect data, sample size, and frequency of sampling Set up an initial control chart Collect Data Record data Calculate appropriate statistics Plot statistics on chart

17
Next Steps Determine trial control limits
Center line (process average) Compute UCL, LCL Analyze and interpret results Determine if in control Eliminate out-of-control points Recompute control limits as necessary
 Compute UCL, LCL. Analyze and interpret results. Determine if in control. Eliminate out-of-control points. Recompute control limits as necessary.")
22
Key Idea Interpreting Control Charts
When a process is in statistical control, the points on a control chart fluctuate randomly between the control limits with no recognizable pattern.

23
Typical Out-of-Control Patterns
Point outside control limits Sudden shift in process average Cycles Trends Hugging the center line Hugging the control limits Instability

24
Shift in Process Average

25
Identifying Potential Shifts

26
Cycles

27
Trend

28
Final Steps Use as a problem-solving tool Compute process capability
Continue to collect and plot data Take corrective action when necessary Compute process capability

29
Key Idea Process Monitoring and Control
Control charts indicate when to take action, and more importantly, when to leave a process alone.

30
Spreadsheet Template

32
Special Variables Control Charts
x-chart for individuals

33
Key Idea Charts for Individuals
Control charts for individuals offer the advantage of being able to draw specifications on the chart for direct comparison with the control limits.

34
Charts for Attributes Fraction nonconforming (p-chart)
Fixed sample size Variable sample size np-chart for number nonconforming Charts for defects c-chart u-chart

35
Key Idea Choosing between C- & U-charts
Confusion often exists over which chart is appropriate for a specific application, because the c- and u-charts apply to situations in which the quality characteristics inspected do not necessarily come from discrete units.

36
Control Chart Formulas

37
Control Chart Selection
Quality Characteristic variable attribute defective defect no n>1? x and MR constant sampling unit? yes constant sample size? yes p or np no n>=10 or computer? x and R yes no no yes p-chart with variable sample size c u x and s

38
Control Chart Design Issues
Basis for sampling Sample size Frequency of sampling Location of control limits

39
Key Idea In determining the method of sampling, samples should be chosen to be as homogeneous as possible so that each sample reflects the system of common causes or assignable causes that may be present at that point in time.

40
Key Idea In practice, samples of about five have been found to work well in detecting process shifts of two standard deviations or larger. To detect smaller shifts in the process mean, larger sample sizes of 15 to 25 must be used.

42
Economic Tradeoffs

43
Pre-Control nominal value Green Zone Yellow Zones Red Zone LTL UTL

44
Key Idea Pre-control is not an adequate substitute for control charts and should only be used when process capability is no greater than 88 percent of the tolerance, or equivalently, when Cp is at least If the process mean tends to drift, then Cp should be higher.

Similar presentations