Download presentation
Presentation is loading. Please wait.

1
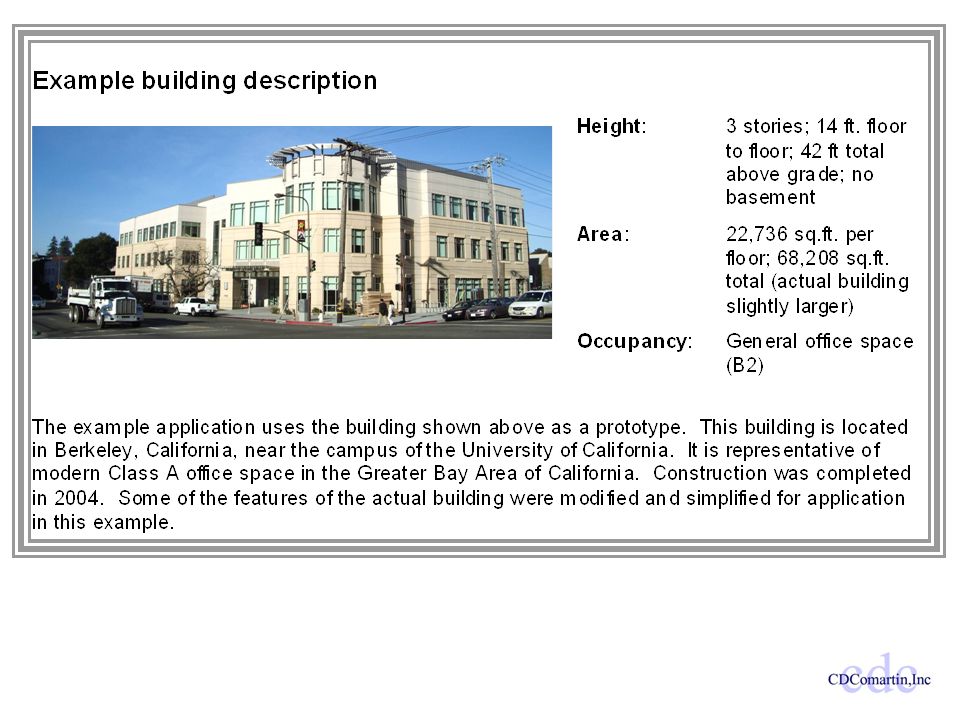
The use of risk in design: ATC 58 performance assessment procedure Craig D. Comartin

2
Outline Traditional code design procedures Performance-based design Risk analysis Risk as a measure of performance Performance assessment procedure Example

3
Traditional code-based design Building Future earthquakes ATTENUATION Seismic waves lengthen and diminish in strength as they travel away from the epicenter. SITE RESPONSE Motion can be amplified by soil conditions. Fault Rock Soil Building Site T V Forces reduced from 500 yr. shaking T V T V Are the elastic forces less than the component capacities ? Yes: code requirement satisified No: make stronger

4
Performance based design Performance Levels Building Damage States Immediate occupancy Life safety Collapse prevention Displacement parameter Force parameter Demand for specific hazard level

5
Qualitative range of performance Collapse Prevention Collapse Prevention Severe structural damage Incipient Collapse Probable falling hazards Possible restricted egress Probable total loss Collapse Prevention Collapse Prevention Severe structural damage Incipient Collapse Probable falling hazards Possible restricted egress Probable total loss Collapse Prevention Collapse Prevention Severe structural damage Incipient Collapse Probable falling hazards Possible restricted egress Probable total loss Demand for specific hazard level Performance levelDamageDowntime

6
Inelastic analysis results Expected losses for an event (HAZUS procedure) Global displacement of building Pushover curve Earthquake force on building slightmoderateextensivecomplete Global displacement of building Pushover curve Earthquake force on building slightmoderateextensivecomplete Fragility relationships Probability Displacement Expected losses for event Casualties Repair/replacement costs Downtime
 Global displacement of building Pushover curve Earthquake force on building slightmoderateextensivecomplete Global displacement of building Pushover curve Earthquake force on building slightmoderateextensivecomplete Fragility relationships Probability Displacement Expected losses for event Casualties Repair/replacement costs Downtime")
7
Displacement parameter Force parameter $, % replacement 025% 50% 100% Downtime, days 01 7 30 180 Casualty rate 0.00.0001 0.001 0.01 0.25 $, % replacement 025% 50% 100% $, % replacement 025% 50% 100% Downtime, days 01 7 30 180 Casualty rate 0.00.0001 0.001 0.01 0.25 Quantitative range of performance

8
Building What do we mean by performance? What can happen? Deaths (safety) Dollars (damage) Downtime (loss of use) P = RISK
 Dollars (damage) Downtime (loss of use) P = RISK.")
9
PEER framing equation Pacific Earthquake Engineering Research Center Decision variable risk of losses DV Damage measure casualties capital loss downtime DM Engineering demand parameter displacement drift etc EDP Intensity measure hazard curve level of shaking IM )(||| IM d EDPdGEDPDMdGDMDVG v
(||| IM d EDPdGEDPDMdGDMDVG v")
10
Performance assessment procedure IM Determine the hazard. EDP Analyze the structure. DM Characterize the damage. DV Compute the loses.

12
Site-specific hazard curve IM

13
Equal hazard spectra IM

14
Deaggregation of hazard IM

15
Ground motion scaling IM

16
Structural analysis Nonlinear model Multiple response history analyses Sets of demands for 10 individual records Statistically generated sets of correlated demands for 200 realizations EDP

17
Sets of demands 10%/50yrs u 1-2 max (%) u 2-3 max (%) u 3-R max (%) a 1 max (g)a 2 max (g)a 3 max (g)a Rmax (g) GM 11.261.451.710.540.870.880.65 GM 21.412.052.430.550.870.770.78 GM 31.371.962.630.751.040.890.81 GM 40.971.872.740.550.921.120.75 GM 50.941.802.020.400.770.740.64 GM 61.732.552.460.450.570.450.59 GM 71.052.152.260.380.590.490.52 GM 81.401.672.100.731.501.340.83 GM 91.591.762.010.590.940.810.72 GM 100.831.682.250.531.000.900.74 EDP
 u 2-3 max (%) u 3-R max (%) a 1 max (g)a 2 max (g)a 3 max (g)a Rmax (g) GM GM GM GM GM GM GM GM GM GM EDP")
18
Performance groups DM

19
Fragilities DM

20
Consequence function for repair costs DM

22
Distribution of losses 00.511.522.533.54 x 10 6 0 0.1 0.2 0.3 0.4 0.5 0.6 0.7 0.8 0.9 1.0 $C (dollar) P(Total Repair Cost <= $C) DV
 P(Total Repair Cost <= $C) DV")
23
0123456 0 0.1 0.2 0.3 0.4 0.5 0.6 0.7 0.8 0.9 1 DV(capital loss, $M) P(losses < DV | IM= 475 yr.) Median loss =$1.1M 0123456 0 0.1 0.2 0.3 0.4 0.5 0.6 0.7 0.8 0.9 1 DV(capital loss, $M) P(losses < DV | IM= 475 yr.) 0123456 0 0.1 0.2 0.3 0.4 0.5 0.6 0.7 0.8 0.9 1 DV(capital loss, $M) P(losses < DV | IM= 475 yr.) Median loss =$1.1M DV
 P(losses < DV | IM= 475 yr.) Median loss =$1.1M DV(capital loss, $M) P(losses < DV | IM= 475 yr.) DV(capital loss, $M) P(losses < DV | IM= 475 yr.) Median loss =$1.1M DV")
24
0123456 0 0.1 0.2 0.3 0.4 0.5 0.6 0.7 0.8 0.9 1 DV(capital loss, $M) P(losses < DV | IM= 475 yr.) 0123456 0 0.1 0.2 0.3 0.4 0.5 0.6 0.7 0.8 0.9 1 DV(capital loss, $M) P(losses < DV | IM= 475 yr.) Loss for 90% confidence $1.9M DV
 P(losses < DV | IM= 475 yr.) DV(capital loss, $M) P(losses < DV | IM= 475 yr.) Loss for 90% confidence $1.9M DV")
25
0123456 0 0.1 0.2 0.3 0.4 0.5 0.6 0.7 0.8 0.9 1 DV(capital loss, $M) P(losses < DV | IM= 475 yr.) 60% Chance that loss exceeds $1M 0123456 0 0.1 0.2 0.3 0.4 0.5 0.6 0.7 0.8 0.9 1 DV(capital loss, $M) P(losses < DV | IM= 475 yr.) 0123456 0 0.1 0.2 0.3 0.4 0.5 0.6 0.7 0.8 0.9 1 DV(capital loss, $M) P(losses < DV | IM= 475 yr.) 60% Chance that loss exceeds $1M 60% Chance that loss exceeds $1M DV
 P(losses < DV | IM= 475 yr.) 60% Chance that loss exceeds $1M DV(capital loss, $M) P(losses < DV | IM= 475 yr.) DV(capital loss, $M) P(losses < DV | IM= 475 yr.) 60% Chance that loss exceeds $1M 60% Chance that loss exceeds $1M DV")
26
0123456 0 0.1 0.2 0.3 0.4 0.5 0.6 0.7 0.8 0.9 1 DV(capital loss, $M) P(losses < DV | IM= 475 yr.) 80% chance losses are between $0.7M and $1.9M 0123456 0 0.1 0.2 0.3 0.4 0.5 0.6 0.7 0.8 0.9 1 DV(capital loss, $M) P(losses < DV | IM= 475 yr.) 0123456 0 0.1 0.2 0.3 0.4 0.5 0.6 0.7 0.8 0.9 1 DV(capital loss, $M) P(losses < DV | IM= 475 yr.) 80% chance losses are between $0.7M and $1.9M 80% chance losses are between $0.7M and $1.9M DV
 P(losses < DV | IM= 475 yr.) 80% chance losses are between $0.7M and $1.9M DV(capital loss, $M) P(losses < DV | IM= 475 yr.) DV(capital loss, $M) P(losses < DV | IM= 475 yr.) 80% chance losses are between $0.7M and $1.9M 80% chance losses are between $0.7M and $1.9M DV")
27
Aggregated loss function 00.511.522.533.54 x 10 6 0 0.05 0.1 0.15 0.2 0.25 Capital loss Annual rate of exceeding capital loss SMRFX - Sa (0.1395g ~ 0.8305g) DV
 DV")
28
To lossFrom hazard DV

29
Annualized loss DV

30
Benefit of retrofit DV

31
Design decisions DV

Similar presentations


>")


 Pacific Earthquake Engineering Research Center (PEER) Strategic Initiatives 2006-2011 Jack Moehle.>")


