Download presentation
Presentation is loading. Please wait.

1
1.1. Definition A. Biochemistry: Biological Chemistry, Physiological Chemistry Chemistry General Chemistry Organic Chemistry—Last parts Inorganic Chemistry Physical Chemistry Quantum Chemistry B. Biochemistry Structures of Biomolecules Bioenergetics Functions of Biomolecutes Biomolecules: Large and small molecules Large ones: Macromolecules like DNA, RNA, proteins and polysaccharides Bioenergetics: Energy flow in the living cells C. Conformation: 2 conformations of ethane Eclipsed Staggered Chapter 1. introduction

2
1.2. Road to modern biochemistry: Page 8 Fig 1.2

3
1.3. Biological Macromolecules: Page 12 Fig. 1.6

4
A. Starch and Cellulose: Homopolymers of Glucose B. Proteins: Heteropolymers of Amino Acids : Acids containing amine groups C. Nucleic Acids: Heteropolymers of Nucleotides( dAMP AMP, dGMP GMP, dTMP UMP, dCMP, CMP) 1.4. Organelles, Cells and Organisms A. Archaebacteria: Methane bacteria B. Prokaryotes: Pro-Before, Karyon- nuts or kernel Page 16 Table 1.1
 1.4. Organelles, Cells and Organisms A. Archaebacteria: Methane bacteria B. Prokaryotes: Pro-Before, Karyon- nuts or kernel Page 16 Table 1.1.")
5
C. Eukaryotes: Eu- Good or well Human body digestive system Liver Hepatocytes Nucleus Chromatin DNA Nucleotides Base, sugar and phosphate C, H, O, N Page 19 Fig. 1.11

6
Page 21 Table 1.2

7
1.5 Life at the Extremes: Page 16 Window on Biochemistry 1.6 Handling cell components: Page 24 Window

8
Chapter 2. The flow of biological information: Cell communication 2.1. Brief Image of information flow: Page 30 Fig. 2.1 Transcription Translation

9
2.2. Storage of Biological information in DNA Genome: The total genetic informational content for each cell Exact duplication Expression of stored information DNA molecules Watson and Crick in 1952: Double helix structure Complementary base pairs by specific hydrogen bondings: C-G and A-T C-G: triple hydrogen bonds A-T: double hydrogen bonds Bases: inside the helix, the backbone : sugar and phosphate Human Genome Project To map and sequence the estimated 3 billion nucleotide base pairs Other living organisams: Bacillus subtilis, Caenorhabditis elegans, Yeast, Arabdopsis thaliana, Rice 30,000-40,000 genes in the human genome Proteomics: The name given to the broad field investigating the thousands of protein products from the genome Bioinformatics: Computer applications to organize the mass of nucleic acid sequence data and studying relationships between protein sequence and structure.

10
2.3 Replication 5’ to 3’, Semi conservative replication DNA polymerases Polymerase Chain Reaction (PCR) 2.4 Transcription Double helix DNA, RNA polymerase rRNA, mRNA, tRNA: Page 35 Table 2.1
 2.4 Transcription Double helix DNA, RNA polymerase rRNA, mRNA, tRNA: Page 35 Table 2.1")
11
2.5 Translation Genetic code: triplet code Page 38 Fig. 2.7

12
Exons and introns Introns are absent in prokaryotes RNA processing: Page 38 Fig. 2.8 Catalytic RNA

13
2.6 Errors in DNA Processing DNA mutations: sickle cell anemia and other inborn metabolic errors 2.7 Information flow through cell membranes A. Signal transduction: B. Second Messengers: cAMP, cGMP, Ca2+ 2.8 Drug design: Page 44 Fig 2.11 A. Interference of Protein synthesis including transcription and translation B. Receptor binding to block the initiation C. Disruption of Signal pathway

14
Chapter 3 Biomolecules in Water Water content: Page 48 Table 3.1, 71-83%

15
3.1 Water the Biological Solvent Weaker interactions: noncovalent bonds- 1-30kj/mole (cf. 350kj/mole for C-C bond) Page 50 Table 3.2 Reversible and specific Van der Waals forces Ionic bonds Hydrogen bonds Hydrophobic interactions
 Page 50 Table 3.2 Reversible and specific Van der Waals forces Ionic bonds Hydrogen bonds Hydrophobic interactions.")
16
B. The structure of water Page 51 Fig. 3.1, sp3 orbitals

17
3.2 Hydrogen bonding and Solubility Physical properties of water: Page 53 Table 3.3, Fig. 3.5 Solvation: Page 54 Fig. 3.6 Amphiphilic Hydrophobic interaction Micelles

18
3.3. Cellular Reactions of Water A. Ionization of water

19
B. pH and pK pH = -log [H+], pKa = -log Ka pH values of some natural fluids: Page 58 Fig 3.10 HA H+ A- Ka = [H+][A-]/[HA] : Acid Conjugate Base pH = pKa log [A-]/[HA]: Handerson-Haselbalch Equation H3PO4 H+ H2PO4-1 pKa1=2.14 H2PO4-1 H+ HPO4-2 pKa2 = 7.20 HPO4-2 H+ HPO4-3 pKa3 = 12,4 Titration curve CH3COOH + NaOH = CH3COONa + H2O Acid Conjugate base pH = pKa log [A-]/[HA] If [A-]/[HA]= 1, log [A-]/[HA] = 0. So pH = pKa 3.4 Buffer system Acid –base conjugate pairs Buffering blood and other cellular fluids: Page 62, Window, Table 3.5 Buffer exercises : Acetate buffer, Phosphate buffer

21
Chapter 4. Amino acids, Peptides and Proteins: Proteins architecture and Biological Functions 4.1. The amino acids in proteins A. D- and L-form: Mirror image ( Enantiomers) B.Classification and Properties Amine group Carboxyl group Net ChargeMigration A cation exchanger pH 7pH 1pH =7pH=1BindingElution Neutral110+10++Second Basic (positively charged) 21+1+2Cathode++ Last Acidic (negatively charged) 12Less than +1 AnodeLess than + First
 B.Classification and Properties Amine group Carboxyl group Net ChargeMigration A cation exchanger pH 7pH 1pH =7pH=1BindingElution Neutral Second Basic (positively charged) Cathode++ Last Acidic (negatively charged) 12Less than +1 AnodeLess than + First.")
22
C. Modified amino acids: 4-hydroxy proline, 5-hydroxy lysine D. Reactivity of amino acids Reagents reacting with amine group: Page 77 Fig 4.9

23
4.2. Polypeptides and Proteins Peptide bonds: Page 101 Fig 5.4 Average molecular weight of all amino acids in the polypeptides: 110

24
B. Amino terminus ( N-terminus), Carboxyl terminus( C-terminus) C. Peptidases, or Proteases D. Oligopeptides: Glutathione(3AA), Enkephalin (5AA), oxytocin( 9AA), vasopressin (9AA), insulin (51 AA) E. Classification Shape- globulins, fibrous proteins Function- Page 79-82 Components- Simple proteins, Complex( Conjugated) proteins ( glyco-, lipo-, metalo- chromo-, phospho-, nucleo-) 4.3 Four levels of protein structure A. Primary structure: Amino acid sequence and disulfide bonds B. Secondary Structure: Conformation of neighboring amino acids: -helix,: Right handed or left handed coil: One turn of the helix: 0.54 nm and 3.6 residues: Page 102 Fig. 5.5 -pleated sheet: parallel, antiparallel: Silk Fibroin or proteins of spider webs Bends and loops: proline and glycin at the bend: Extended bends: loops Super secondary structure or Motifs ( Domains) The individual elements of secondary structures are often combined into stable, geometrical arrangements. , , ,
, Enkephalin (5AA), oxytocin( 9AA), vasopressin (9AA), insulin (51 AA) E. Classification Shape- globulins, fibrous proteins Function- Page Components- Simple proteins, Complex( Conjugated) proteins ( glyco-, lipo-, metalo- chromo-, phospho-, nucleo-) 4.3 Four levels of protein structure A. Primary structure: Amino acid sequence and disulfide bonds B. Secondary Structure: Conformation of neighboring amino acids: -helix,: Right handed or left handed coil: One turn of the helix: 0.54 nm and 3.6 residues: Page 102 Fig. 5.5 -pleated sheet: parallel, antiparallel: Silk Fibroin or proteins of spider webs Bends and loops: proline and glycin at the bend: Extended bends: loops Super secondary structure or Motifs ( Domains) The individual elements of secondary structures are often combined into stable, geometrical arrangements. , , , .")
26
C. Tertiary structure: Conformation of distant amino acids Page 100 Fig. 5.3

27
Primary structure determines the tertiary structure. Denaturing, Renaturing, Native proteins Page 109 Fig 5.14 D. Quaternary structure Monomeric, oligomeric Subunits

28
4.4. Hemoglobin A. Heme – globin B. Heme binding to globin C. Oxygen binding: Page 115, Fig. 5.19 Sigmoidal curve—Positive cooperation( Myoglobin: Hyperbolic) D. Bohr effect: Page 115 Fig. 5.20 H+ and CO2 decrease the affinity of hemoglobin for oxygen molecule 4.5. Fashionable hair: Page 114, Windo
 D. Bohr effect: Page 115 Fig H+ and CO2 decrease the affinity of hemoglobin for oxygen molecule 4.5. Fashionable hair: Page 114, Windo.")
30
Chapter 5. 6. Enzymes 1 6.1 Biological catalysts A. Catalysts: Page 127 Fig 6.2

31
B. Cofactor- in addition to the protein component, another chemical entity, in order to function properly. Metal ions- Zn+2, Mg+2 Coenzymes: Orgnometallic molecules C. Prosthetic groups: cofactor covalently bonded to the proteins Holoenzyme: protein + cofactor Apoenzyme: without cofactor E. Classification : Page 129 Table 6.2

32
6.2 Enzyme Kinetics A. Michaelis Menten equation derivatisation k2 k4 E + S ES E + P k1 k3 ES formation rate: k1[E][S] + k4[E][P], often k4 is very small to be neglected. ES degradation rate: k3[ES] + k2[ES] At Steady state: Rate of formation = rate of degradation k1[E][S] = k3[ES] + k2[ES] [E]total = [E] + [ES] k1([E]total-[ES]) [S] = [ES](k3 + k2) k1[E]total[S]-k1[ES][S] = [ES](k3 + k2) k1[E]total[S]= [ES](k3 + k2) + k1[ES][S] [ES]( k3 + k2 + k1[S]) = k1[E]total[S] [ES] = k1[E]total[S] / ( k3 + k2 + k1[S]) [ES] =[E]total[S] / ( k3 + k2)/k1 +[S]) (k3 + k2)/k1 = Km [ES] =[E]total [S] / ( Km +[S]) dP/dt = Vo = k3[ES] =k3[E]total[S] / ( Km +[S]) k2[E]total = Vmax Vo= Vmax [S]/(Km + [S])
 [S] = [ES](k3 + k2) k1[E]total[S]-k1[ES][S] = [ES](k3 + k2) k1[E]total[S]= [ES](k3 + k2) + k1[ES][S] [ES]( k3 + k2 + k1[S]) = k1[E]total[S] [ES] = k1[E]total[S] / ( k3 + k2 + k1[S]) [ES] =[E]total[S] / ( k3 + k2)/k1 +[S]) (k3 + k2)/k1 = Km [ES] =[E]total [S] / ( Km +[S]) dP/dt = Vo = k3[ES] =k3[E]total[S] / ( Km +[S]) k2[E]total = Vmax Vo= Vmax [S]/(Km + [S]).")
33
B. Km: If V = 1/2 Vmax, Km =[S] C. Turnover number = Vmax/[E]total D. Lineweaver-Burk Equation From Vo= Vmax [S]/(Km + [S]) 1/Vo = (Km + [S])/Vmax[S] 1/Vo = Km/Vmax 1/Vmax + 1/Vmax Page 134 Fig. 6.5 E. Characteristics of enzyme reactions Enzyme concentration, pH, Temperature
![B. Km: If V = 1/2 Vmax, Km =[S] C. Turnover number = Vmax/[E]total D.](http://images.slideplayer.com/16/5099757/slides/slide_33.jpg "Lineweaver-Burk Equation From Vo= Vmax [S]/(Km + [S]) 1/Vo = (Km + [S])/Vmax[S] 1/Vo = Km/Vmax 1/Vmax + 1/Vmax Page 134 Fig. 6.5 E. Characteristics of enzyme reactions Enzyme concentration, pH, Temperature.")
34
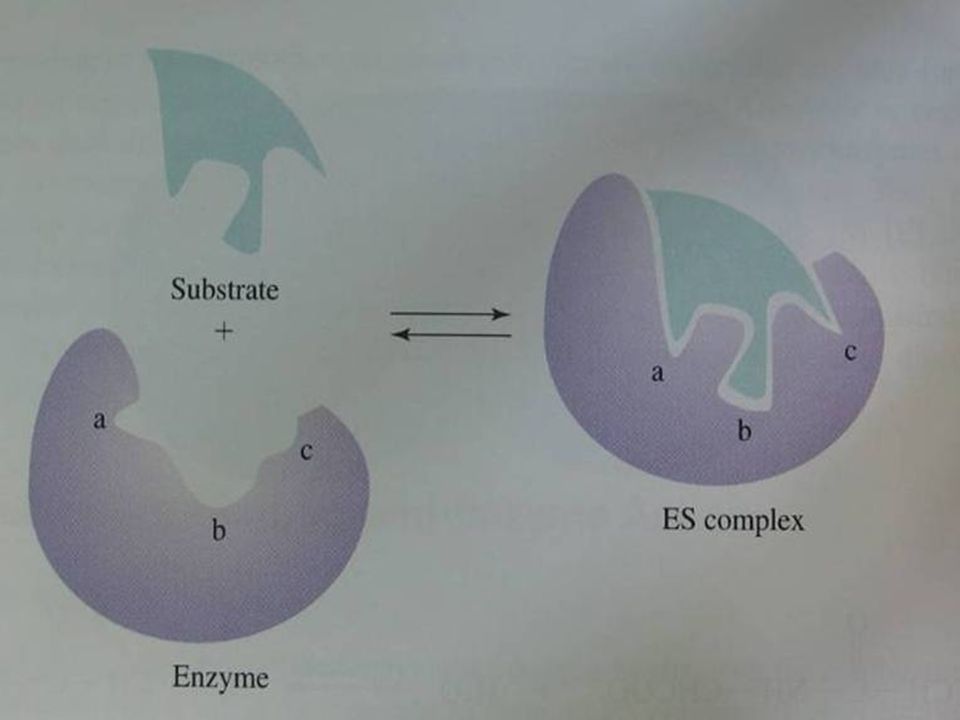
6.3 Substrate binding and enzyme action A. Active site Lock and Key model; Page 137 Fig 6.10 Induced fit model: page 138Fig. 6.11 Transition state analog model: Page 138 Fig. 6.12

37
B. General Acid-Base catalysis: An Enzyme donates a proton and accept it in the final step Proton transfer to the carbonyl group Water attack to from a tetrahedral intermediate Acceptance of the proton from the intermediate C. Metal ion catalysis: Alkali metal ( Na+, K+) and transition metals ( Mg+2, Mn+2, Cu+2 Zn+2 Fe+2 Fe+3 Ni+2) Hold a substrate properly oriented by coordinate covalent bonds, Page 140 Fig. 6.14 a Polarize the scissile bond or stabilize a negatively charge intermediate. Fig. 6.14 a Participate in biological oxidation-reduction reactions by reversible electron transfer between metal ions and substrate. Fig. 6.14 a
 and transition metals ( Mg+2, Mn+2, Cu+2 Zn+2 Fe+2 Fe+3 Ni+2) Hold a substrate properly oriented by coordinate covalent bonds, Page 140 Fig a Polarize the scissile bond or stabilize a negatively charge intermediate. Fig a Participate in biological oxidation-reduction reactions by reversible electron transfer between metal ions and substrate. Fig a.")
38
D. Covalent catalysis A nucleophilic functional group on an enzyme reacts to form a covalent bond with the substrate. Page 140, Step 1 and 2

39
6.4 Enzyme inhibition A. Reversible and irreversible inhibitors DIFP, Pesticides B. Reversible inhibitors: Page 145 Fig 6.19

40
Competitive inhibitors: Resemble the structure of normal substrate and binds to the active site of the enzyme E + S ES E + P + I EI Noncompetitive inhibitors: Both inhibitor and substrate can bind simultaneously to the enzyme molecule. E + S ES E + P + + I I EI + S ESI Uncompetitive inhibitors: The inhibitor binds only to the ES complex E + S ES E + P + I ESI

41
C. Protease inhibitor: page 146 Window Alzheimer’s disease (AD) -secretase Amyloid precursor protein ( APP) A -40 + A -42 AIDS HIV protease- Viral growth and development: Phe-Pro, Tyr-Pro
 -secretase Amyloid precursor protein ( APP) A A -42 AIDS HIV protease- Viral growth and development: Phe-Pro, Tyr-Pro.")
42
Chapter 7: Enzymes II: Coenzymes, Regulation, Abzymes, and Ribozymes 7.1. Enzyme: Coenzyme partners : Vitamins and Coenzymes: Page 157 Table 7.1 Metals as nutrients: Page 161 Table 7.2 7.2. Allosteric enzymes A. Regulatory enzyme E1 E2 E3 E4 E5 A B C D E P Final product inhibition The beginning substrate in the sequence An intermediate formed in the pathway Some external factor such as a hormone All of the above B. Positive and negative Effectors Effectors: Bomolecules influencing the action of an allosteric enzyme. Allosteric enzymes much larger and more complex than nonallosteric enzymes regulatory sties for binding specific efectors Page 165 Fig. 7.2

46
C. Models to describe allosteric regulation MWC concerted model: TT RR Reaction products Page 165 Fig. 7.5 Sequential model: TT TR RR Reaction products

47
7.3. Cellular regulation of enzymes A. Covalent modification of regulatory enzymes Phosphorylation of OH group in serine, threonine or tyrosine: Example: Page 168 Fig. 7.7 Attacheeent of an adenosyl monophosphate to a similar OH group Reduction of cystein disulfide bonds

48
B. Activation by proteolytic cleavage Zymogen active enzyme + peptide: Page 169 Table 7.3 and Fig 7.8 C. Regulation by isoenzymes Enzymes existing in different molecular forms( Multiple forms) Lactate Dehydrogenase (LDH): M4 in muscle H4 in heart
 Lactate Dehydrogenase (LDH): M4 in muscle H4 in heart.")
50
7.4 Site directed mutagenesis and Abzymes and Ribozymes A. amino acid sequence of known enzymes B. Abzymes or Catalytic antibody: Protein antibodies by using transition state analogs as antigens C. Ribozyme: Catalytic RNA : The catalytically active region – 19 -30 nucleotides

51
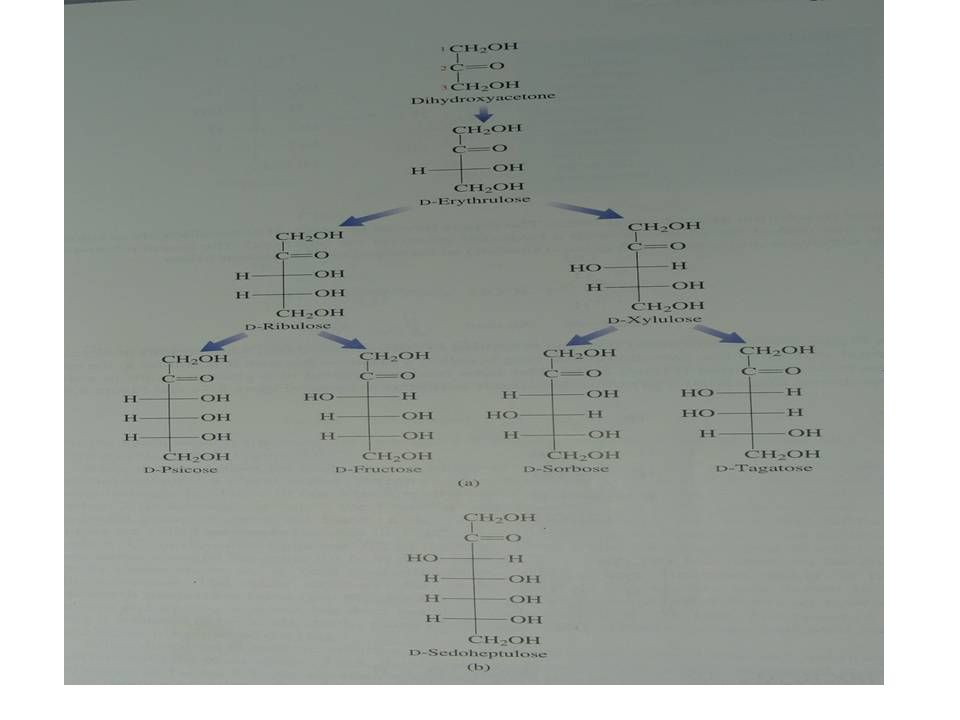
Chapter 8 Carbohydrates: Structure and Biological function 8.1. Monosaccharides A. Carbo + Hydrate B. Aldose and Ketose C. Triose, Tetrose, Pentose, Hexose D. Diastereoisomers: D-Threose and D-Erythrose E. Epimers: Mannose and Galactose are epimers of glucose F. Structure: Page 182 Fig. 8.5 and 8.6

54
8.2. Carbohydrates in cyclic structures A. Difficult to be oxidized to the acid, compared with other aldehydes. B. Hemi acetal and Hemi ketal C. Anomers ( , form) : ( = 113.4o = 19o) D. Mutarotation:52.2o 8.3. Reactions of monosaccharides A. Reducing sugars: Reduction of Cu+2 to Cu +1 B. Lactone formation: intermolecular ester C. Deoxy sugars: Another form of reduced sugars D. Esterification with phosphoric group ( ATP) F. Amino derivatives: Glucosamine, Galactosmine, N-acetylglucosamine E. Glycoside: ROH + Anomeric OH group of sugar a glycoside ( Page 189 Fig. 8.14)
 : ( = 113.4o = 19o) D. Mutarotation:52.2o 8.3. Reactions of monosaccharides A. Reducing sugars: Reduction of Cu+2 to Cu +1 B. Lactone formation: intermolecular ester C. Deoxy sugars: Another form of reduced sugars D. Esterification with phosphoric group ( ATP) F. Amino derivatives: Glucosamine, Galactosmine, N-acetylglucosamine E. Glycoside: ROH + Anomeric OH group of sugar a glycoside ( Page 189 Fig. 8.14).")
55
8.4. Disaccharides : Page 191 Fig. 8.16 A. Maltose B. Cellobiose C. Lactose D. Sucrose

56
8.5. Polysaccharides A. Starch: : Glucose ( 1 4) linkage : Page 194 Fig 8.19 Amylose and Amylopectin( branches with (1 6) linkage)
 linkage : Page 194 Fig 8.19 Amylose and Amylopectin( branches with (1 6) linkage).")
57
B. Glycogen C. Cellulose: Glucose ( 1 4) linkage: D. Chitin: N-acetylglucosamine ( 1 4) linkage: Page 197 Fig. 8.24 E. Peptidoglycans: The rigid cell walls of bacteria: N-acetylglucosamine ( 1 4) + Glucuronic acid ( 1 3)
 linkage: Page 197 Fig E. Peptidoglycans: The rigid cell walls of bacteria: N-acetylglucosamine ( 1 4) + Glucuronic acid ( 1 3).")
58
8.6. Glycoproteins A. Functions: Immunological protection, Cell-cell recognition, Blood clotting and Host- pathogen interaction B. Structure: Page 200 Fig. 8.29 O-glycosidic bonds: OH groups of serine threonine residues in the protein N-glycosides bonds: the side chain amide nitrogen of the amino acid residue asparagines. C. Lectins: Proteins specifically recognizing sugar moiety of a protein. Concanvalin A: Mannose Wheat germ agglutinin: N-acetylglucosamine Peanut lectin: N-acetylgalactosamine

59
Chapter 9. Lipids, Biological membranes and cellular transport 9.1. Fatty acids A. Nomenclature: Page 209, Table 9.1

60
B. General characteristics: Page 209 Table 9.2 C. Soap: Na or K salt of fatty acids, D. Essential fatty acids: Linoleic and Linolenic acids E. -3 tatty acids: Eicosa pentaenoic acid EPA (20:5 Delta 5, 8, 11, 14, 17) Docosahexaenoic acid( DHA)( 22:6 Delta 4, 7, 10, 13, 16, 19)
 Docosahexaenoic acid( DHA)( 22:6 Delta 4, 7, 10, 13, 16, 19).")
61
9.2. Triacylglycerols and Wax A. Structures: Page 211 Fig. 9.2 B. Saponification: hydrolysis by NaOH: Glycerol + Soap C. Hydrolysis by Lipases: Glycerol + Fatty acids D. Wax: Fatty acid ester of an alcohol having a higher carbon number

62
9.3. Polar lipids A. Phosphatidic acid : Page 217 Fig. 9.7

63
B. Glycerophospholipids: Page 216 Fig. 9.6

64
C. Spingolipids: D. Spinosine structure Page 218 Fig. 9.8 E. Lipid bilayer: Instead of micelle formation, polar lipids form lipid bilayers

65
9.4 Steroids and terpenes A. Cholesterol and its derivatives: Page 219 Fig. 9.10, Page 222 Fig. 9.11

67
B. Plant sterol: Stigmasterol, Campesterol and -Sitosterol Page 221 Window

68
C. Terpenes: Page 223 Fig 9.12

69
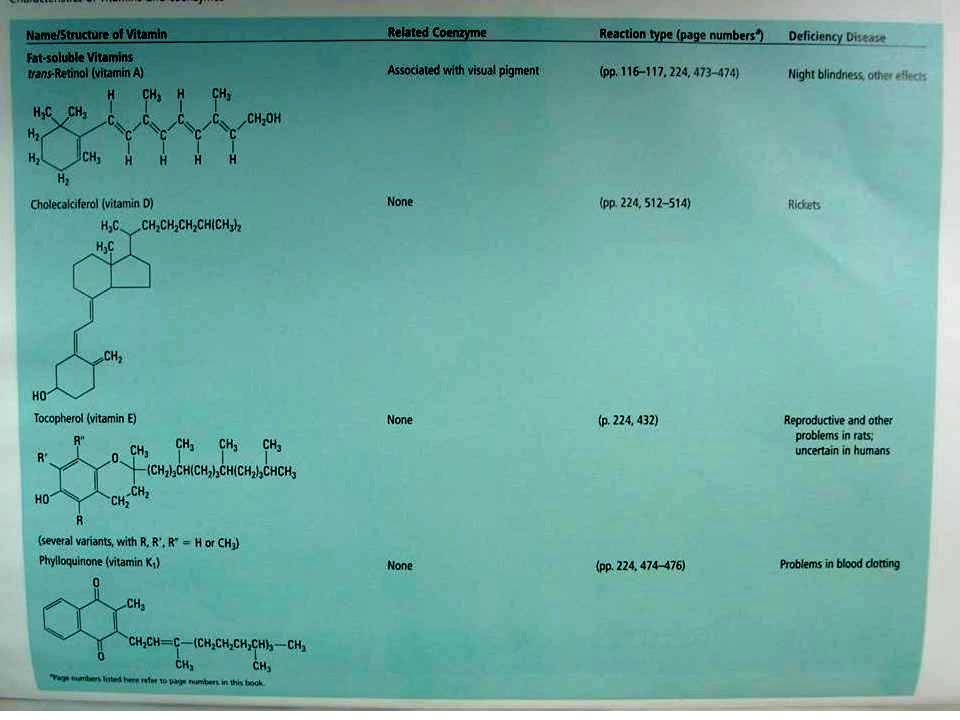
D. Eicosanoids: Arachidonate derivatives (20:4 Delta 5,8.11,14) Prostaglandins: PGD2: physiological sleep PGE2: Wakefulness Thromboxanes: Blood clotting formation Leukotrienes: Contraction of smooth muscle, especially in the lungs Lipid soluble Vitamins Page 224 Table 9.4
 Prostaglandins: PGD2: physiological sleep PGE2: Wakefulness Thromboxanes: Blood clotting formation Leukotrienes: Contraction of smooth muscle, especially in the lungs Lipid soluble Vitamins Page 224 Table 9.4.")
70
F. Electron carriers: Ubiquinone ( Coenzyme Q) Page 225 Fig. 9.14
 Page 225 Fig. 9.14")
71
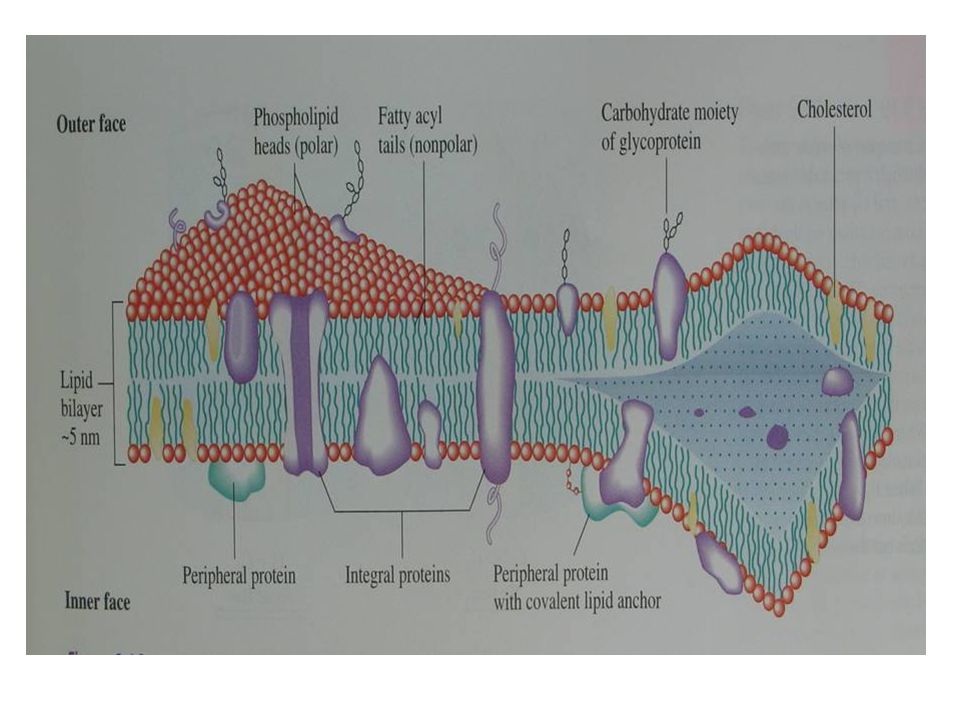
9.5 Biological Membranes A. Biological roles Physical barriers as protective shields to isolate the cell’s and organelle’s sensitive interiors fro their exterior environments Organization and compartmentation of biochemical activities within tissues and cells Selective filter to allow the entry of nutrients necessary for the cell’s growth and development and the exit of metabolic waste products Communication ith its surroundings through protein receptors Energy transduction-Mitochondria and photosynthetic organisams

72
B. Membrane components and structure Lipids, Protein and carbohydrates Carbohydrates: covalently bound to lipid and proteins Less than 5% Outside the membrane Lipids: Bilayer No simple diffusion of amino acids, ugars, proteins and nucleic acids Free diffusion of water and small nonpolar molecules such CO2 and hydrocarbons Fluidity of vegetable oil Free lateral movement but no flip-flop movement Cholesterol not found in plants. 3% in mitochondrial membrane 38% in plasma membrane Proteins: The dynamic activities of the cell membrane Peripheral proteins : Receptor sites or enzymes Integral proteins ( 1,0M NaCl solution): channel or gate : Large portion of hydrophobic amino acid residues ( Transmembrane segment) Fluid mosaic model:Page 229 Fig 9.18
: channel or gate : Large portion of hydrophobic amino acid residues ( Transmembrane segment) Fluid mosaic model:Page 229 Fig")
74
9.6 Membrane transport A. Passive transport and Active transport Passive transport: Along with the concentration gradient Simple diffusion Facilitated diffusion: permeases Page 234 Fig. 9.24 Active transport: Against the concentration gradient using ATP: Na-K pump Page 237 Fig. 9.26

75
B. Uniport and Cotransport: Page 231 Fig. 9.20 Uniport Cotransport: Symport and Antiport

76
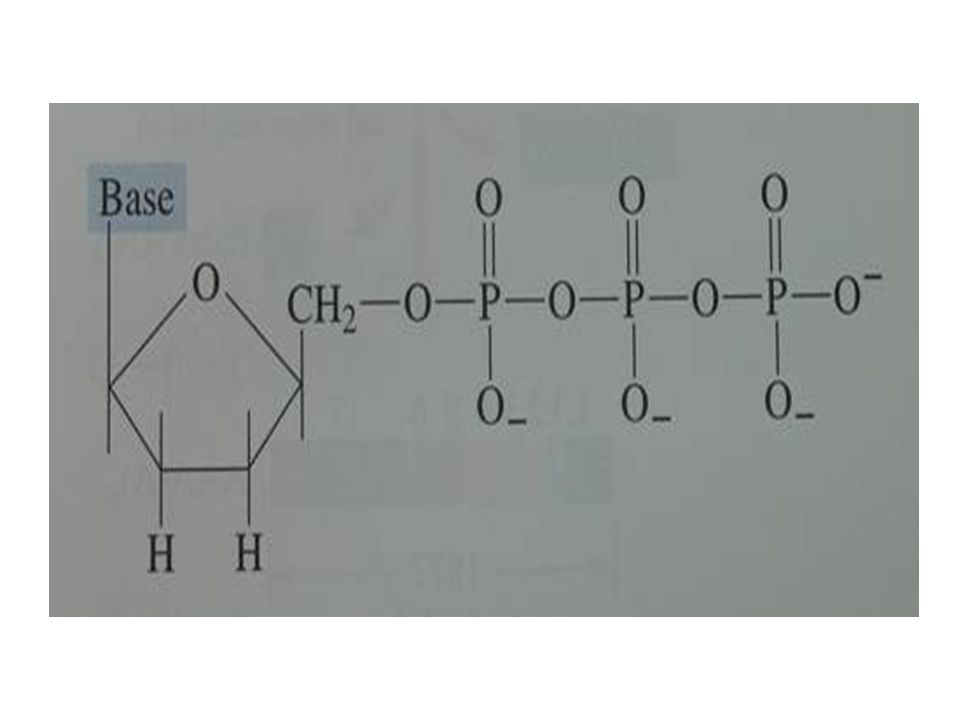
Chapter 10. DNA and RNA: Structure and Function 10.1. RNA and DNA chemical structures A. Components of nucleotides Nitrogenous bases: Purine and Pyrimidine Page 245 Fig. 10.2 A five- carbon carbohydrate Ribose or Deoxyribose One, two or three phosphate groups

77
B. Nucleoside: a nitrogenous base linked to ribose or deoxyribose through N- glycosidic bond C. Nucleotide: nucleoside- phosphate ester D. Nomenclature of nucleosides and nucleotides: Page 247 Table 10.1

78
E. Other nucleotides: Coenzyme A, FAD NAD and NADP F. Nucleic acids: 3’,5’ phosphodiester bonds : Page 249 Fig 10.

79
10.2. DNA A. Comparison of DNA from different species: Page 250 Table 10.2

80
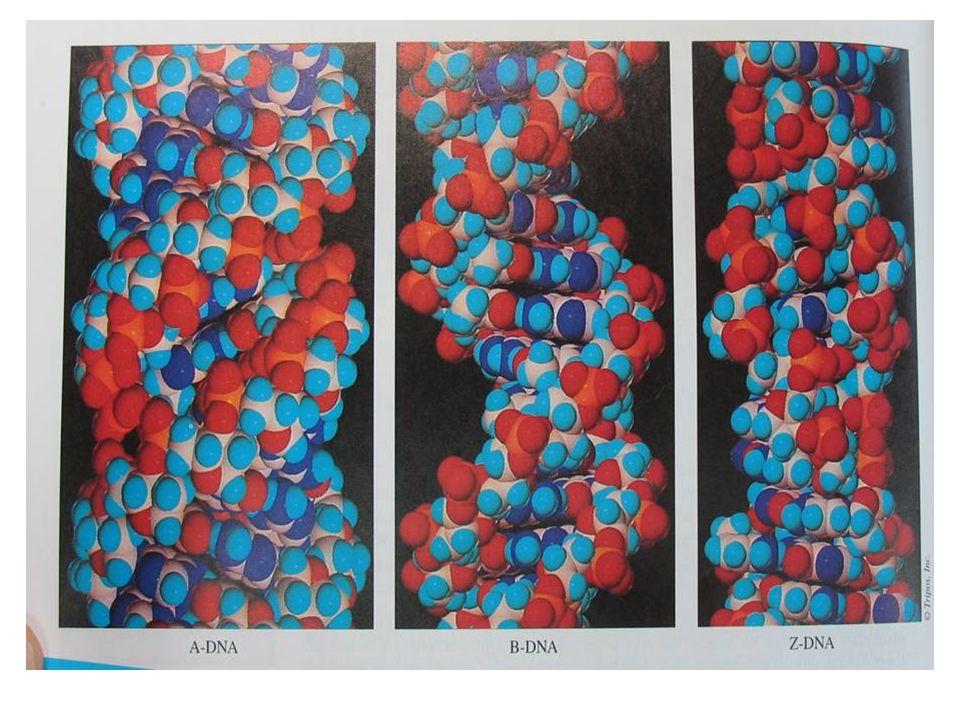
B. Features of DNA Two right handed helical polynucleotide chains to form a helix Antiparellel Outside of the helix: the alternating deoxyribose and phosphate groups Inside: Purine and pyrimidine bases Two weak forces Hydrogen bonds; A- T and C-G Wan der Waals and hydrophobic interaction between stacked bases C. Conformational varieties of DNA Page 254 Fig. 10.10 B-DNA; Crystallized in water and retains water molecules withing the crystal structure Most common under physiological conditions 10.5 bases per turn a diameter of 20A A-DNA: Dehydrated form of B-DNA 11 bases per turn 26A Z-DNA: Observed in short strands of synthetic DNA Left handed helix, 12 bases per turn 18A Also found in short stretches of native DNA-Gene regula

82
D. Melting of DNA De and Re naturation Hyperchromic effect E. Tertiary structure of DNA Supercoiled DNA and Relaxed DNA : Page 257 Page 10.14

83
10.3. RNA structural Elements A. Classification; Page 251 Table 10.3

84
B. General features Page 258 Fig. 10.15 Ribose rather than 2-deoxyribose Uracil instead of Thymine More susceptible to hydrolysis than DNA due to an extra OH group Hair- pin turns Right- handed double helixes in RNA Internal loops and bulges

85
C. tRNA: The smallest types of RNA Carriers of specific amino acids used for protein synthesis 74-93 nucleotides in a single chain Cloverleaf structure for tRNA Page 260 Fig. 10.17 D. rRNA Much larger than tRNA but shares many of the same elements as tRNA

86
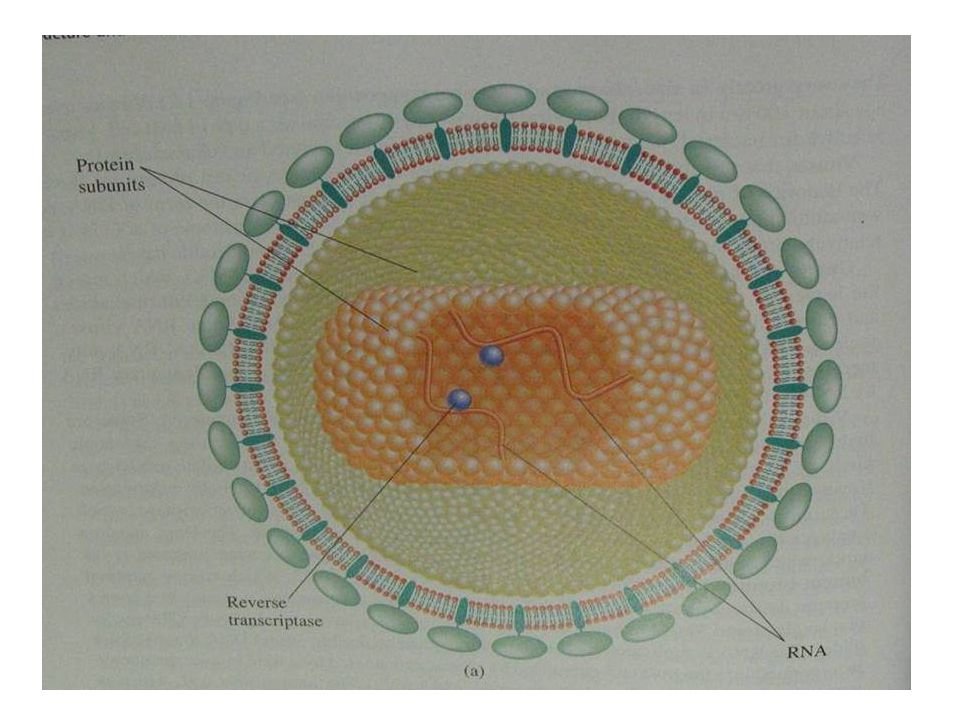
10.4. Cleavage of DNA and RNA by nucleases A. DNases, Rnases B. Exonucleases, Endonucleases C. DNA restriction enzymes Recognize specific base sequences in double-stranded DNA : Palindrome sequences Eco R1, Hpa1 Bam H1 10.5. Nuclei acid-protein complexes A. Viruses The protein molecules form a protective shell around the nucleic acid core. Usually not considered as forms of life Average about 100nm in length DNA viruses, RNA viruses Bacteriophages(Phages) : Viruses that are specific for bacteria: The majority of pahges are DNA viruses. RNA viruses: TMV, HIV Page 266 Fig.10.22
 : Viruses that are specific for bacteria: The majority of pahges are DNA viruses. RNA viruses: TMV, HIV Page 266 Fig")
88
B. Chromosomes: Page 267 Fig. 10.23 Functional units of packed genomic DNA in the nucleus of eukaryotic cells The packaging must be highly ordered and compact in order to fit the huge DNA molecules (1-2m) into the cell’s nucleus( 5 um in diameter). Nucleosomes: DNA-histone complexes: One chromosome- 1 million nucleosomes Chromatin: Beads-on-a –string form of nucleosomes Chromatin fiber: Nucleosomes winding tightly in a structure reminiscent of a filament or fiber Chromatids: Each chromosome of the duplicated pair Sister chromatids: The two chromatids of a given pair C. Small nuclear riboncleoprotein particles ( snRNPs): RNA processing D. Ribosomes: Supramolecular assemblies of RNA and protein
 into the cell’s nucleus( 5 um in diameter). Nucleosomes: DNA-histone complexes: One chromosome- 1 million nucleosomes Chromatin: Beads-on-a –string form of nucleosomes Chromatin fiber: Nucleosomes winding tightly in a structure reminiscent of a filament or fiber Chromatids: Each chromosome of the duplicated pair Sister chromatids: The two chromatids of a given pair C. Small nuclear riboncleoprotein particles ( snRNPs): RNA processing D. Ribosomes: Supramolecular assemblies of RNA and protein.")
89
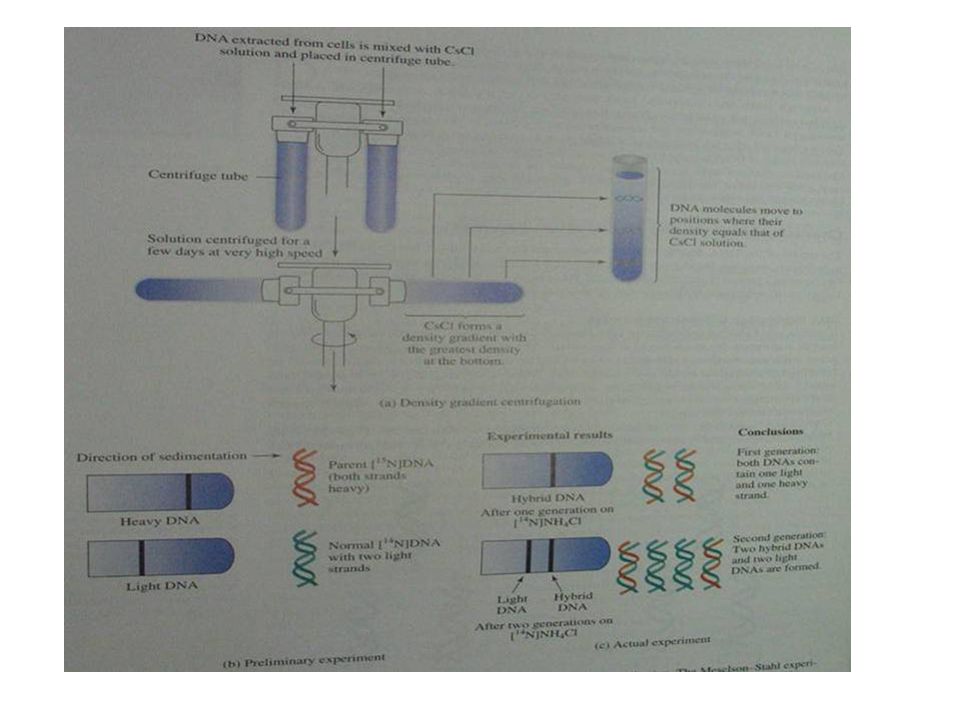
Chapter 11: DNA replication and Transcription: Biosynthesis of DNA and RNA. 11.1. Replication of DNA A. Semi-conservative replication: Page 272 Fig. 11.1 and Page 273 Fig. 11.2

91
B. 2 Replication Forks: C. The Origin: a discrete starting point in both directions D. Theta model: Page 276 Fig. 11.4

92
E. In eukaryotes: several initiation sites 11.2. Action of DNA polymerases A. DNA polymerase 1 Isolated from E coli Template and Primer, Mg+2 5’ 3’ direction B. DNA polymerases II and III: Page 278 Table 11.1

93
C. Okazki fragments: Page 279 Fig. 11.8 Continuous leading strand Lagging Strand ( Okazki fragments)
.")
94
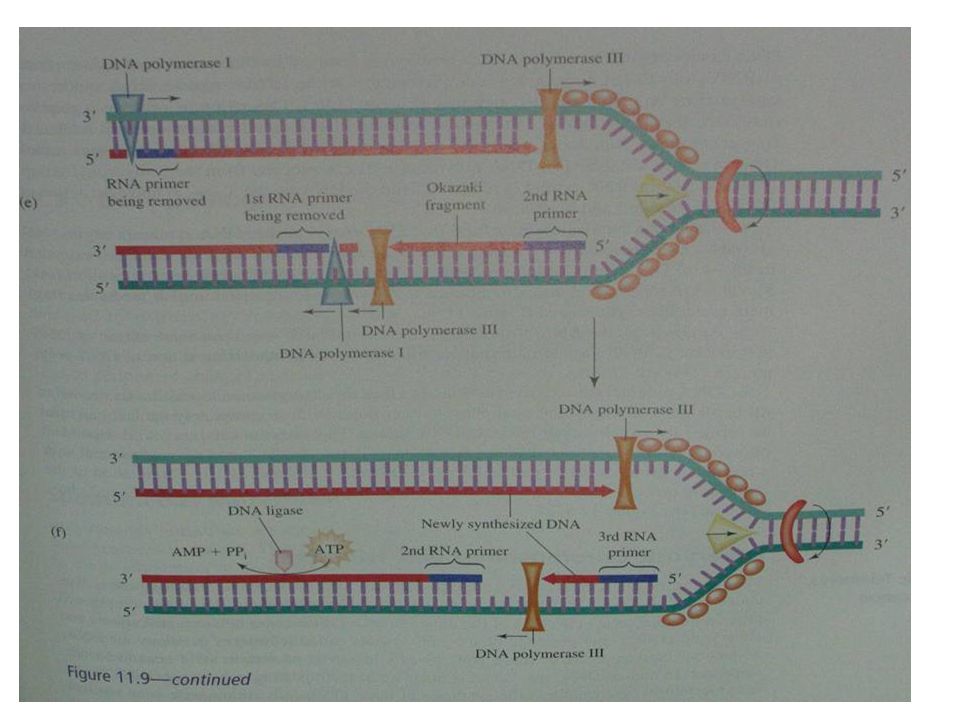
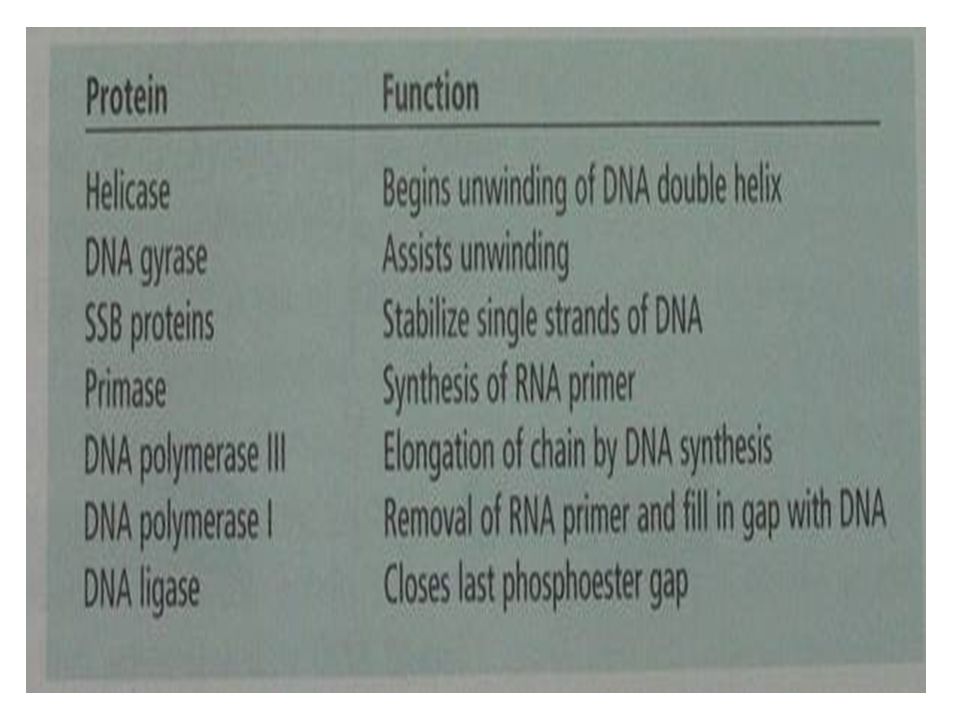
D. Details of DNA replication: Page 281 Fig. 11.9 and Page 282 Table 11.2

97
E. Eukaryotic chromosomes and Telomeres Telomeres: The presence of specialized ends in eukaryotic DNA: Hudndreads of repeats of a hexanucleotide sequence ( Human AGGGTT) Shorten during the normal cell cycle If telomeres become too short, chromosomes become unstable and cell division is inhibited Telomerase: The synthesis of telomeres. Ribozyme containing an RNA molecule that serves as a template to guide the addition of the right nucleotides. Becomes activated in human cancer cells
 Shorten during the normal cell cycle If telomeres become too short, chromosomes become unstable and cell division is inhibited Telomerase: The synthesis of telomeres. Ribozyme containing an RNA molecule that serves as a template to guide the addition of the right nucleotides. Becomes activated in human cancer cells.")
98
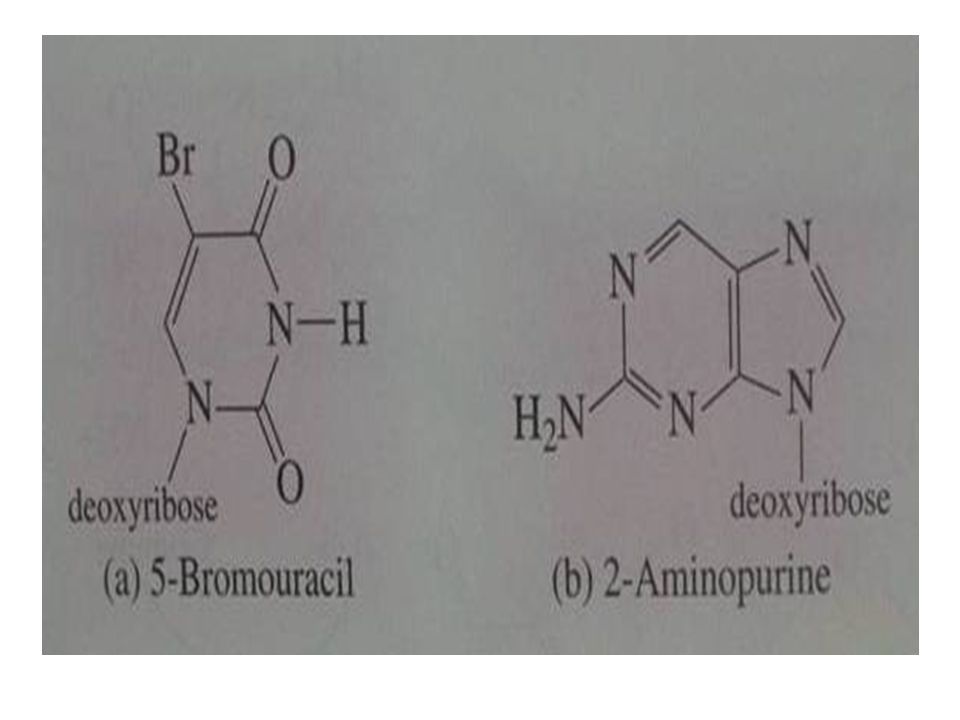
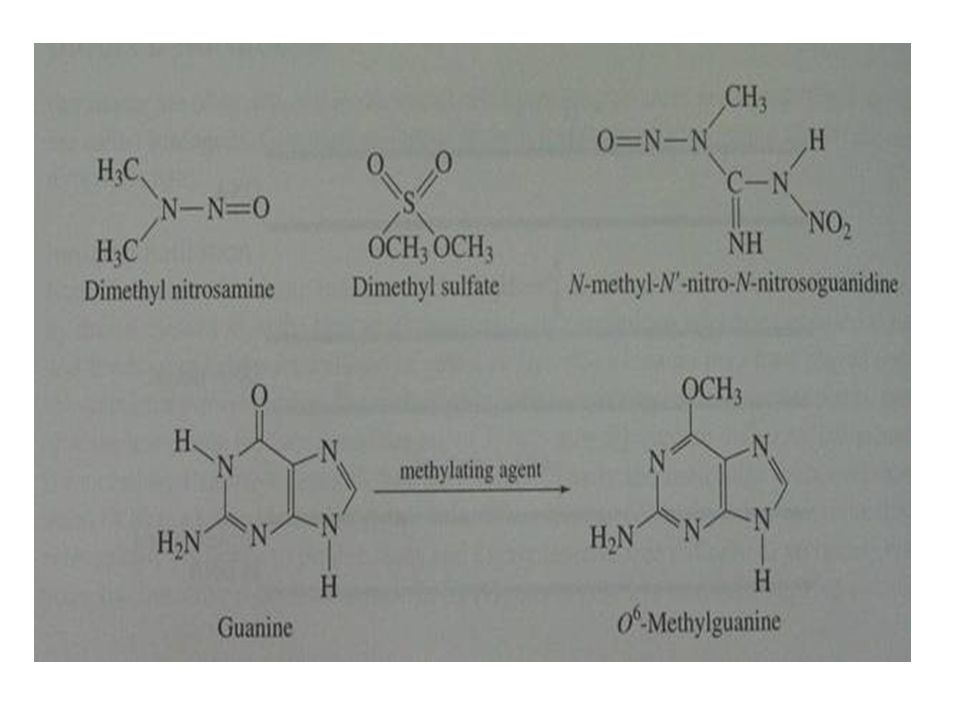
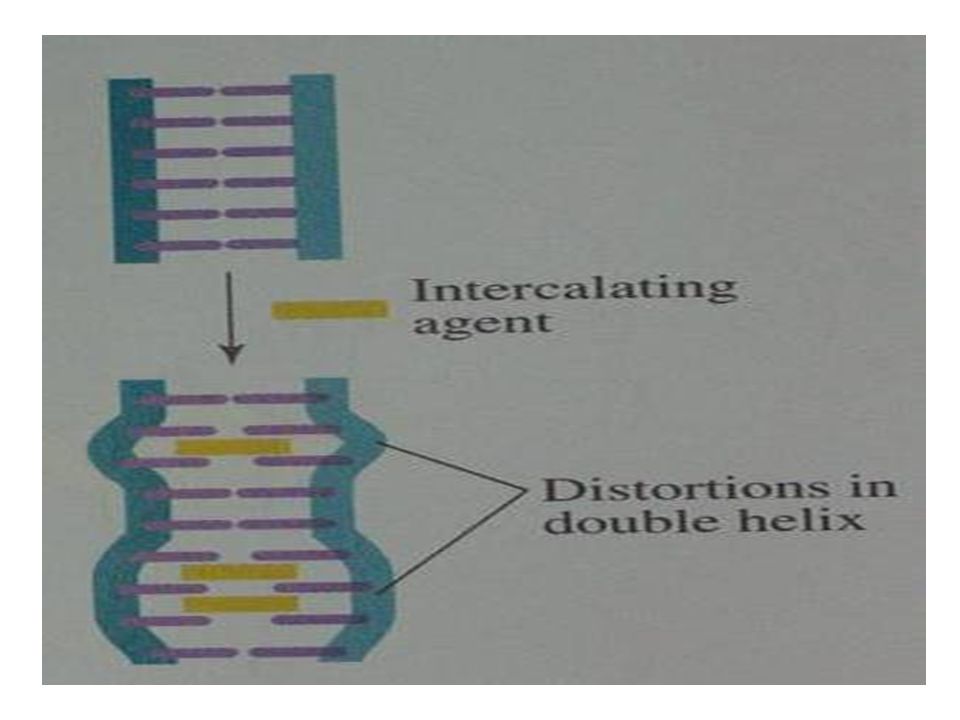
11.3. DNA damage and repair Mutation: Changes in the base sequence of DNA A. Spontaneous Mutations: Mismatching of base pairs: 1/1010 The actual error rate of base incorporation during replication: 1/104-105 ( Repair systems correct most mismatched base) Base modifications caused by hydrolytic reactions Nucleotieds containing purine bases can undergo spontaneous hydrolysis at the N- glycosidc bond to remove the purine ring. Deamination reaction: The conversion of cytosine to uracil B. Induced mutations Ionizing radiation Chemicals: Heterocyclic base analogs : Page 286 Fig. 11.14 Alkylating agents: Page 286 Fig. 11.15 Intercalating agents: Flat, hydrophobic molecules that insert between stacked base pairs in DNA: Page 287 Fig. 11.17
 Base modifications caused by hydrolytic reactions Nucleotieds containing purine bases can undergo spontaneous hydrolysis at the N- glycosidc bond to remove the purine ring. Deamination reaction: The conversion of cytosine to uracil B. Induced mutations Ionizing radiation Chemicals: Heterocyclic base analogs : Page 286 Fig Alkylating agents: Page 286 Fig Intercalating agents: Flat, hydrophobic molecules that insert between stacked base pairs in DNA: Page 287 Fig")
102
11.4. Synthesis of RNA: The molecular vehicle carrying the genetic information from DNA to protein synthesis. A. Template strand: Sense strand: The strand of duplex DNA used as a template for RNA synthesis B. DNA-directed RNA synthesis DNA-directed RNA polymerase: RNA polymerase In Eukaryotic cells: RNA polymerase 1. II and III large ribosomal RNA genes, II. Protein-encoding genes, III. Small RNAs including tRNA and 5S rRNA Three steps: Page 291 Fig. 11.19 Initiation: subunit binds to RNA polymerase subunit recognizes promotor RNA polymerase binds to DNA subunit dissociates from RNA polymerase RNA polymerase begins to movealong the template strand Elongation: Ribonucleoside triphosphates Termination: factor interacts with RNA polymerase. Transcriptiion is terminated. protein independent-GC-rich region, followed by an AT-rich region and a poly A region RNA, DNA, RNA polymerase and factor are released. C. RNA-directed RNA synthesis: in RNA viruses( Q , MS2, TMV and R17)
.")
104
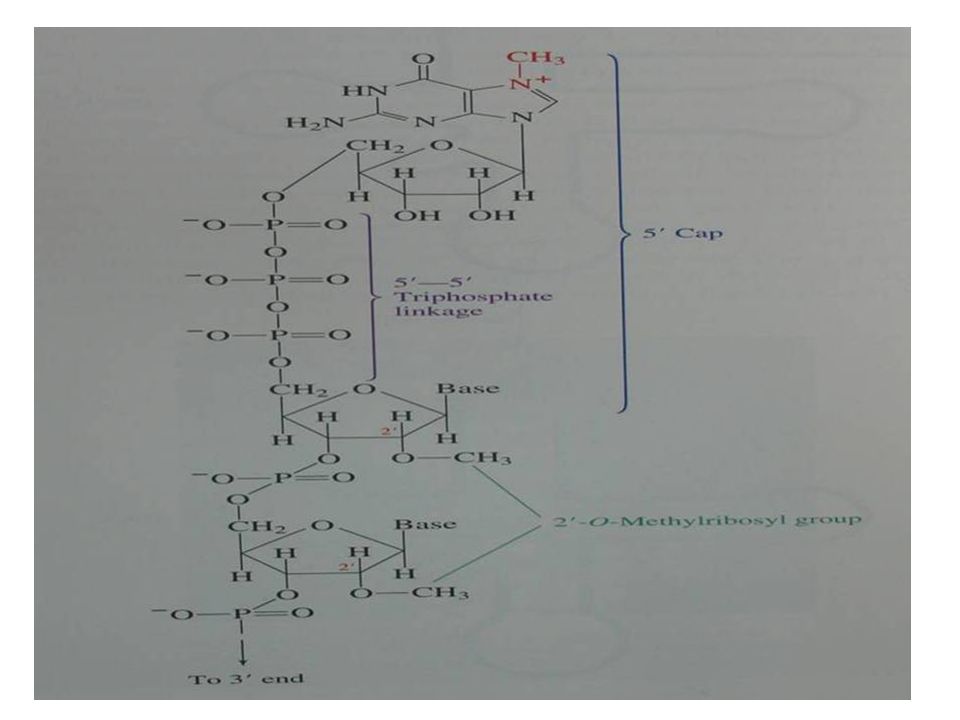
11.5. Post-transcriptional modification of RNA A. tRNA Trimming of the ends by phosphoester bond cleavage Ribonuclease P near the 5’end of pre-tRNA, An endonuclease remove a small section from the 3’end of the tRNA Splicing to remove an intron Addition of terminal sequences: CCA Heterocyclic base modification, usually methylation B. mRNA Capping: Page 295 Fig. 11.24 Almost immediately after synthesis, the 5’ end of the mRNA is modified by hydrolytic removal of a phosphate from the triphosphate functional group. GMP addition via GTP to the 5’end resulting in an unusual 5’-5’triphosphae covalent linkage. Methylation Poly A addition Addition of a poly A tail to the 3’end of mRNA after removal of a few 3’ base residues Splicing of coding sequences Exons: Coding regions on the gene Introns: noncoding regions SnRNP and catalytic RNA participate in the splicing

106
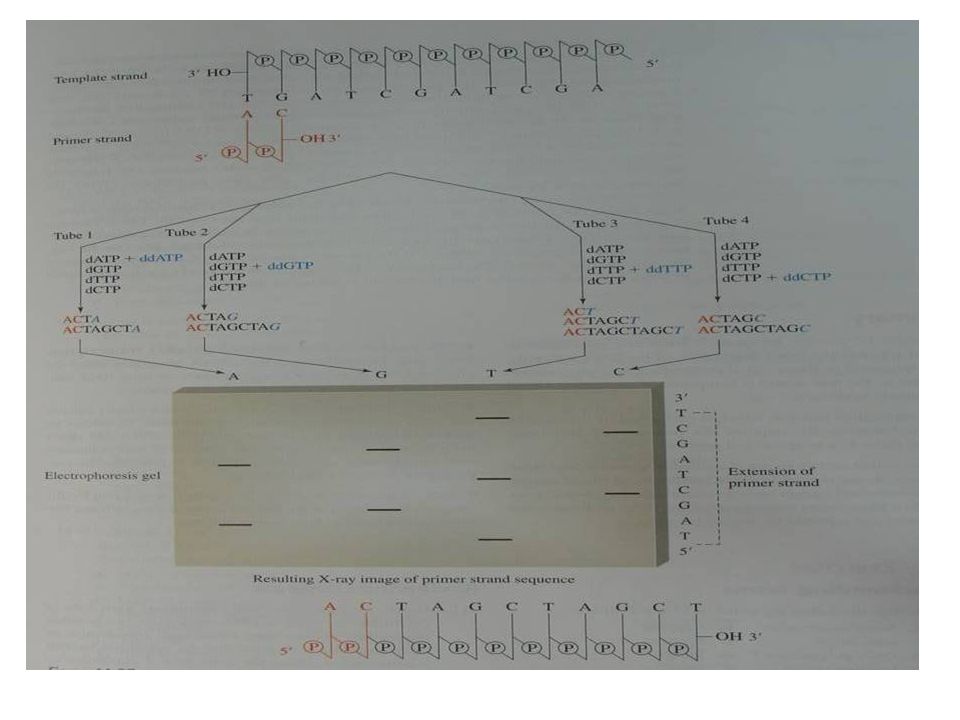
11.6. Base sequences in DNA A. Maxam-Gilbert chemical cleavage method B. Sanger chain-termination sequencing method- Dideoxy method Page 299 Fig. 11.27 Strands to be sequenced + short primer strand DNA polymerase dATP + dd ATP, dGTP + ddGTP, dCTP + ddCTP, dTTP + ddTTP Page 298 Fig. 11.26 Electorphoresis separating the reaction mixture according to the base size

109
Chapter 12. Translation of RNA : The genetic code and protein metabolism 12.1. Process of protein synthesis A. Characteristics of protein synthesis Location: Ribosomal particles Ribosomes :25nm, 2500 kDaltons, around 15,000 ribosomes in E coli cell 70S ( 30S + 50S) { Eukaryotes: 80S ( 60S + 40S)] 66% RNA and 34% protein Page 307 Fig. 12.1 Move along mRNA templates deciphering the code for conversion from nucleotide to amino acid sequence Bring to the template the tRNA charged with the properamino acid Catalyze the formation of peptide bonds between amino acids using ATP or GTP. Protein synthesis begins at the N-terminus. Aminoacyl-tRNA synthetases: an amino acid is covalently linked by an eser bond to the 2’ or 3’OH end of a specific tRNA. 20 aminoacyl-tRNA synthetases, one for each amino acid. Genetic codes: Page 311 Table 12.2 Triplets Degenerative Universal
 { Eukaryotes: 80S ( 60S + 40S)] 66% RNA and 34% protein Page 307 Fig Move along mRNA templates deciphering the code for conversion from nucleotide to amino acid sequence Bring to the template the tRNA charged with the properamino acid Catalyze the formation of peptide bonds between amino acids using ATP or GTP. Protein synthesis begins at the N-terminus. Aminoacyl-tRNA synthetases: an amino acid is covalently linked by an eser bond to the 2’ or 3’OH end of a specific tRNA. 20 aminoacyl-tRNA synthetases, one for each amino acid. Genetic codes: Page 311 Table 12.2 Triplets Degenerative Universal.")
112
12.2. Three stages of protein synthesis A. Initiation: Ribosomal recognition of the starting point on the mRNA and entry of tRNA-activated N- formylmethionine(fMet) mRNA + IF + 30S subunit GTP-IF + fMet on AUG of mRNA: 30S initiation complex 50S subunit attachment with hydrolysis of GTP and IF detachment.: 70S initiation complex B. Elongation 70S initiation complex, the next amminoacyl tRNA in the A ribosomal bind site and EF Formation of the first peptide bond: Peptidyl transferase a ribozyme associated with the 50S ribosome Translocation using GTP hydrolysis and removal of deacylated tRNA from the codon region The 3rd charged tRNA + GTP hydrolysis on the new formed A site C. Termination RF on stop codon and activation of peptidyl tranferase Hydrolysis of the ester bond liknking the carboxyl group the newly synthesized protein to the tRNA in the P site 70S ribosome dissociated into its subunits D. Polysomes: Clusters of ribosomes on a mRNA molecule Making many identical proteins molecules from a single copy of mRNA E. Protein synthesis and Energy Two anhydride bonds in ATP for aminoacyl-tRNA formation One GTP for entry of each amino acid into the A site One GTP during each translocation step
 mRNA + IF + 30S subunit GTP-IF + fMet on AUG of mRNA: 30S initiation complex 50S subunit attachment with hydrolysis of GTP and IF detachment.: 70S initiation complex B. Elongation 70S initiation complex, the next amminoacyl tRNA in the A ribosomal bind site and EF Formation of the first peptide bond: Peptidyl transferase a ribozyme associated with the 50S ribosome Translocation using GTP hydrolysis and removal of deacylated tRNA from the codon region The 3rd charged tRNA + GTP hydrolysis on the new formed A site C. Termination RF on stop codon and activation of peptidyl tranferase Hydrolysis of the ester bond liknking the carboxyl group the newly synthesized protein to the tRNA in the P site 70S ribosome dissociated into its subunits D. Polysomes: Clusters of ribosomes on a mRNA molecule Making many identical proteins molecules from a single copy of mRNA E. Protein synthesis and Energy Two anhydride bonds in ATP for aminoacyl-tRNA formation One GTP for entry of each amino acid into the A site One GTP during each translocation step.")
113
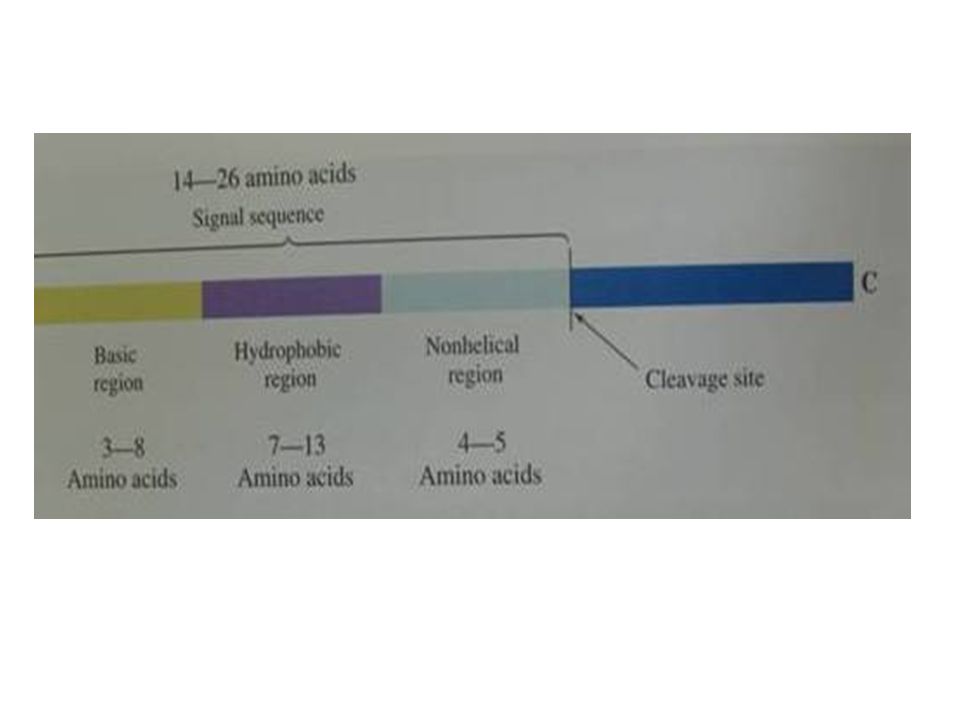
12.3. Post-translational processing of proteins A. Protein folding Chaperones: Catalysts to guide and facilitate folding Some chaperones are enzymes that couple ATP hydrolysis to the protein folding process. B. Biochemical modifications Proteolytic cleavage: N-formylmethionine removal Zymogens Amino acid modification: Phosphorylation and hydroxylation Attachment of carbohydrates: Glycoproteins -Serine or threonine -amide nitrogen of asparagines Addition of prosthetic groups: Heme, FAD, biotin and pantothenic acids C. Protein targeting: How are proteins sorted and transported to their final destination? Signal sequence: -14-26 amino acids at the amino terminus usually removed when the protein reaches its final destination Basic region + Hydrophobic region + Nonhelical region Page 324 Fig. 12.12

115
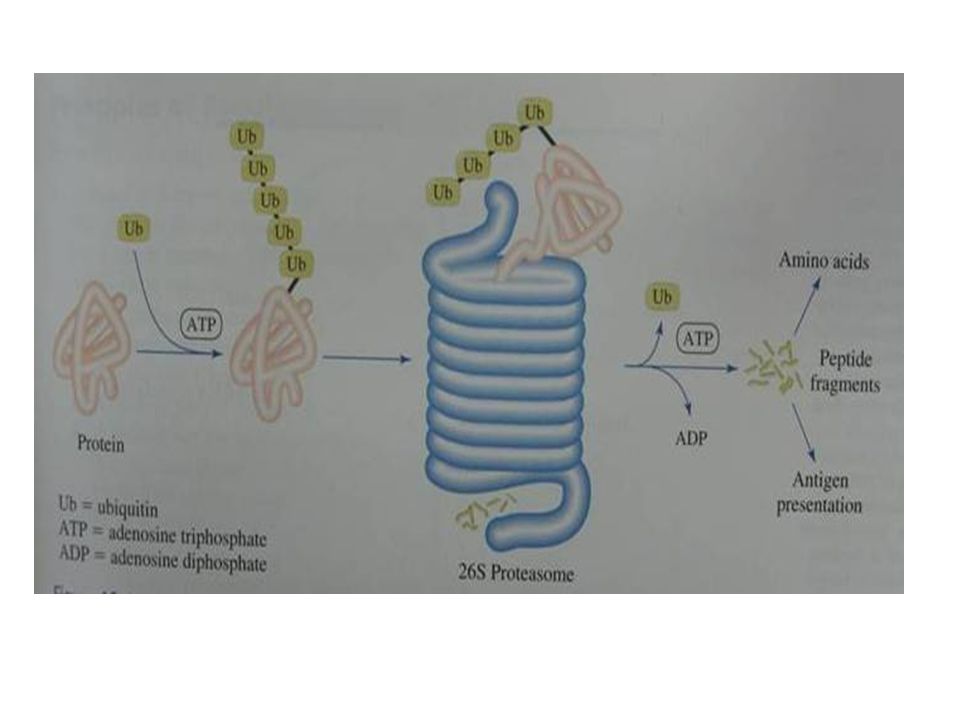
D. Proteasome and protein degradation Proteins are continuously being degraded and replaced by newly synthesized protein molecules Biological meanings: -removal of damaged or misfolded proteins. -Destruction of regulatory proteins not needed at the time -Adaptation to changing conditions Half life -RNA polymerase: 1.3 minutes -Hemoglobin: 100 days Proteasome: Page 325 Fig. 12.14 -Degradation of unwanted intracellular proteins by ATP-dependent proteases associated with large protein complexes -26S complex (20S + 19S ) -Ubiquitin pathway: 76 Amino acids, covalent attachment by an ATP-dependent process
 -Ubiquitin pathway: 76 Amino acids, covalent attachment by an ATP-dependent process.")
117
12.4. Regulation of protein synthesis and gene expression A. E. coli: 4000 genes, Humans: 30,000-40,000 genes. B. A fraction of genes is expressed at any given time. C. Regulation steps of protein synthesis: page 326 Fig.12.15 But most gene expression is controlled a the level of transcription initiation-The number of mRNA molecules

118
D. 2 types of gene expression -Constitutive expression: continuous transcription, resulting in a constant level of certain protein products- House keeping genes for general cell maintenance and central metabolism -Inducible or repressible expression: Activation and deactivation, resulting in an increase or a decrease in mRNA and protein levels. E. Principles of regulating gene expression Operon model in prokaryotes: Page 326 Fig. 12.16

119
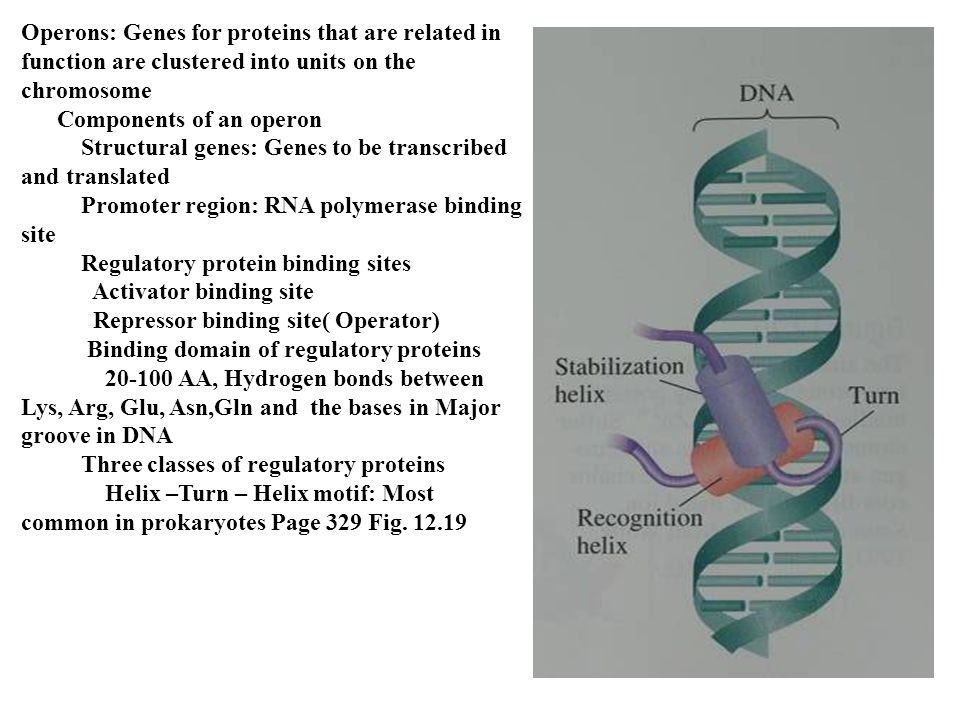
Operons: Genes for proteins that are related in function are clustered into units on the chromosome Components of an operon Structural genes: Genes to be transcribed and translated Promoter region: RNA polymerase binding site Regulatory protein binding sites Activator binding site Repressor binding site( Operator) Binding domain of regulatory proteins 20-100 AA, Hydrogen bonds between Lys, Arg, Glu, Asn,Gln and the bases in Major groove in DNA Three classes of regulatory proteins Helix –Turn – Helix motif: Most common in prokaryotes Page 329 Fig. 12.19
120
Zinc finger motif: found only in eukaryotes, Page 330 Fig.12.20

121
Leucine Zipper motif: Page 331 Fig. 12.22

122
Chapter 13: Recombinant DNA and other topics in Biotechnology Biotechnology: Application of our understanding of the intricate workings of the cell to the solution of practical problems Examples: Making of cheese, wine and other food commodities Use of bacterial cells to produce large quantities of scarce proteins needed to treat disease Using enzymes to catalyze reaction steps in the industrial production of speciality chemicals or biochemicals Plant gene modification Production of fuel alcohol from plant material Using bacteria and plants for cleanup of chemical waste site: remediation Mining of metals Gene therapy: Gene replacement in individuals with genetic disorders Forensic medicine

123
13.1. Recombinant DNA Technology A. Molecular cloning The covalent insertion of a DNA fragment fro one type of cell or organism into the replicating DNA of another type of cell If the inserted fragment is a functional gene carrying the code for a specific protein and an upstream promoter region is present in the DNA, Many copies of that gene and translated protein are produced in the host cell Page 340 Fig. 13.1

124
B. Cloning Vectors Vector: Carrier for the foreign DNA Plasmid: Self-replicating, extrachromosomal DNA molecules Circular, double stranded, 3000-30,000 base pairs Contains genetic information for the translation of proteins that confer a specialized and sometimes protective characteristic on the organism Under antibiotics, many copiesmay accumulate 30- 40% of the total cellular DNA The typical plasmid will accept foreign DNA inserts up to 15,000 base pairs. PBR 322: 4363 base pairs are sequenced. 1 EcoR1 site, different restriction sites Bacterophage DNA Lamda phage 50,000 base pairs, double stranded Many copies of recombinant phage DNA can be replicated in the host cell Efficient package of recombinant phage DNA into virus particle Lamda phage can accepts DNA fragments up to 23,000 base pairs Yeast artificial chromosome (YAC), Bacterial Artificial chromosomes (BAC)
, Bacterial Artificial chromosomes (BAC).")
125
13.2 Preparing recombinant DNA A. Design of recombinant DNA Page 343 Fig. 13.4 Formation of poly T tail in Foreign DNA to be inserted Linearization of plasmid and Poly A tails on it Mixing the two and ligation with DNA ligases

126
B. Transformation and Selection Incorporation of recombinant DNA into the host cell: 1/10,000 molecules is successful. Selection markers: Drug resistances Page 345 Fig. 13.5 and 13.6

127
C. Isolation and cloning of a single gene Identify, locate and sequence a specific gene that occurs only once in a chromosome. -Genomic DNA is cut into many thousands of large fragments using restriction endonucleases- a random population of overlapping DNA fragments -Isolation of similar size fragments by EP or ultracentrifugation - Formation of poly T tail in Foreign DNA to be inserted Linearization of plasmid and Poly A tails on it Mixing the two and ligation with DNA ligases D. Transformation and Selection Incorporation of recombinant DNA into the host cell: 1/10,000 molecules is successful. Selection markers: Drug resistances Page 345 Fig. 13.8

129
E. Biochips: Page 348 Window Microarray analysis An orderly arrangement of experimental samples Data interpretation Nucleic acids: Ordered sets of DNA( 1,000 samples) with fluorescent tag fixed at discrete locations on the solid surface of a glass (silicon) chip by robotical deposition Formation of a hybrid generates a fluorescent spot at a definite site on the chip Identification of paired sequences in cDNA and mRNA Proteins: Protein microarray Specific protein protein interactions ( Antibodies) Protein Drug interactions Determination of expressed level of the genes
 with fluorescent tag fixed at discrete locations on the solid surface of a glass (silicon) chip by robotical deposition Formation of a hybrid generates a fluorescent spot at a definite site on the chip Identification of paired sequences in cDNA and mRNA Proteins: Protein microarray Specific protein protein interactions ( Antibodies) Protein Drug interactions Determination of expressed level of the genes.")
131
13.3 DNA amplification by Polymerase chain reaction Requirements 2 synthetic oligonucleotide primers about 20 bases, which are complementary to the flanking sequences II and IV A heat stable DNA Polymerase: Taq (Thermus aquaticus) DNA polymerase dATP. dGTP, dCTP, dTTP DNA template Protocol Page 350 Fig. 13.10 5’---CCCGGG------------TTTAAA---3’ AAATTT: 3’---GGGCCC------------AAATTT---5’ CCCGGG 5’--CCCGGG-------------TTTAAA---3’ 3’---GGGCCC------------AAATTT-5’ 3’--GGGCCC-------------AAATTT--- 5’ 5’—CCCGGG------------TTTAAA---3’- 5’--CCCGGG-------------TTTAAA---3’ 3’---GGGCCC------------AAATTT-5’ CCCGGG 3’--GGGCCC-------------AAATTT--- 5’ 5’—CCCGGG------------TTTAAA---3’- AAATTT 3’---GGGCCC------------AAATTT-5’ CCCGGG------------TTTAAA 5’—CCCGGG------------TTTAAA---3’- GGGCCC------------AAATTT Results: 2n

133
C. Applications of PCR Forensics: DNA finger printing Restriction Fragment Length Polymorphisms ( RFLPs); Each persons’s DNA has a unique sequence pattern, the restriction enzymes cut differently and lead to different sized fragments PCR-based Analysis: Faster, simpler and no requirement fro radioactive probes
; Each persons’s DNA has a unique sequence pattern, the restriction enzymes cut differently and lead to different sized fragments PCR-based Analysis: Faster, simpler and no requirement fro radioactive probes.")
134
13.4. Applications of recombinant DNA technology A. Recombinant protein products Human insulin expressed E. coli Growth hormone Page 355 Table 13.1 Bacterial Host: Lack in posttranslational modifications Unable to carry out important exon splicing reactions Animal cell as host Endocytotic up take of clacim phosphate precipitated DNA Electroporation: a brief high voltage pulse Microinjection

135
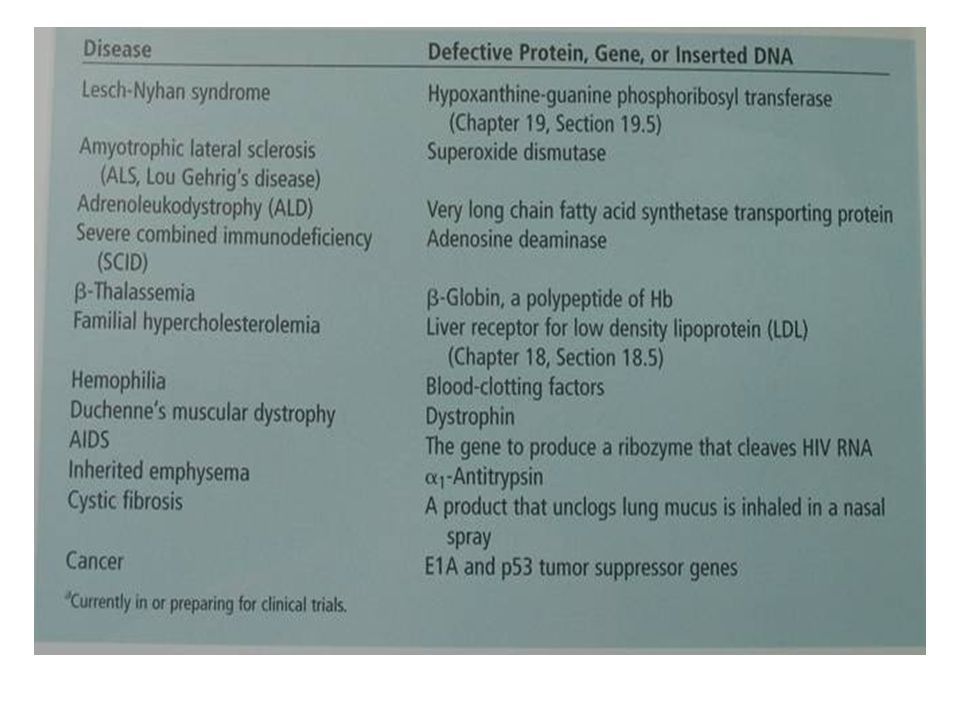
B. Genetically altered(Modified) organism (GMO) Bacteria: Pseudomonas: complex chlorinated hydrocarbons for bioremediation Thiobacillus ferrooxidans: Desulfurization of coal Plants: Using Ti plasmid of Agrobacterium Tumefaciens Tomato, Soybean, Corn Plants in high salinity, drought and extreme cold Animals: Transfer into germ cells Ethnic problems Dolly, Giant mouse C. Human gene therapy The attempt to correct a genetic defect by inserting the normal gene into the cells of an organism AIDS, Brain cancer, obesity, multiple sclerosis, Page 358, Table 13.2.
 organism (GMO) Bacteria: Pseudomonas: complex chlorinated hydrocarbons for bioremediation Thiobacillus ferrooxidans: Desulfurization of coal Plants: Using Ti plasmid of Agrobacterium Tumefaciens Tomato, Soybean, Corn Plants in high salinity, drought and extreme cold Animals: Transfer into germ cells Ethnic problems Dolly, Giant mouse C. Human gene therapy The attempt to correct a genetic defect by inserting the normal gene into the cells of an organism AIDS, Brain cancer, obesity, multiple sclerosis, Page 358, Table")
137
Chapter 14. Basic concepts of cellular metabolism and bioenergetics Metabolism: Sum total of all chemical reactions in an organism Autotrophs: Energy from sun and CO2 in most cases Heterotrophs: Obtain energy by ingesting complex carbon containg compounds

138
14.1. Intermediary metabolism A. Two paths of metabolism Catabolism: the degradative path, Releasing the potential energy from food into ATP Page 369 Table 14.1 Anabolism: Biosynthesis, Using the free energy stored in ATP Page 369 Table 14.1

139
B. Possible sequential arrangements for metabolic pathways Page 368 Fig. 14.3.

140
D. ATP cycle Page 370 Fig. 14.4

141
D. Stages of metabolism Catabolism Stage 1: Breakdown of macromolecules into their respective building blocks Stage 2: Building blocks are oxidized to a common metabolite Acetyl CoA Stage 3: Acetyl CoA enters into Citric Acid Cycle, Respiratory assembly, Oxidative phsphorylation Anabolism: Three stages like catabolism, but divergent. Requires energy in the form of ATP and NADPH The two processes are similar in terms of intermediates and enzymes but they are not identical. 14.2. The chemistry of metabolism: Page 372 Table 14.2

142
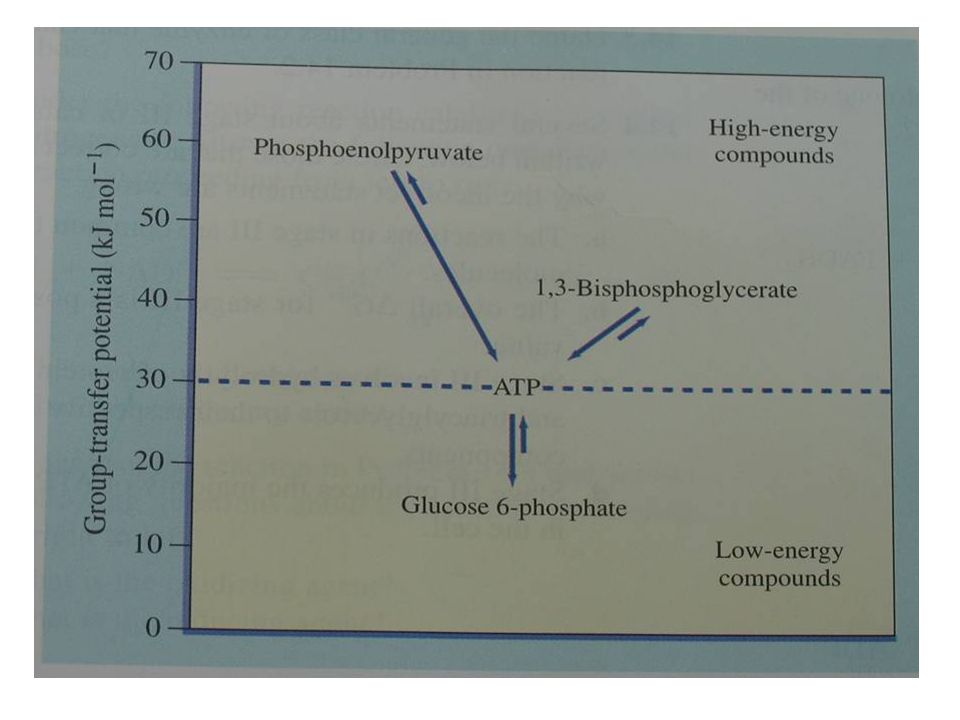
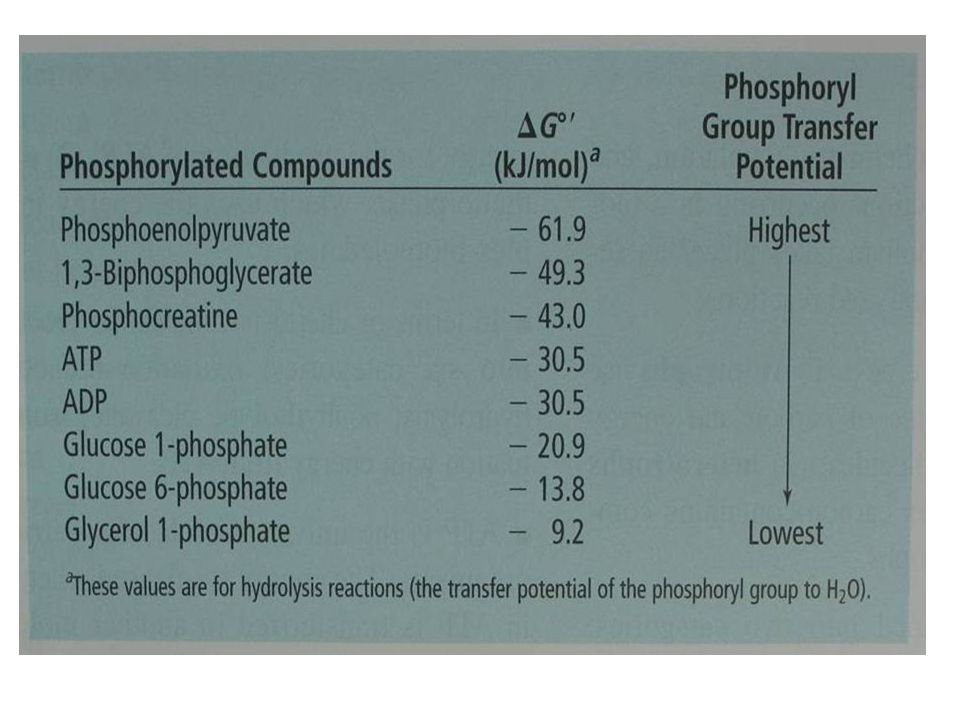
14.3. Concepts of bioenergetics A. Standard free energy change Go: The energy change under standard conditions: 1 atm of pressure, 25oC, 1.0M at the initial conc. Go’: at pH 7.0 instead of pH 0 A + B C + D At equilibrium Keq’ = [C][D]/[A][B] G = Go’ + RT ln [C][D]/[A][B] R: the gas constant: 8.13j/mole T: the absolute temperature 273 + 25= 298K At equilibrium, G = 0 Go’ = -2.303RT log Keq’ Go’ 0 : Spontaneous, release of energy Go’ 0 : not spontaneous, input of energy B. Energy rich compounds Acid anhydrides: Phosphanhydride bonds : resonance stabilization, charge repulsion Phosphoenolpyruvate Thioesters Page 387 Table 14.6 and Fig. 14.14

145
Chapter 15: Metabolism of carbohydrates Glycolysis Phsophogluconate Pathway ( Pentose phosphate pathway) Gluconeogenesis Glycogen synthesis Page 394 Fig. 15.1

146
15.1. The energy metabolism of glucose A. First five reactions of glycolysis Page 396 Fig. 15.2: Energy Input B.Sceond five reactions of glycolysis: Page 396 Fig. 15.2: Energy Out put

147
CATP and NADH balance: Page 399 Table 15.2

148
15.2. Entry of other carbohydrates into glycolysis Page 400 Fig. 15.3 Glycogen in animal cells: phosphorlytic cleavage by glycogen phosphorylase Fructose Glycerol Galactose: UDP-derivatives are involved.

149
15.3. Pyruvate metabolism A. Lactate fermentation:Page 404 Fig. 15.6 B. Ethanol fermentation: Page 405

150
15.4. Biosynthesis of carbohydrates A. Gluconeogenesis: primarily in the liver Page 407 Fig 15.7 The irreversible reactions of glycolysis that are bypassed in gluconeogenesis Page 407 Table 15.3 Pyruvate carboxylase Phosphoenolpyruvate carboxykinase Fructose 1,6 bisphosphatase Summary of gluconeogenesis: Page 410

153
B. Activation of glucose and galactose for biosynthesis Formation of NDP-glucose Page 411 Fig. 15.10

154
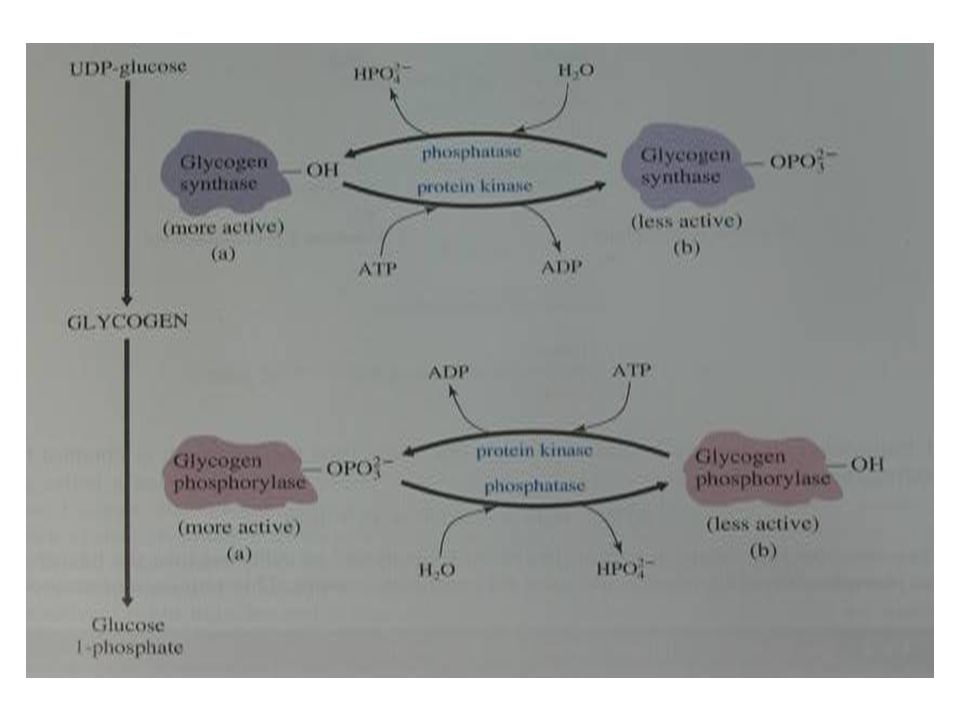
C. Synthesis of polysaccharides Glycogen: Glycogen synthase UDP-glucose and (glucose)n Starch:Starch synthase, UDP-glucose and (glucose)n Cellulose: Cellulose synthase, UDP (GDP)-glucose and (glucose)n D. Synthesis of disaccharides Lactose: Lactose synthase ( Galactosyl transferase + -lactalbumin) UDP-galactose + glucose UDP + lactose Without -lactalbumin: UDP-galactose + N-acetylglucosamine UDP + N- acetyllactosamine Sucrose: Sucrose 6-phosphate snthase UDP glucose + fructose 6-phosphate sucrose –6 phosphate + UDP 15.5. Regulation of carbohydrate metabolism A. Glycogen phosphorylase and Glycogen synthase Page 417 Fig. 15.13.
n Starch:Starch synthase, UDP-glucose and (glucose)n Cellulose: Cellulose synthase, UDP (GDP)-glucose and (glucose)n D. Synthesis of disaccharides Lactose: Lactose synthase ( Galactosyl transferase + -lactalbumin) UDP-galactose + glucose UDP + lactose Without -lactalbumin: UDP-galactose + N-acetylglucosamine UDP + N- acetyllactosamine Sucrose: Sucrose 6-phosphate snthase UDP glucose + fructose 6-phosphate sucrose –6 phosphate + UDP Regulation of carbohydrate metabolism A. Glycogen phosphorylase and Glycogen synthase Page 417 Fig")
156
B. Phosphofructokinase + effectors: AMP and Fructose-2,6-bisphosphate effectors: ATP and citrate C. Hexokinase Feed back inhibition by glucose 6 phosphate D. Pyruvate kinase and pyruvate carboxylase ATP inhibits pyruvate kinase Acetyl CoA stimulates pyruvate carboylase

157
Chapter 16. Production of NADH and NADPH: Citric acid cycle, the glyoxylate cycle and the phosphogluconate pathway

158
16.1. The pyruvate dehydrogenase complex Oxidation of Pyruvate Pyruvate dehydrogenase complex Composition: Page 427 Table 16.1 Steps in the oxidation Page 427 Fig. 16.3

160
16.2.The Citric acid cycle: A. Reactions: Page 434 Fig. 16.8 B. Summary of the citric acid cycle Acetate leave the cycle as 2CO2 3 moles of NADH and 1 mole of FADH2 1 mole of ATP or GTP from CoA thioester

161
16.3. The citric acid cycle in regulation and biosynthesis A. Regulation aerobic pyruvate metabolism: Page 439 Table 16.4 Pyruvate dehydrogen complex Citrate synthase Isocitrate dehydrogen -ketoglutarate dehydrogen comples

162
B. Anabolic roles of the citric acid cycle: Page 440 Fig. 16.11

163
C. Anaplerotic reaction to replenish the citric acid cycle intermediates: Page 440 Table 16.5 Oxaloacetate Malate

164
16.4. The Glyoxylate cycle In plant and some microorganisms Page 442 Fig. 16.12 Glyoxysomes: specialized cell organelle in plant seeds 2 acetyl CoA + NAD+ + 2 H2O Succinate + 2 CoA + NADH + H+

165
16.5 The phosphogluconate pathway Page 444 Fig. 16.14

166
Chapter 17. ATP formation by electron-transport chains 17.1. Mitochondrial electron transport A. Reactions catalyzed by NAD-and FAD-linked dehydrogenases: Page 452 Table 17.1

167
B. The electron transport chain: Page 453 Fig. 17.2 Go’ = -nF Eo’ n: number of electrons F: 96.5kj/volt.mole Page 454 Table 17.2

168
17.2. Components of the electron transport chain A. Complex 1. NADH-CoQ reductase: FMN Semiquinone FMNH2: Page 455 Fig. 17.4 Fe-S cluster: Page 456 Fig. 17.5

169
CoQ: Page 456 Fig. 17.6

170
B. Complex II: Page 457 Fig. 17.7 Succinate dehydrogenase Acyl-CoA dehydrogenase

171
C. Complex III: Q cycle: Page 458 Fig. 17.10 2 CoQH2 + 2 Cyt C (oxid) + CoQ 2 CoQ + 2 Cyt (red) + CoQH2 + 2H+ D. Complex IV: Cytochrome C oxidase O2 + 4e- + 4H+ 2H2O Two hemes ( a and a3 ) Cu++
 + CoQ 2 CoQ + 2 Cyt (red) + CoQH2 + 2H+ D. Complex IV: Cytochrome C oxidase O2 + 4e- + 4H+ 2H2O Two hemes ( a and a3 ) Cu++.")
172
17.3. Oxidative phosphorylation A. Coupling of Electron transport with ATP synthesis: Page 460 Fig. 17.12

173
B. Chemiosmotic coupling Electron transport through the carriers in the inner membrane causes the unidirectional pumping of protons from the inner mitochondrial matrix to the other side of the membrane( into the inter-membrane space) C. Components of ATP synthase: Page 462 Fig. 17.14 Fo: Proton channel F1: subunits, :ATP synthesis
 C. Components of ATP synthase: Page 462 Fig Fo: Proton channel F1: subunits, :ATP synthesis.")
174
D. Regulation of oxidative phosphorylation ATP/ADP ration Uncoupling of electron transport and ADP phosphorylation New born animals Hibernating bears Brown fat: a specialized type of adipose tissue having high concentrations of mitochondria 17.4. Recycling of cytoplasmic NADH Cytoplasmic NADH but be recycled by electron shuttle systems A. Glycerol 3-phosphate shuttle: Page 464 Fig. 17.15

175
B. Malate-aspartate shuttle: Page 465 Fig. 17.16

176
17.5. Photosynthetic Electron Transport A. Photosynthesis: Reductive carboxylation ( cf. Oxidative decarboylation = Citric acid cycle) Two phases of photosynthesis: Page 467 Fig. 17.17
 Two phases of photosynthesis: Page 467 Fig")
177
B. Chloroplasts: Page 468 Fig. 17.18

178
C. Comparison between Mitochondria and Chloroplasts MitochondriaChloroplasts Electron flow NADH(FADH2) O 2 H 2 O NADP+ Proton flow during elctron transport Innermembrane Intermembrane space Inter membrane space Inner membrane O2O2 ConsumedGenerated D. Photosynthetic light reactions 2H2O + NADP+ 2NADPH + 2H+ +O2 Photosystems I and II: Z scheme : Noncyclic electron flow Page 475 Fig. 17.25 ATP and NADPH formation Cyclic electron flow: Page 477 Fig. 17.27 ATP formation only E. Photophosphorylation Proton movement from stroma to lumen ( from outside to inside
 O 2 H 2 O NADP+ Proton flow during elctron transport Innermembrane Intermembrane space Inter membrane space Inner membrane O2O2 ConsumedGenerated D. Photosynthetic light reactions 2H2O + NADP+ 2NADPH + 2H+ +O2 Photosystems I and II: Z scheme : Noncyclic electron flow Page 475 Fig ATP and NADPH formation Cyclic electron flow: Page 477 Fig ATP formation only E. Photophosphorylation Proton movement from stroma to lumen ( from outside to inside.")
181
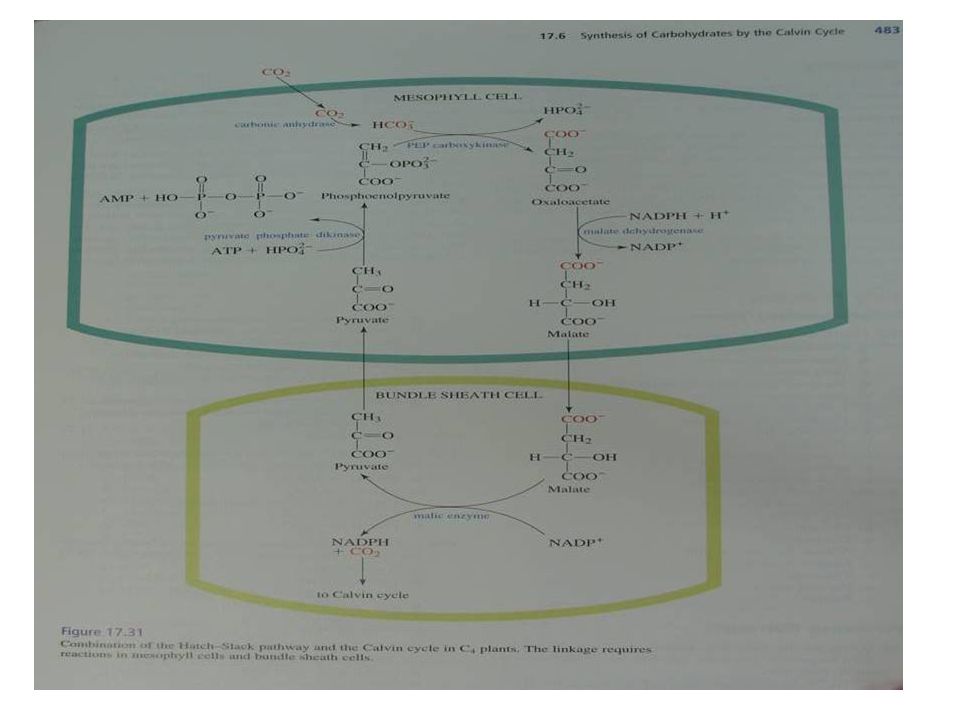
17.6 Synthesis of carbohydrates by the Calvin cycle A. Stage 1: Addition of CO2 to an acceptor molecule ( Ribulose 1,5-bis phosphate) Page 479 Fig. 17.29 B. Stage II: Entry of 3-phosphoglycerate into main stream metabolism 3-phosphoglycerate + ATP 1,3 bisphosphoglycerate 1,3 bisphosphoglycerate + NADPH + H+ glyceraldehydes-3 phosphate C. Stage III: Syntheis of carbohydrates from Glyceraldhyde 3 phosphate D. Completion of the Calvin cycle by regeneration of Ribulose 1,5-bisphosphate CO2 + C5 2C3 2C3 C6 C3 + C6 C4 + C5 C4 + C3 C7 C7 + C3 2C5 E. Hatch-Slack pathway: In C4 plants Page 483 Fig. 17.31
 Page 479 Fig B. Stage II: Entry of 3-phosphoglycerate into main stream metabolism 3-phosphoglycerate + ATP 1,3 bisphosphoglycerate 1,3 bisphosphoglycerate + NADPH + H+ glyceraldehydes-3 phosphate C. Stage III: Syntheis of carbohydrates from Glyceraldhyde 3 phosphate D. Completion of the Calvin cycle by regeneration of Ribulose 1,5-bisphosphate CO2 + C5 2C3 2C3 C6 C3 + C6 C4 + C5 C4 + C3 C7 C7 + C3 2C5 E. Hatch-Slack pathway: In C4 plants Page 483 Fig")
183
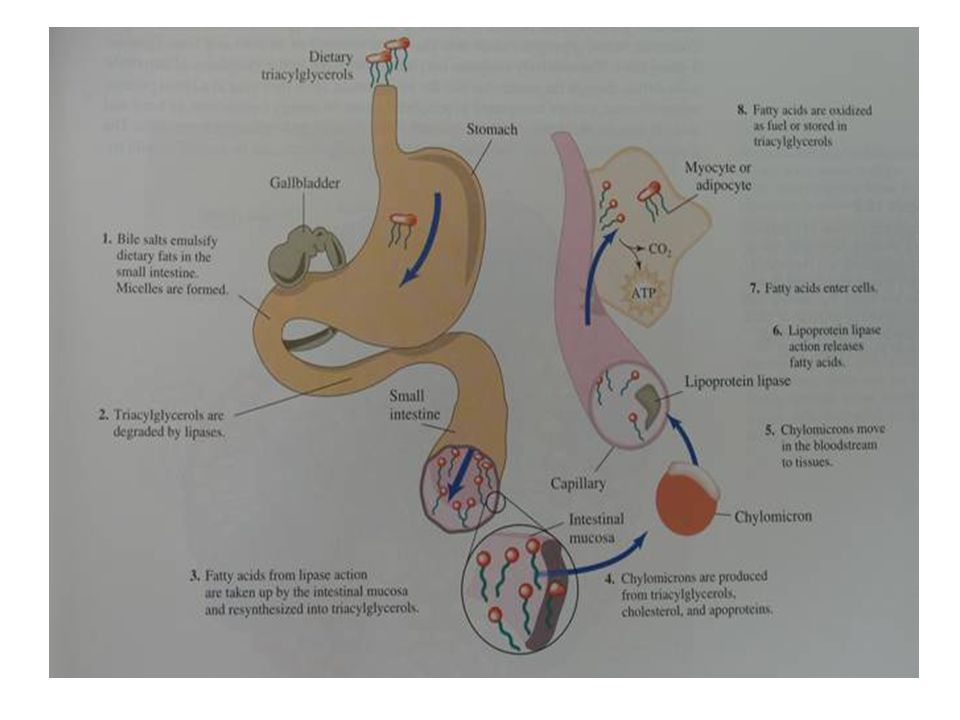
Chapter 18. Metabolism of fatty acids and lipids 18.1. Metabolism of dietary triacylglycerols A. Three primary sources of fatty acids for energy metabolism in humans and other animals Dietary triacylglycerols Triacylglycerols synthesized in the liver Triacylglycerols stored in adipocytes as lipid droplets B. Initial digestion of fats Digestion, mobilization and transport of dietary triacylglycerols: Page 489 Fig. 18.1

185
C. Schematic diagram of a chylomicron Page 490 Fig. 18.2

186
D. cAMP activation of triacylglycerol lipase Page 491 Fig. 18.3

187
E. Fatty acids in muscle cells: Activation of fatty acids in muscle cytoplasm Acyl CoA synthetase Page 493 Top Formula

188
18.2. Catabolism of fatty acids A. -Oxidation Fatty acids are degraded in a stepwise fashion by removal of a C2 unit at each step Initial oxidation process occurs on the carbon followed by cleavage of the bond between carbons and B. Steps of beta oxidation Entry into the mitochondrial matrix. Page 495 Fig. 18.6

189
Individual reactions. Page 496 Fig. 18.8 In summary, Palmitoyl ScoA + 7 FAD + 7 NAD + 7CoASH + 7 H2O 8acetyl ScoA + 7FADH2 + 7NADH + 7H+

190
C. ATP balance Page 499 Table 18.2

191
D. Beta oxidation of unsaturated fatty acids Double bonds in the intermediate enoyl CoA: Trans Double bonds in naturally occurring fatty acids: Cis Metabolism of 16:29,12: Page 500 Fig. 18.10

192
E. Beta oxidation of fatty acids with odd numbers of carbons: End product is Propionyl CoA Degradation of Propionyl CoA: Page 501 Fig. 18.12

193
18.3 Biosynthesis of fatty acids A. Comparison of both processes ( Cata- and Anabolism). Page 503 Table 18.3

194
B. Transport of citrate from mitochondria to cytoplasm : Page 503 Fig. 18.14

195
C. Fatty acid synthase: Multi enzyme complex in mammals: Page 505 Table 18.4 Malonyl CoA formation is the rate limiting step in fatty acid synthesis.

196
D. Biosynthesis of unsaturated fatty acids In endoplasmic reticulum by faty acyl-CoA desaturases E. Regulation of fatty acid metabolism -oxidation and syntheis must be coordinated so they do not occur simultaneously. The availability of carbohydrates and fatty acids. Abundant glucose High production of citrate Positive modulator for aceyl-CoA carboxylase Increase in Malonyl CoA formation Blocking the action of carnitine acyltransferase I Turn off of fatty acid degradation The increase of fatty acid in the mitorchodria enhances -oxidation under conditions of low blood glucose. 18.4 Cholesterol A. Roles Essential component of animal membrane Precursor for steroid hormones, bile salts and vitamin D B. Cholesterol biosynthesis Page 508 Fig. 18.20 Step 1. Acetyl CoA → mevalonate: HMG CoA reductase :major regulatory step in cholesterol biosynthesis

198
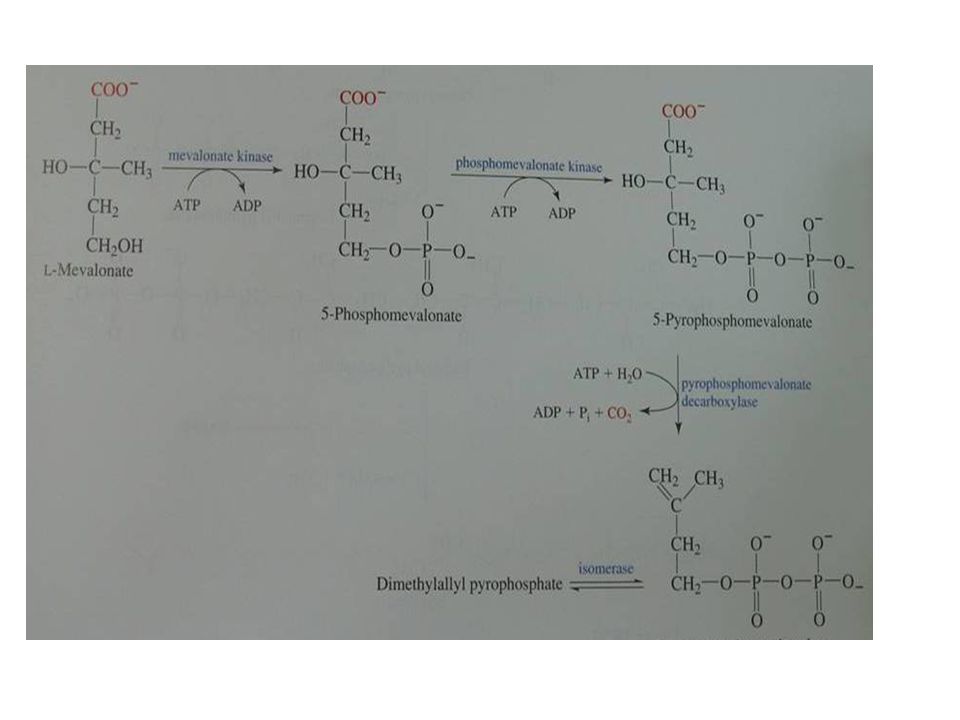
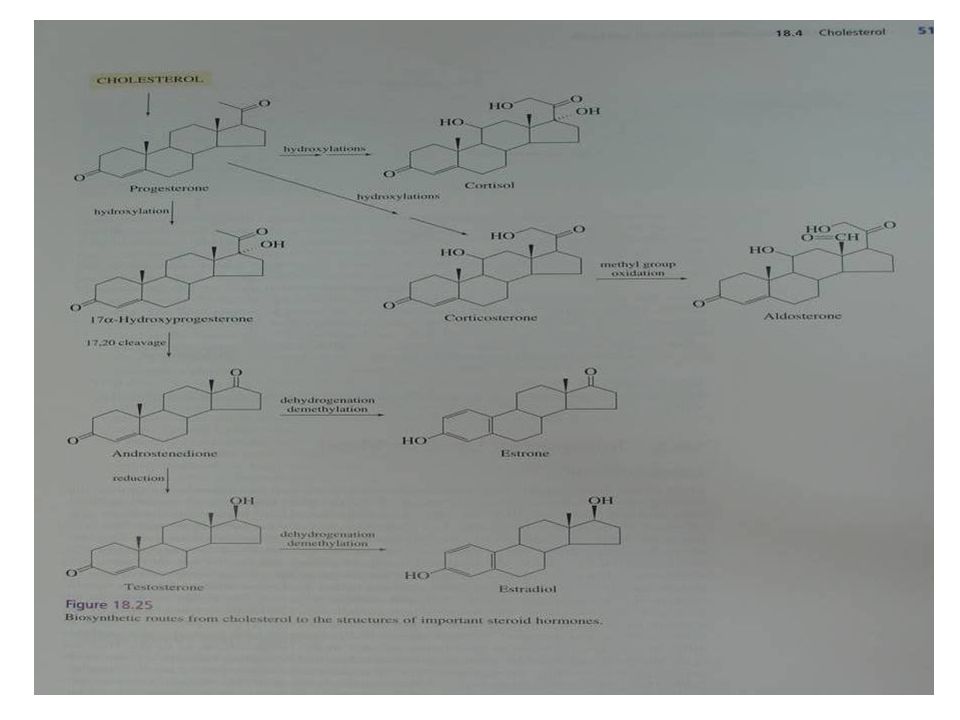
Step 2: Activated isoprenes : Page 509 Fig. 18.21 Step 3: Formation of squalene Step 4: Formation of Cholesterol C. Cholesterol as a precursor for other steroids: Page 513 Fig. 18.25

200
18.5 Transport of lipids in blood A. Lipoproteins: Page 515 Table 18.5

201
Chapt 19 Metabolism of amino acids and other nitrogenous compounds 19.1. The nitrogen cycle A. Nitrogen fixation by bacteria and legume root nodules Nonsymbiotic microorganisms: Klebsiella, Azotbacter and Clostridia Symbiotic microorganisms: Rhizobia genus: The bacteria and host plant develop a cooperative association Plant: carbohydrate for the bacteria Bacteria: ammonia for the plant B. The nitrogenase complex NADPH: Oxidative or photosynthetic An electron-transfer protein: Ferredoxin-Closeridia and Rhizobia Flavodoxin: Azotobacter ATP The enzyme complex Iron-sulfur protein: ATP binding Molybdenum-iron protein ( Mo-Fe proteins): N2 binding
: N2 binding.")
202
19.2. Biosynthesis of amino acids Use of nitrogen Glutamate dehydrogenase: -ketoglutarate + NH4++ NADPH + H Glutamate + NADP + H2O The reversal of this eaction is more important in amino acid catabolism and in anaplerotic reaction to replenish -ketoglutarate Glutamine synthetase Glutamate +NH4+ + ATP Glutamine + ADP +Pi B. Essential and non essential amino acids: Page 529 Table 19.2

203
19.3. Catabolism of amino acids A. Transamination by aminotransferase The amino group is transferred to an -keto acid, usually -ketoglutarate. B. Catabolism of carbon skeletons: Page 536 Fig. 19.13

204
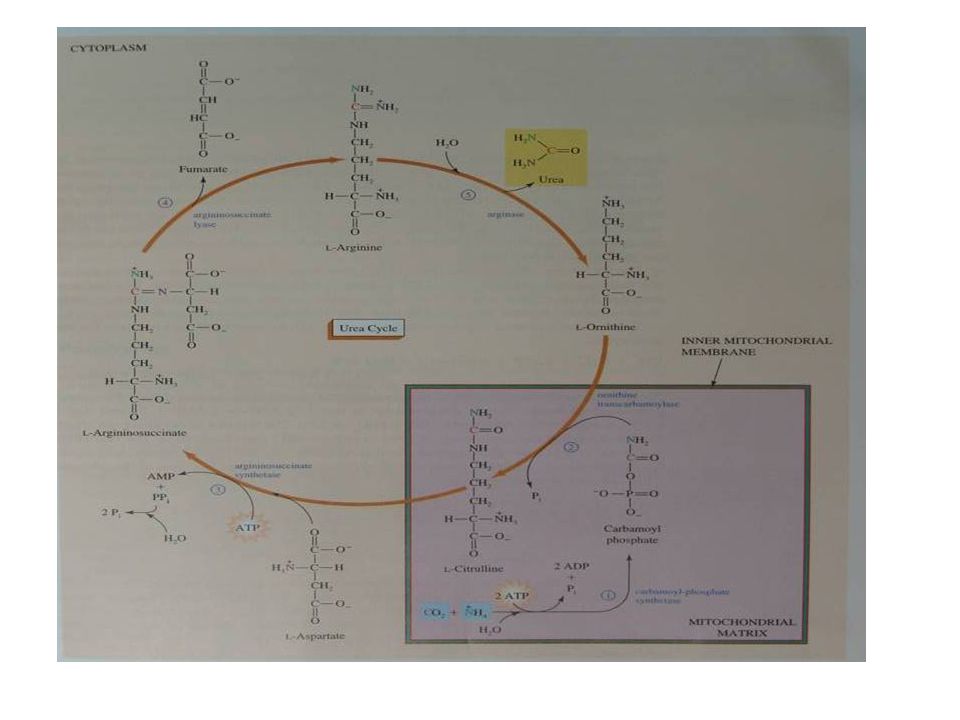
19.4. Elimination of NH 4 + A. Glutamate dehydrogenase Amino acid -ketoglutarate NADA + H +NH 4 + aminotransferase Glutamate dehydrogenase -keto acid Glutamate NAD + H 2 O B. The Urea cycle: Page 539 Fig. 19.16

206
19.5 Amino acids as precursors of other biomolecules A. Porphyrins: From succinl CoA B. Biogenic amines and other products: Page 544 Fig. 19.20

207
C. Melanins: From tyrosine D. Purine and pyrimidine nucleotides:Page 548 Fig. 19.24 Ribonucleotide reductase: Ribonucleotide + NADPH + H+ Deoxyribonucleotide + NADP + H2O Methotrexate and flurouracil: Inhibitor of thymidylate synthetase Dump + N5, N10-methylene –tretra hydrofolate(FH4) dTMP + FH4
 dTMP + FH4.")
208
Chapter 20 Integration, Coordination, and specialization in metabolism 20.1. Overall strategies of metabolism Review of metabolism. Page 559 Fig. 20.1

209
20.2. Metabolic specialization and integration A. Metabolic profiles of organs Page 561 Table 20.1

210
B. Integrated metabolic pathways Cori cycle: Page 563 Fig. 20.3

211
Glucose- alanine cycle Page 564 Fig. 20.4

212
C. Production and Distribution of ketone bodies Page 565 Fig. 20.5

213
20.3. Metabolic control by hormones. Page 567 Table 20.2

214
20.4. Metabolic responses to stressful conditions A. Conventional lifestyle After meal, blood glucose level - Up Stimulation of insulin secretion Suppression of glucagons secretion Promotion of glucose uptake into the liver, where glycogen synthesis is enhanced and glycogen breakdown is inhibited. Fatty acid synthesis is stimulated in the liver. Triacylglycerols are distributed by VLDL in the bloodstream for storage in adipose tissue. Abundant glucose available in muscle is stored in glycogen. A few hours after meal Insulin secretion is decreased and glucagons secretion increases. In order to maintain a constant level of blood glucose, glycogen is mobilized in the liver Lipase action in adipocytes is activated by removal of insulin inhibition. Decreasing levels of insulin slow glycolysis in muscle, liver and adipocytes by reducing their permeability to glucose.

215
B. Disturbances that modify metabolism Starvation/ Fasting Page 569 Table 20.3 and Fig. 20.7

216
C. Biochemistry of exercise Sprinting: Page 570 Table 20.4 20.5. Biochemical factors in obesity A. Having a body weith more than 20% over an ideal standard weight. Major risk factor diatetes hear disease, high blood pressure and stroke as well as some cancers. B. Leptin A product of ob gene Appears to act as a hormone to regulate body weight by monitoring the amount of fat stored in the body of the mouse

Similar presentations


 Sun is source of all energy Through photosynthesis/dark reactions, plants convert.>")


 The McGraw-Hill Companies, Inc. www.nicholls.edu/biol-qcf.>")


