Download presentation
Presentation is loading. Please wait.

1
Lecture 12 World Income Inequality: past, present and future

2
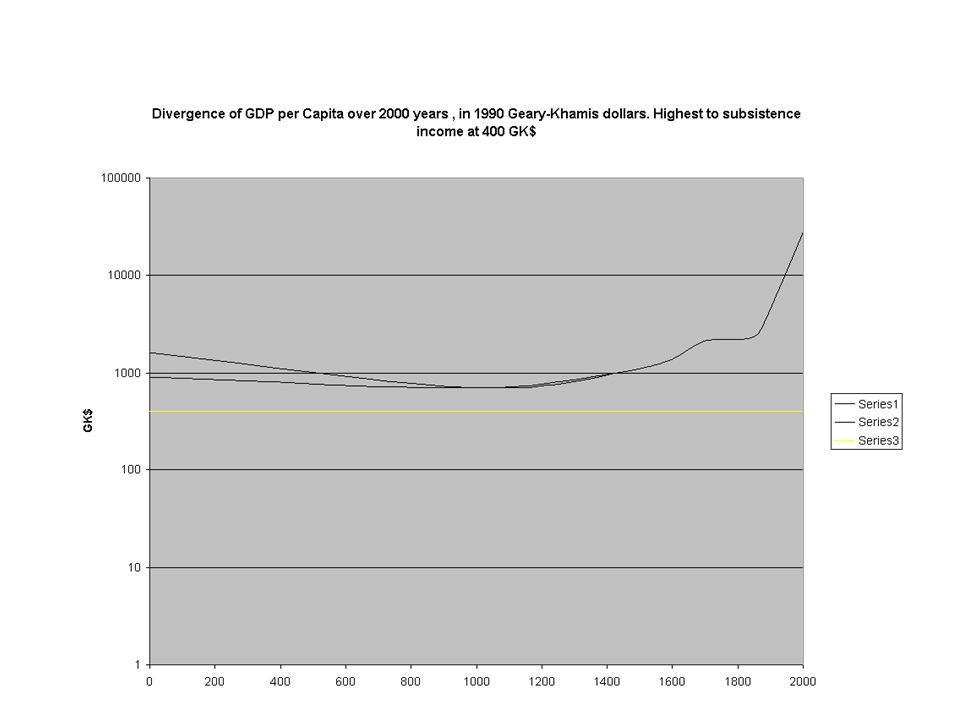
The Inequality of Nations The richest to poorest ( at $400 ) nation indicator tells you about the opportunities lost in poor nations It reflects an increasing gap between technological and institutional potential and the consequences of not being able to absorb advanced technology because of malfunctioning institutions, poor educational standards and bad government – and poor advice from international aid agencies? Most of the ‘Divergence Big Time’ is a post 1800 phenomenon but you can trace the beginning back to c.1500.

4
Is our wealth based on exploitation of the poor? Not much, but Rich world’s agricultural protectionism lowers world market price for poor peasants world wide International division of labour has given poor countries exportable commodities with high price volatility Foreign investments in poor countries smaller than expected Major problem is ‘unlimited supply of labour’ which pushes wages down to subsistence and translates technological progress into falling commodity prices and potentially falling terms of trade for the poor relative to the rich world, the W. A. Lewis hypothesis

5
The sources of inequality Inequality of personal income is linked to natural talent skill acquired by education and on the job training accumulated wealth inherited wealth market imperfections discrimination

6
Measuring Inequality Standard dispersion measures will do such as variance, standard deviation or coefficient of variation We will concentrate on the so-called Gini- coefficient The intuition behind G: it measures the deviation of observed income distribution from the ideal state of perfect equality

7
The Gini explored

8
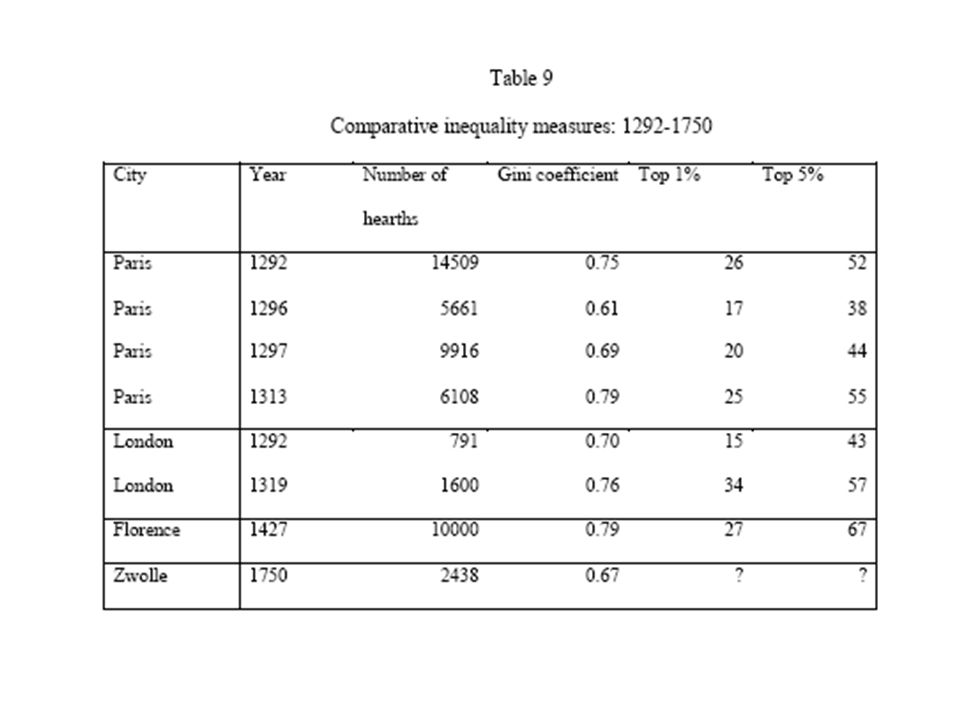
Interpretation of the numbers A Gini coefficient of 1 means perfect inequality, total income is held by the richest person As the coefficient get smaller than 1 the economy gets less unequal Next table indicates considerable inequality in medieval European cities which reflects a sophisticated division of skills and labour as well as unequal distribution of wealth

10
Inequality in the modern world

11
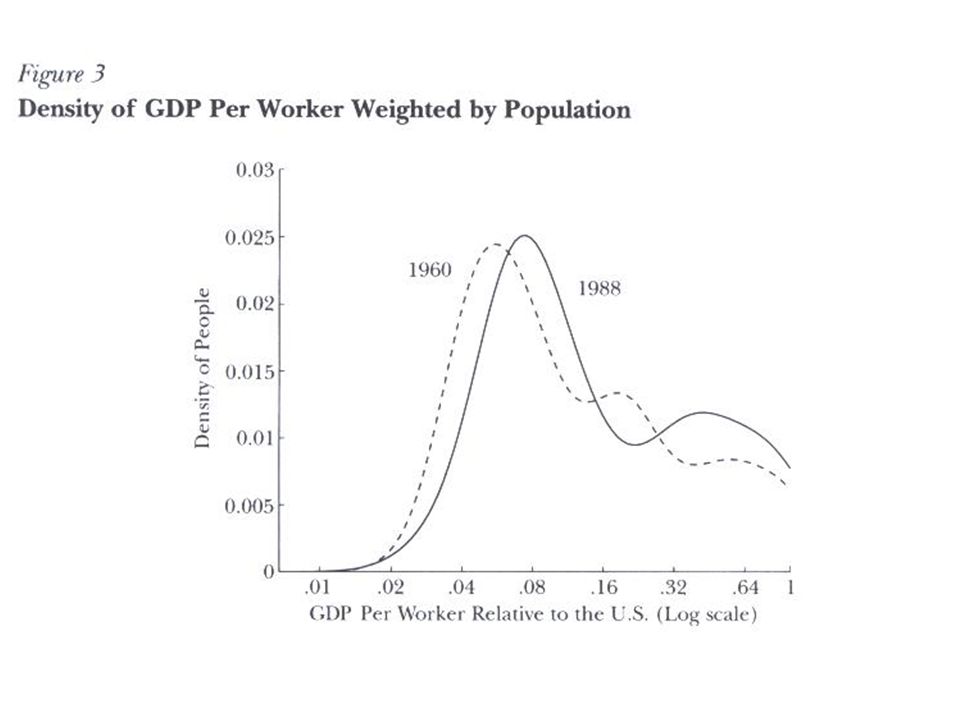
Why do trends differ? Un-weighted inequality increases: each nation is represented by its average GDP per head and all nations have the same weight = 1 Population weighted inequality controls for the fact that nations differ in population size, the larger the nation is the larger weight its GDP per head gets

12
World income inequality paradox Population weighted inequality falls because many of the fast growing economies, such as China and India, have large populations But early modernizing economies have skill shortages increasing the so called Kuznets inequality As a consequence ‘global inequality’ which controls for changes in each nation’s inequality has not fallen

13
Kuznets at work

14
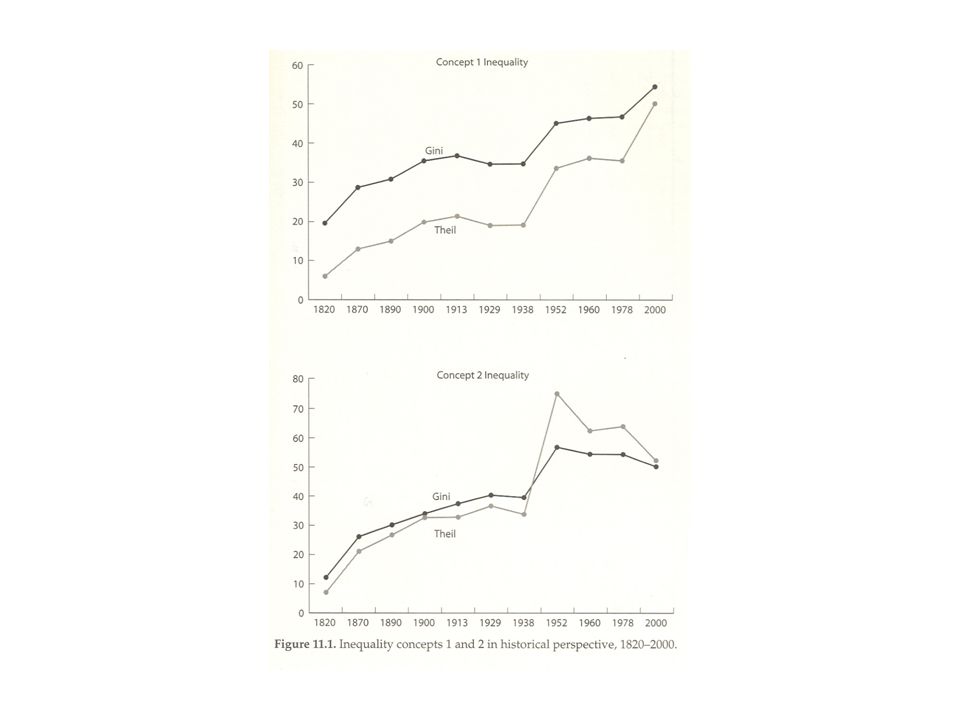
Long term trends Next figure follows the long run trends in un- weighted (concept 1)and population weighted inequality Increase in pop. weighted inequality (concept 2) when a small number of economies join the ‘growth club’ but decrease when a large number of economies join the growth club by 1950 and converge to income levels of the richest nations
 when a small number of economies join the ‘growth club’ but decrease when a large number of economies join the growth club by 1950 and converge to income levels of the richest nations.")
16
China makes a difference!

17
Predicting the future from the past Next table estimates observed transition probabilities, for example the probability of getting from low initial income to high growth, from medium level initial income to high growth into high growth etc. Assuming that these probabilities are stable a Markow process predicts a stable long run outcome

18
Conclusion: Inequality will fall but it will not disappear The very poor nations will fall in numbers and the very rich will increase But the estimates are based on historical transition probabilities and these probabilities will change A nation with a low transition probability to high growth might change institutioins and policy to improve chance

19
Back to the Future

20
The Lucas simulation Assume that all economies can – sooner or later – get into the growth club The number of economies joining the club is initially small, then increases until all nations are in the club The larger the income gap to the leading economies the faster will initial growth be for the newcomer In the long run all economies will grow at the same rate which is lower than the newcomer rate From these assumptions the evolution of average world growth rate and income dispersion can be predicted World average growth rates will reach a maximum and then fall in the future and so will ( un-weighted) income inequality
 income inequality")
21
More equality in the future!

Similar presentations
>")


>")


