Download presentation
Presentation is loading. Please wait.

1
www.wondershare.com Break-Even & Leverage Analysis CH.6

2
decisions that managers make regarding the cost structure of the firm. These decisions will, in turn, impact the decisions they make regarding methods of financing the firm’s assets (i.e., its capital structure) and pricing the firm’s products.
 and pricing the firm’s products..")
3
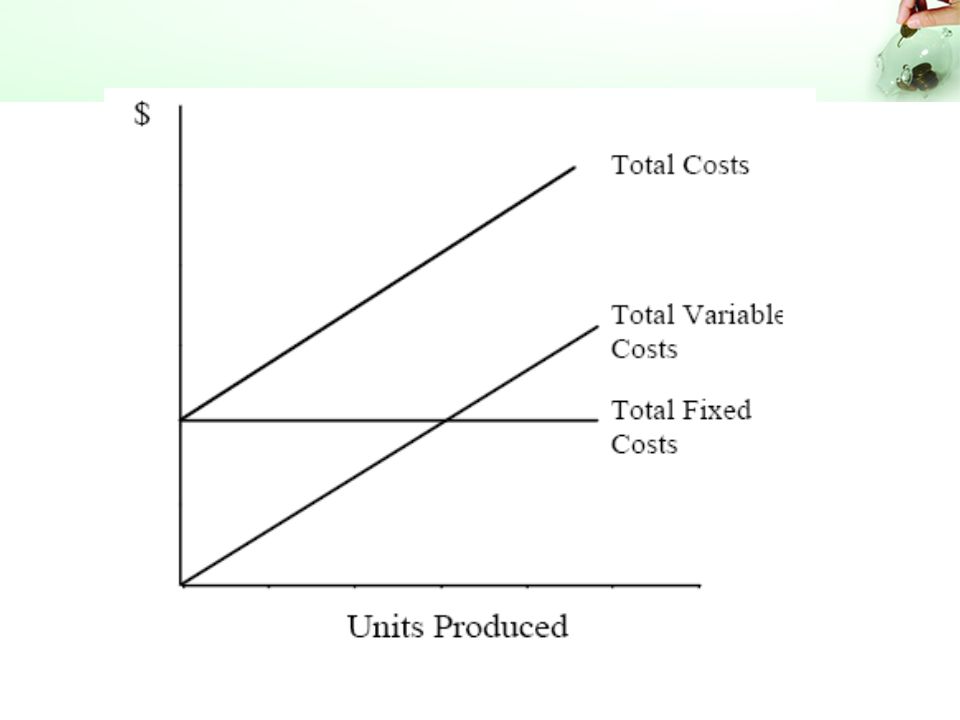
In general, we will assume that the firm faces two kinds of costs: 1. Variable costs are those costs that are expected to change at the same rate as the firm’s sales. Variable costs are constant per unit, so as more units are sold total variable costs will rise. Examples of variable costs include sales commissions, costs of raw materials, hourly wages, etc.

4
2. Fixed costs are those costs that are constant, regardless of the quantity produced, over some relevant range of production. Total fixed cost per unit will decline as the number of units increases. Examples of fixed costs include rent, salaries, depreciation, etc.

6
We can define the break-even point as the level of sales (either units or dollars) that causes profits (however measured) to equal zero.
 that causes profits (however measured) to equal zero.")
7
Most commonly, we define the break-even point as the unit sales required for earnings before interest and taxes (EBIT) to be equal to zero. This point is often referred to as the operating breakeven point.

8
Define Q as the quantity sold, P is the price per unit, V is the variable cost per unit,and F as total fixed costs. With these definitions, we can say: Q(P-V)-F =EBIT If we set EBIT in equation to zero, we can solve for the break-even quantity (Q*):
-F =EBIT If we set EBIT in equation to zero, we can solve for the break-even quantity (Q*):.")
9
The quantity P - V is often referred to as the contribution margin per unit, because this is the amount that each unit sold contributes to coverage of the firm’s fixed costs. We can now calculate the firm’s break-even point in dollars by simply multiplying Q* by the price per unit:

10
if we know the contribution margin as a percentage of the selling price (CM%), we can easily calculate the break-even point in dollars.
, we can easily calculate the break-even point in dollars.")
11
If we wanted to know how many units need to be sold to break even in terms of net income

12
Firms that use large amounts of operating leverage will find that their earnings before interest and taxes will be more variable than those who do not. We would say that such a firm has high business risk. Business risk is one of the major risks faced by a firm, and can be defined as the variability of EBIT.

13
The more variable a firm’s revenues, relative to its costs, the more variable its EBIT will be. Also, the likelihood that the firm won’t be able to pay its expenses will be higher.

14
Business risk results from the environment in which the firm operates. Such factors as the competitive position of the firm in its industry, the state of its labor relations, and the state of the economy all affect the amount of business risk a firm faces. In

15
the degree to which the firm’s costs are fixed (as opposed to variable) will affect the amount of business risk. To a large degree, these components of business risk are beyond the control of the firm’s managers.

16
The amount of financial risk is determined directly by management. Financial risk refers to the probability that the firm will be unable to meet its fixed financing obligations (which includes both interest and preferred dividends).
..")
17
all other things being equal, the more debt a firm uses to finance its assets, the higher its interest cost will be. Higher interest costs lead directly to a higher probability that the firm won’t be able to pay. Since the amount of debt is determined by managerial choice, the financial risk that a firm faces is also determined by management.

18
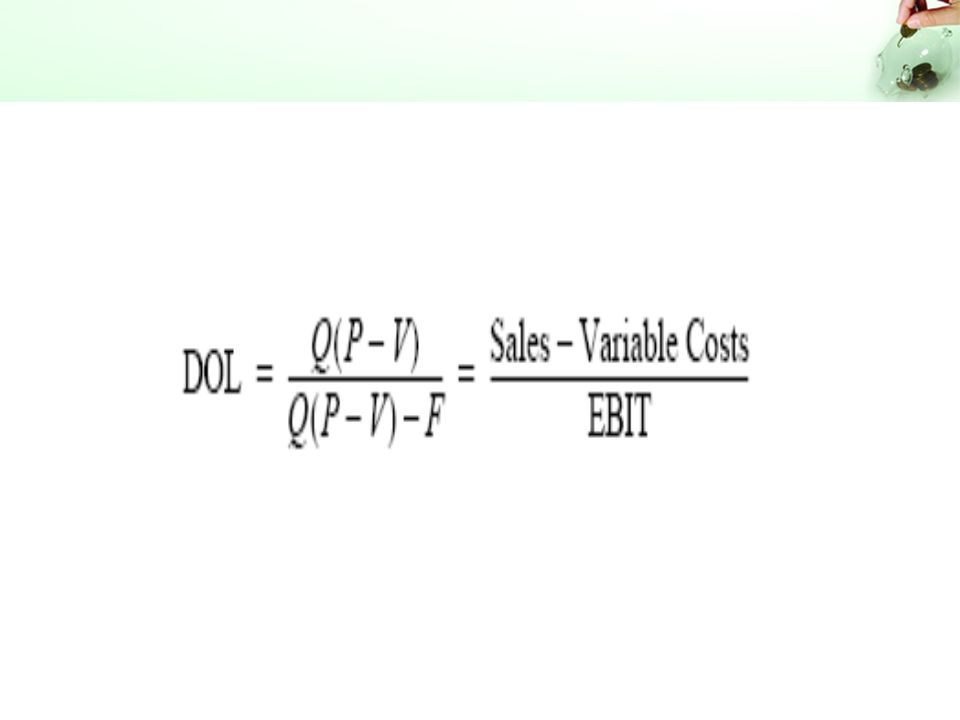
We can measure operating leverage by comparing the percentage change in EBIT to a given percentage change in sales. This measure is called the degree of operating leverage (DOL):
:.")
19
As long as sales are increasing, a high DOL is desirable. However, if sales begin to decline, a high DOL will result in EBIT declining at an even faster pace than sales.

21
leverage is indeed a double-edged sword. You can see that a high DOL would be desirable as long as sales are increasing, but very undesirable when sales are decreasing.

22
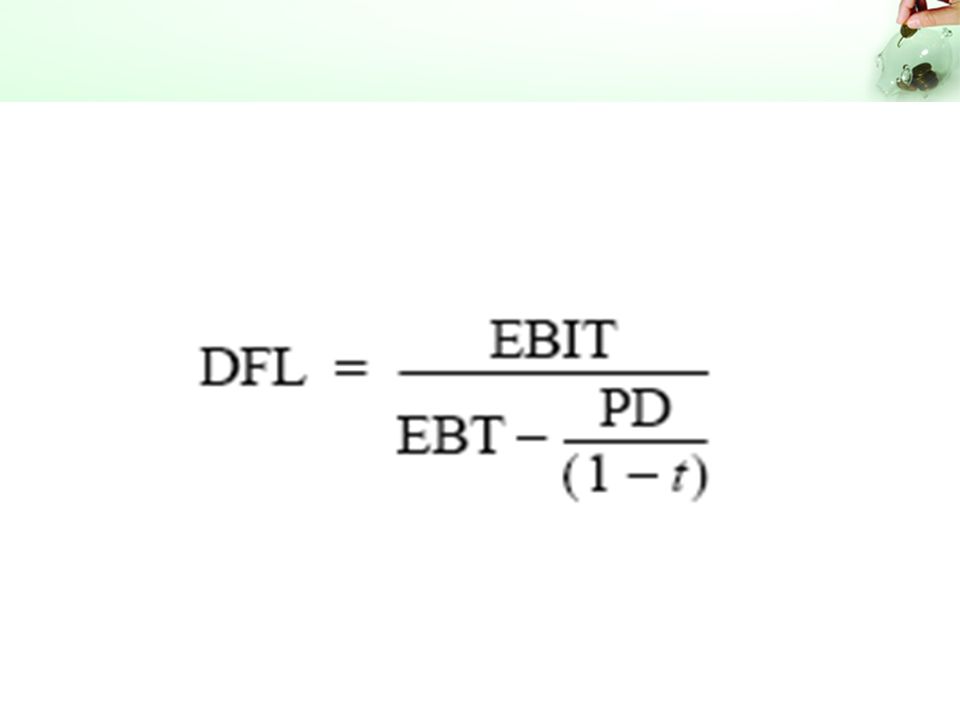
Financial leverage is similar to operating leverage, but the fixed costs that we are interested in are the fixed financing costs. These are the interest expense and preferred dividends.

24
PD is the preferred dividends paid by the firm, and t is the tax rate paid by the firm. Since preferred dividends are paid out of after-tax dollars, we must determine how many pre-tax dollars are required to meet this expense.

25
Most firms make use of both operating and financial leverage. We can measure the total leverage employed by the firm by comparing the percentage change in sales to the percentage change in earnings per share.

26
This measure is called the degree of combined leverage (DCL):
:")
Similar presentations


 Define business, financial, and total risk. Calculate.>")

 Business and Financial Risk Employing Leverage and the Income Statement Operating Leverage and Business Risk.>")


 Scenario and other what-if analyses Actual cash flows and projected cash flows. Forecasting risks (estimation.>")