Download presentation
Presentation is loading. Please wait.

1
Comparison of Parametric and Nonparametric Thresholding Methods for Small Group Analyses Thomas Nichols & Satoru Hayasaka Department of Biostatistics U. of Michigan

2
Abstract Powerful and valid thresholding methods are needed to make the most of functional neuroimaging data. Standard thresholding methods use random field theory (RFT) to obtain Familywise Error Rate (FWER) corrected thresholds [1]. However these methods have had little validation with t images, the statistic relevant for small group random effects analyses [2]. In this work we use the nonparametric permutation test to validate RFT methods. We use real datasets and simulated null t images to assess when, in terms of degrees of freedom (DF) and smoothness, the parametric methods agree with the exact nonparametric methods. We find that for low DF there is dramatic conservativeness in the RFT results, even for typical smoothness (3 voxel FWHM). In such settings the nonparametric permutation can overcome this conservativeness.
 to obtain Familywise Error Rate (FWER) corrected thresholds [1]. However these methods have had little validation with t images, the statistic relevant for small group random effects analyses [2]. In this work we use the nonparametric permutation test to validate RFT methods. We use real datasets and simulated null t images to assess when, in terms of degrees of freedom (DF) and smoothness, the parametric methods agree with the exact nonparametric methods. We find that for low DF there is dramatic conservativeness in the RFT results, even for typical smoothness (3 voxel FWHM). In such settings the nonparametric permutation can overcome this conservativeness..")
3
Motivation How does Random Field Theory (RFT) perform on small group data? Approach –Use real data and permutation test to evaluate RFT in realistic setting –Use simulated data to understand RFT performance when truth known

4
Introduction Massively Univariate Modeling –Standard approach to fMRI and PET data –Fit a univariate model at each point in the brain –Create images of test statistic, assessing effect of interest Massive Multiple Comparisons Problem –If one has 100,000 voxels, a =0.05 threshold will yield 5,000 false positives –Must control some measure of false positives

5
Familywise Error Rate (FWER) Solution –Familywise Error is existence of any false positives –Standard approach is to control chance of a familywise error, FWER –Standard methods (e.g. Bonferroni) methods control FWER Random Field Theory FWER Solution [1] –General, Easy to apply Only requires smoothness and volume Results available for images of Z, t, F, chi2, etc
 methods control FWER Random Field Theory FWER Solution [1] –General, Easy to apply Only requires smoothness and volume Results available for images of Z, t, F, chi2, etc.")
6
–Heavy on assumptions Gaussian data Stationary (or unwarpable) covariance Smooth images required –Theory is for continuous random fields Amount of smoothness needed for t images not known Asymptotic, approximate
 covariance Smooth images required –Theory is for continuous random fields Amount of smoothness needed for t images not known Asymptotic, approximate")
7
Permutation FWER Solution [3] –Less general, computationally intensive Repeatedly analyze your data, permuting each time Permute as allowed by the null hypothesis –Very weak assumptions Only require that data is exchangeable under the null hypothesis For intersubject "second level" analyses (fMRI, PET, MEG) this is reasonable "Exact" - False positive rate is controlled as specified
![Permutation FWER Solution [3] –Less general, computationally intensive Repeatedly analyze your data, permuting each time Permute as allowed by the null hypothesis –Very weak assumptions Only require that data is exchangeable under the null hypothesis For intersubject second level analyses (fMRI, PET, MEG) this is reasonable Exact - False positive rate is controlled as specified](http://images.slideplayer.com/16/5055794/slides/slide_7.jpg "Permutation FWER Solution [3] –Less general, computationally intensive Repeatedly analyze your data, permuting each time Permute as allowed by the null hypothesis –Very weak assumptions Only require that data is exchangeable under the null hypothesis For intersubject second level analyses (fMRI, PET, MEG) this is reasonable Exact - False positive rate is controlled as specified")
8
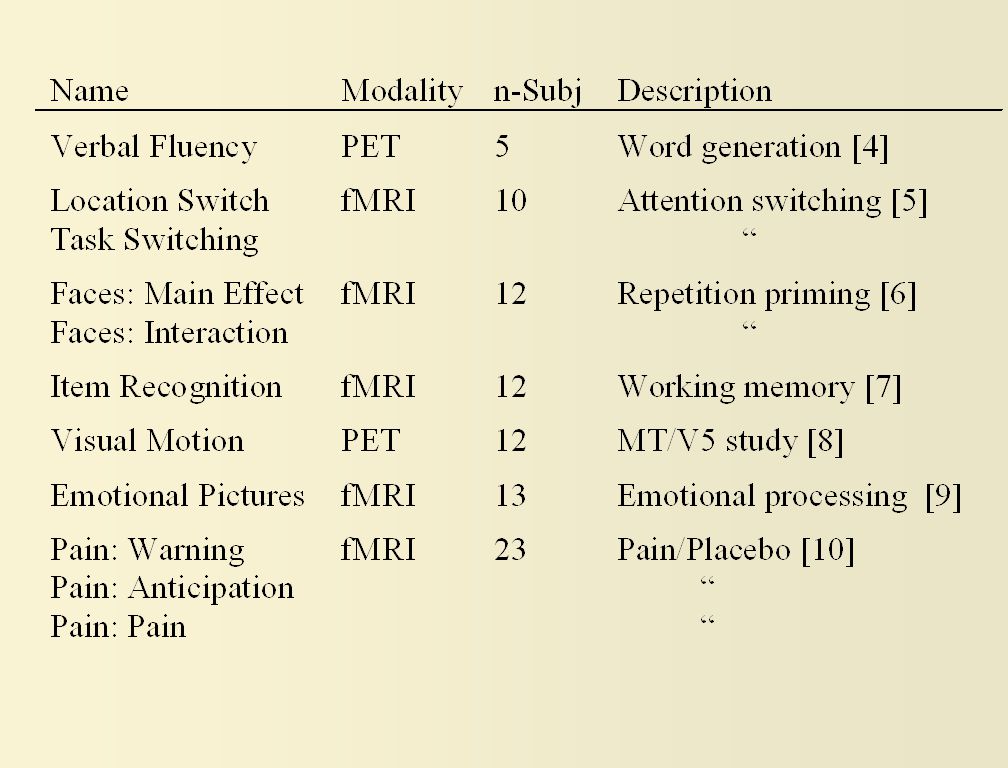
Methods: Real Data 9 fMRI and 2 PET Group Datasets Each analyzed with summary image approach [2] Corrected threshold and number of significant voxels recorded
![Methods: Real Data 9 fMRI and 2 PET Group Datasets Each analyzed with summary image approach [2] Corrected threshold and number of significant voxels recorded](http://images.slideplayer.com/16/5055794/slides/slide_8.jpg "Methods: Real Data 9 fMRI and 2 PET Group Datasets Each analyzed with summary image approach [2] Corrected threshold and number of significant voxels recorded")
10
One Sample t Images –Size: 32x32x32 (32767 voxels) –Smoothness: 0, 1.5, 3, 6,12 FWHM –Degrees of Freedom: 9, 19, 29 10, 20 or 30 GRFs simulated for each t realization –Realizations: 3000 Record the FWER, proportion of 3000 which reject any voxels Methods: Simluations
 –Smoothness: 0, 1.5, 3, 6,12 FWHM –Degrees of Freedom: 9, 19, 29 10, 20 or 30 GRFs simulated for each t realization –Realizations: 3000 Record the FWER, proportion of 3000 which reject any voxels Methods: Simluations")
11
–Random Field Threshold Corrected =0.05 Smoothness estimated (not assumed known) –Permutation 100 relabelings Threshold: 95%ile of permutation dist n of maximum
 –Permutation 100 relabelings Threshold: 95%ile of permutation dist n of maximum")
12
Results: Real Data Perm. always lower Bonf. usually lower than RFT !

13
Note on dataset selection: The only datasets analyzed but not included in this poster are other contrasts (usually non-orthogonal) from the above studies. All omitted datasets showed the pattern reported here, that of the RFT thresholds being less sensitive than permutation’s.

14
Results: Simulations

15
Familywise Error Thresholds –RF & Perm adapt to smoothness –Perm & Truth close –Bonferroni close to truth for low smoothness 9 df 19 df

16
Familywise Error Thresholds –RF only good for high DF, high smoothness –Perm exact –Smoothness estimation not sole problem 9 df 19 df

17
Minimum P-value CDF’s –Show’s all thresholds simultaneously Lowering doesn’t help

18
Conclusions RFT conservative on real and simulated small group data –Bonferroni almost always more sensitive for real data considered Smoothness much greater than 3 voxel FWHM is needed –Extreme smoothness required for results to be close to exact E.g. 12 FWHM at 9 DF

19
For simple one- and two-sample t test group analyses, always compare parametric RFT thresholds to nonparametric thresholds. –Easy to do with SnPM, a nonparametric toolbox for SPM

20
References [1] Worsley et al, HBM 4:58-73, 1995. [2] Holmes & Friston, NI 7(4):S754, 1999. [3] Nichols & Holmes, HBM 14:1-25. [4] http://www.fil.ion.ucl.ac.uk/spm/datahttp://www.fil.ion.ucl.ac.uk/spm/data [5] Wager et al, in preparation. [6] Henson et al, CerebCortex 12:178-186, 2002. [7] Marshuetz et al, JoCN, 12/S2:130-144, 2000. [8] Watson et al, CerebCortex 3:79-94, 1993. [9] Phan et al, Biological Psychiatry, 53:211--215, 2003 [10] Wager et al, in preparation [11] http://www.fil.ion.ucl.ac.uk/spm/snpmhttp://www.fil.ion.ucl.ac.uk/spm/snpm Poster and detailed paper available at http://www.sph.umich.edu/~nichols
![References [1] Worsley et al, HBM 4:58-73, [2] Holmes & Friston, NI 7(4):S754,](http://images.slideplayer.com/16/5055794/slides/slide_20.jpg "[3] Nichols & Holmes, HBM 14:1-25. [4] [5] Wager et al, in preparation. [6] Henson et al, CerebCortex 12: , [7] Marshuetz et al, JoCN, 12/S2: , [8] Watson et al, CerebCortex 3:79-94, [9] Phan et al, Biological Psychiatry, 53: , 2003 [10] Wager et al, in preparation [11] Poster and detailed paper available at")
Similar presentations


 Institute for Empirical.>")


