Download presentation
Presentation is loading. Please wait.

1
Gene and Protein Networks II Monday, April 16 2006 CSCI 4830: Algorithms for Molecular Biology Debra Goldberg

2
Outline 1. Recap 2. Confidence assessment, edge prediction (cont’d) 3. Predicting protein function 4. Predicting protein complexes/functional groups 5. Network integration 6. Caveats, cautions, practical issues

3
Summary of network models Random not grown, low clustering, short distances, Poisson degree distribution Regular (lattice) high clustering, long distances Small world high clustering, short distances Scale-freepower law degree distribution Hierarchical high clustering, modular, power law degree distribution
 high clustering, long distances Small world high clustering, short distances Scale-freepower law degree distribution Hierarchical high clustering, modular, power law degree distribution")
4
There is information in a gene’s position in the network We can use this to predict Relationships –Interactions –Regulatory relationships Protein function –Process –Complex / “molecular machine”

5
Confidence assessment Can use topology to assess confidence if true edges and false edges have different network properties Assess how well each edge fits topology of true network Can also predict unknown relations

6
Prediction A v-w edge would have a high clustering coefficient v w

7
Outline 1. Recap 2. Confidence assessment, edge prediction (cont’d) 3. Predicting protein function 4. Predicting protein complexes/functional groups 5. Network integration 6. Caveats, cautions, practical issues

8
Interaction generality Confidence measure for edge based on topology around neighbors. Saito, Suzuki, and Hayashizaki 2002,2003

9
Confidence assessment Integrate experimental details with local topology –Degree –Clustering coefficient –Degree of neighbors –Etc. Used logistic regression Bader, et al., Nature Biotechnology 2003

10
The synthetic lethal network has many triangles Xiaofeng Xin, Boone Lab

11
2-hop predictors for SSL SSL – SSL (S-S) Homology – SSL (H-S) Co-expressed – SSL (X-S) Physical interaction – SSL (P-S) 2 physical interactions (P-P) v w S:Synthetic sickness or lethality (SSL) H:Sequence homology X:Correlated expression P:Stable physical interaction Wong, et al., PNAS 2004
 Homology – SSL (H-S) Co-expressed – SSL (X-S) Physical interaction – SSL (P-S) 2 physical interactions (P-P) v w S:Synthetic sickness or lethality (SSL) H:Sequence homology X:Correlated expression P:Stable physical interaction Wong, et al., PNAS 2004")
12
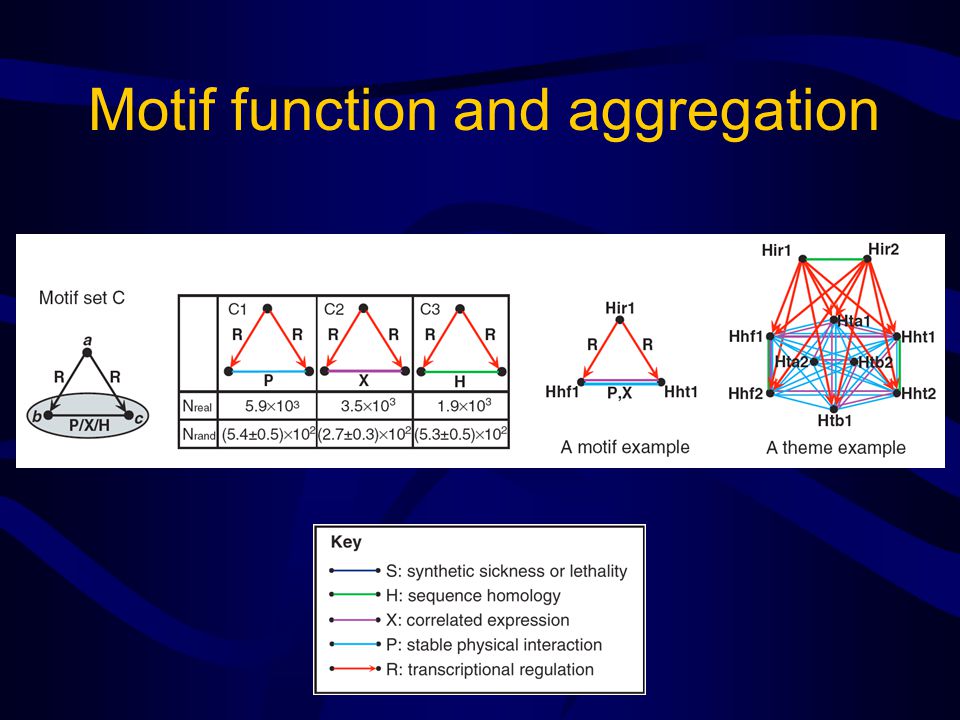
Multi-color motifs S:Synthetic sickness or lethality H:Sequence homology X:Correlated expression P:Stable physical interaction R:Transcriptional regulation Zhang, et al., Journal of Biology 2005

13
Outline 1. Recap 2. Confidence assessment, edge prediction (cont’d) 3. Predicting protein function 4. Predicting protein complexes/functional groups 5. Network integration 6. Caveats, cautions, practical issues

14
Computationally predicting protein function Homology Machine Learning Graph-theoretic methods

15
Majority method Consider immediate neighbors “Guilt by association” –Schwikowski, et al., Nature Biotechnology 2001

16
Neighborhood method How does frequency affect assignment? Consider a given radius –Hishigaki, et al., Yeast 2001

17
Minimum Cut methods Minimize interactions between proteins with different annotations –Vazquez, et al., Nature Biotech. 2003 –Karaoz, et al., PNAS 2004

18
Functional flow Use network flow algorithm to “transport” function annotation –Nabieva, et al., Bioinformatics 2005

19
A Markov Random Field method Function prediction based on – Frequency of each function – # neighbors – # of these neighbors with function in question Functional linkage graph Iterate twice – Letovsky and Kasif, Bioinformatics 2003

20
Outline 1. Recap 2. Confidence assessment, edge prediction (cont’d) 3. Predicting protein function 4. Predicting protein complexes/functional groups 5. Network integration 6. Caveats, cautions, practical issues

21
Community structure Proteins in a community may be involved in a common process or function Communities are dense subgraphs with sparse interconnections

22
Hierarchical clustering (1) Using natural edge weights Gene co-expression e.g., Eisen MB, et al., PNAS 1998 from www.medscape.com
 Using natural edge weights Gene co-expression e.g., Eisen MB, et al., PNAS 1998 from")
23
Hierarchical clustering (2) Adjacency vector Function cluster: Tong et al., Science 2004 Find drug targets: Parsons et al., Nature Biotechnology 2004
 Adjacency vector Function cluster: Tong et al., Science 2004 Find drug targets: Parsons et al., Nature Biotechnology 2004")
24
Topological overlap A measure of neighborhood similarity l i,j is 1 if there is a direct link between i and j, 0 otherwise Ravasz, et al., Science 2002

25
Spectral clustering Compute adjacency matrix eigenvectors Each eigenvector defines a cluster: –Proteins with high magnitude contributions Bu, et al., Nucleic Acids Research 2003 positive eigenvaluenegative eigenvalue

26
Dense subgraphs Spirin and Mirny, PNAS 2003 –Find fully connected subgraphs (cliques), OR –Find subgraphs that maximize density: 2 m / (n (n-1)) Bader and Hogue, BMC Bioinformatics 2003 –Weight vertices by neighborhood density, connectedness –Find connected communities with high weights
, OR –Find subgraphs that maximize density: 2 m / (n (n-1)) Bader and Hogue, BMC Bioinformatics 2003 –Weight vertices by neighborhood density, connectedness –Find connected communities with high weights")
27
“Betweenness” centrality Consider the shortest path(s) between all pairs of nodes “Betweenness” centrality of an edge is a measure of how many shortest paths traverse this edge Edges between communities have higher centrality Girvan, et al., PNAS 2002
 between all pairs of nodes Betweenness centrality of an edge is a measure of how many shortest paths traverse this edge Edges between communities have higher centrality Girvan, et al., PNAS 2002")
28
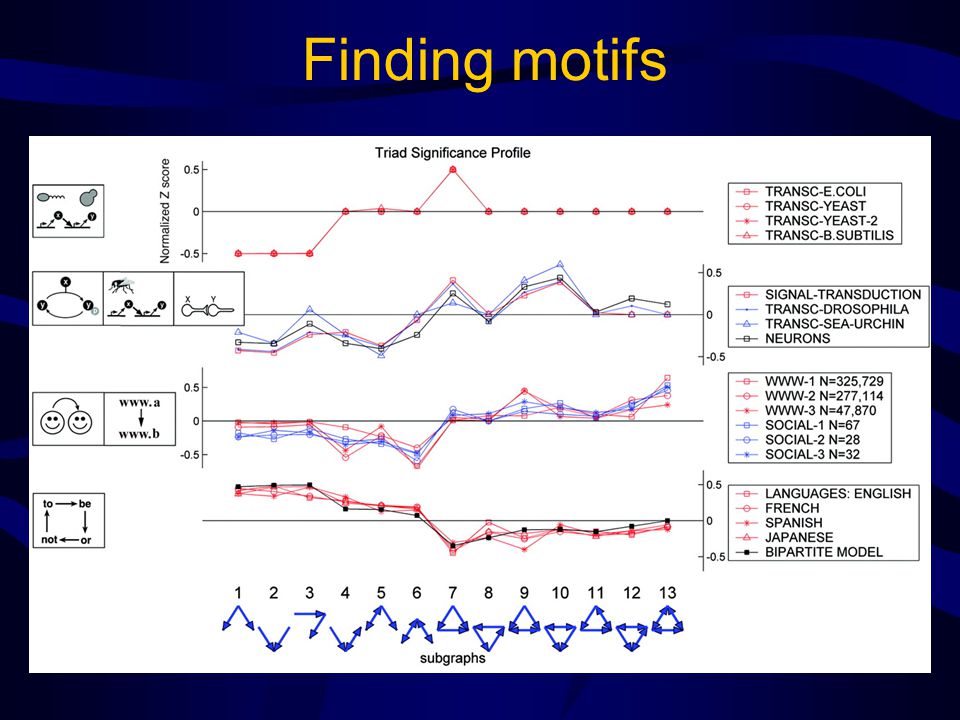
Finding motifs

30
Motif function and aggregation

32
Outline 1. Recap 2. Confidence assessment, edge prediction (cont’d) 3. Predicting protein function 4. Predicting protein complexes/functional groups 5. Network integration 6. Caveats, cautions, practical issues

33
Relationships between network data types Distinct data sources generally lead to better inferences. Associations not independent Errors independent

34
Various methods with varying goals

35
Incorporating experimental conditions Luscombe, et al., Nature 2004

36
Party and date hubs Protein interaction network Partition hubs by expression correlation of neighbors Han, et al., Nature 2004

37
Network connectivity Scale-free networks are: –Robust to random failures –Vulnerable to attacks on hubs Removing hubs quickly disconnects a network and reduces the size of the largest component Albert, et al., Nature 2000

38
Removing date hubs shatters network into communities Many sub-networks Date Hubs Party Hubs A single main component

39
Multiple species

40
Network alignment Across or within species Interaction network and genome sequence e.g., Ogata, et al., Nucleic Acids Research 2000

41
Outline 1. Recap 2. Confidence assessment, edge prediction (cont’d) 3. Predicting protein function 4. Predicting protein complexes/functional groups 5. Network integration 6. Caveats, cautions, practical issues

42
Bias: Protein abundance Abundant proteins are –more likely to be represented in some types of experiments –More likely to be essential Correlation between degree (hubs) and essentiality disappears or is reduced when corrected for protein abundance Bloom and Adami, BMC Evolutionary Biology 2003
 and essentiality disappears or is reduced when corrected for protein abundance Bloom and Adami, BMC Evolutionary Biology 2003")
43
Bias: Degree correlation Anti-correlation of degrees of interacting proteins disappears in un-biased data Coulomb, et al., Proceedings of the Royal Society B 2005 010203040506070 degree k average degree K1 25 20 15 10 5 0 essential non-essential

44
Data quality and sparseness

45
No gold standard Insufficient highly-accurate data Gold-standards often used to train and validate Insufficient standardization of procedures

46
Significance

47
Final words Network analysis has become an essential tool for analyzing complex systems –There is still much biologists can learn from scientists in other disciplines –Network analysis is itself a new and evolving field

Similar presentations


 edge (u,v) denotes similarity between u and v weighted.>")
 has a set of vertices V has a set of undirected, unweighted edges E graph G = (V, E), where.>")

>")


 >")


