Download presentation
Presentation is loading. Please wait.

1
EUROPEAN ASSISTANCE TO AGRICULTURE IN SUB SAHARAN AFRICA Bruce Hearn Department of Management, University of Leicester Veli Koc Centre for Environmental Policy, Imperial College London Jenifer Piesse Department of Management, King’s College London Department of Agricultural Economics, University of Stellenbosch Colin Thirtle Centre for Environmental Policy, Imperial College London Department of Agricultural Economics, University of Stellenbosch

2
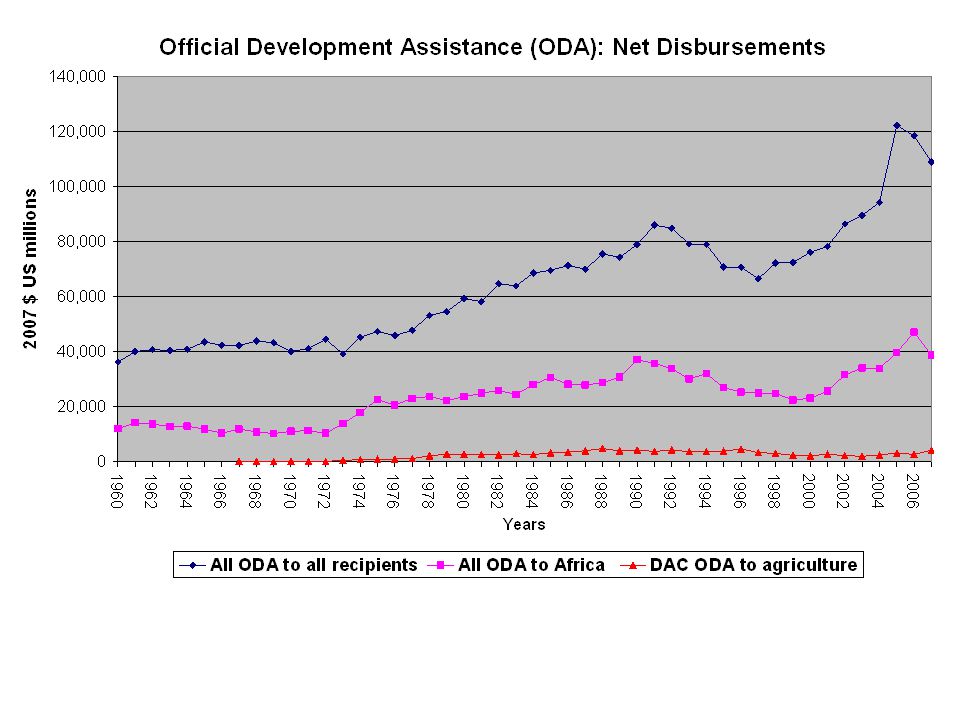
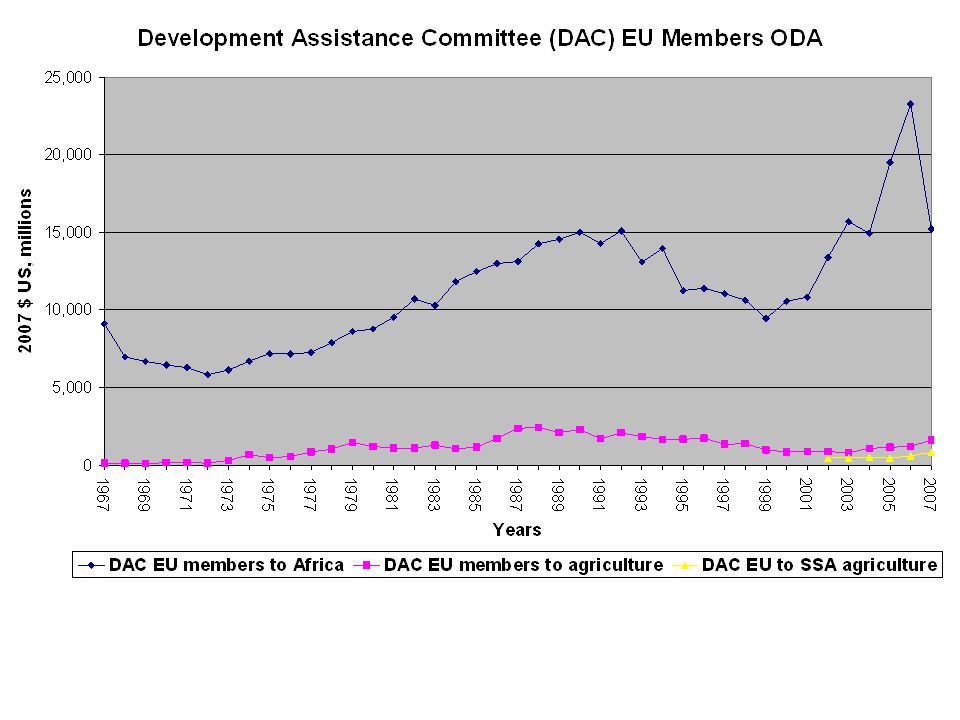
Outline and background Follows OECD 2009 - database – http://stats.oecd.org/Index.aspx See Development/Aid Activities/Creditor Reporting Systemhttp://stats.oecd.org/Index.aspx They cover all agricultural aid from OECD DAC countries We look specifically at EU countries aid to SSA only – overview Historical background – theoretical framework - regional distribution – amounts and shares by donor country – aid effort – disbursements versus commitments – decomposition by purpose – broad sector aid including food aid and emergency assistance. Top recipients – aid by purpose for Mozambique, Ghana and Uganda Key points Bilateral aid to agriculture has halved since the mid 1980s DAC aid to agriculture was 17% of total aid in the late 1980s – now only 6%

5
A Theoretical Framework The basic concept is not difficult. We have a matrix with a column for each donor county i, where i =1….m, and a row for each recipient country j, where j = 1…n. The EU countries are all bilateral donors and if in addition we knew their contributions to multilateral agencies, summing the columns would give the country totals in terms of either commitments or disbursements. Similarly, most of the countries of SSA are recipients and summing the rows would give the total aid allocated to each country.

6
Regional distribution

7
ODA Disbursements by DAC Countries to SSA Agriculture - 2007 (2007 m US$) Donor country Total aid to agriculture As %GDPAid to agriculture as share of total aid % As share of total DAC * aid % Denmark47.70.02407.55.8 Norway38.60.01524.84.7 France308.90.014911.737.6 Ireland24.50.01275.23 Belgium33.20.00905.54.1 Sweden26.70.00833.3 Switzerland12.70.00404.61.5 Netherlands24.70.00381.63 Germany47.80.00172.55.8 Spain21.50.00154.62.6 Finland2.60.00141.30.3 UK22.90.00110.92.8 Italy11.90.000641.4 US 71.130.00051.778.67 EC ** 86.792.1710.58 Total DAC820.7 4100
 Donor country Total aid to agriculture As %GDPAid to agriculture as share of total aid % As share of total DAC * aid % Denmark Norway France Ireland Belgium Sweden Switzerland Netherlands Germany Spain Finland UK Italy US EC ** Total DAC")
8
Aid to Agriculture as Share of Total DAC Agricultural Aid % by Donor Country

9
Aid Effort: DAC Members' Total Aid to Agriculture - 2007 (millions $) DonorBilateral Disbursements Bilateral Commitments Multilateral Commitments Total Commitments Australia928224106 Austria9122739 Belgium669133124 Canada12211438152 Denmark798323106 Finland23341549 France399451158608 Germany238317210527 Greece551115 Ireland32331447 Italy424588132 Japan6878212091030 Luxembourg99413 Netherlands11612151172 New Zealand611213 Norway10011718135 Portugal221112 Spain11116376230 Sweden11714450193 Switzerland64692796 United Kingdom153113205319 United States4729321491081 EU Institutions35944417462 Total DAC3302421314585670
 DonorBilateral Disbursements Bilateral Commitments Multilateral Commitments Total Commitments Australia Austria Belgium Canada Denmark Finland France Germany Greece Ireland Italy Japan Luxembourg99413 Netherlands New Zealand Norway Portugal Spain Sweden Switzerland United Kingdom United States EU Institutions Total DAC")
10
Commitments versus Disbursements

11
Distribution of Aid Between Agriculture-Related Sub-Sectors UKFRANCEUSEC Agriculture/Fishing/Forestry 32.09326.4174.90126.09 Agriculture 22.90317.4571.7495.86 Fishing 0.064.180.1013.82 Forestry 9.134.793.0516.41 Rural development 3.1422.900.0081.10 Food aid 82.8530.10285.99169.82 Emergency food aid 33.090.35961.90311.57 Total 151.17379.761,322.79688.58

12
Agricultural Aid by Purpose Agricultural Aid Sub-Divided by Purpose for FranceAgricultural Aid Sub-Divided by Purpose for Germany Agricultural Aid Sub-Divided by Purpose for the UK Agricultural Aid Sub-Divided by Purpose for the US

13
Top Recipients of Aid to Agriculture only from all DAC countries (US$ mil) CountryDAC aid to agriculture Madagascar68.45310949 Mali56.22215552 Burkina Faso54.92056853 Kenya50.11661781 Ghana50.03826509 Mozambique47.09733563 Ethiopia45.62768451 Uganda44.29296511 Cameroon44.10523707 Malawi41.39384274 Senegal40.10907136 Zambia37.12482499 Tanzania26.51654954 South Africa22.25277538
 CountryDAC aid to agriculture Madagascar Mali Burkina Faso Kenya Ghana Mozambique Ethiopia Uganda Cameroon Malawi Senegal Zambia Tanzania South Africa")
14
Top Recipients by Donor Belgium – DRC 6.45, Benin 3.15, Rwanda 2.93 France – Madagascar 56.07, Cameroon 41.98, Burkina Faso 27.84 UK – Malawi 6.93, Ghana 4.89, Rwanda 3.82 US – Uganda 16.29, Mozambique 2.79, Kenya 10.25, Zambia 9.46, Malawi 5.45

15
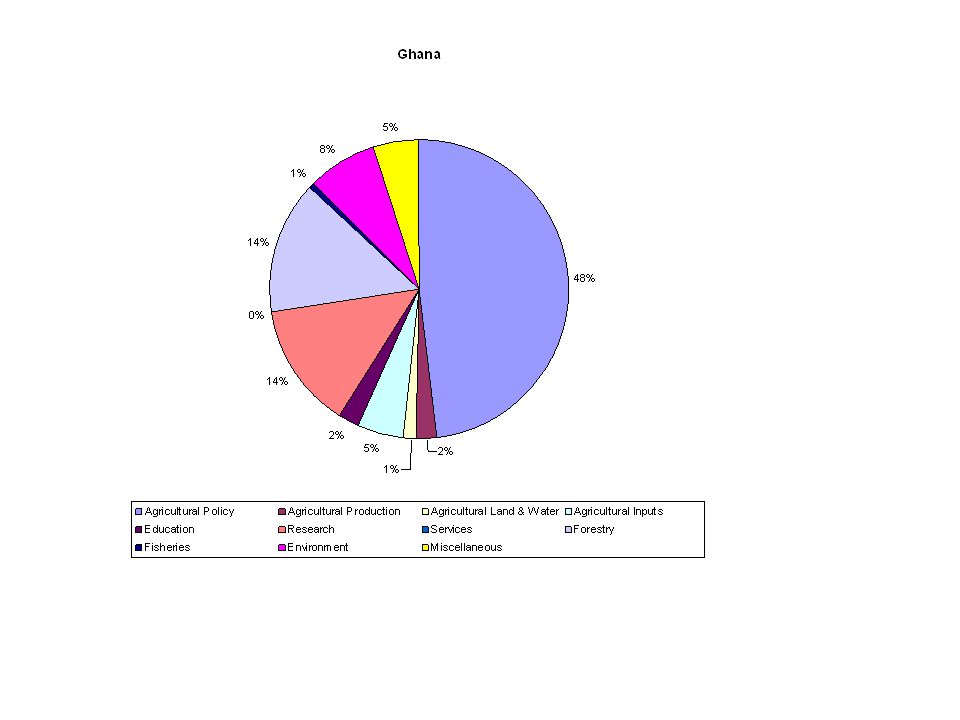
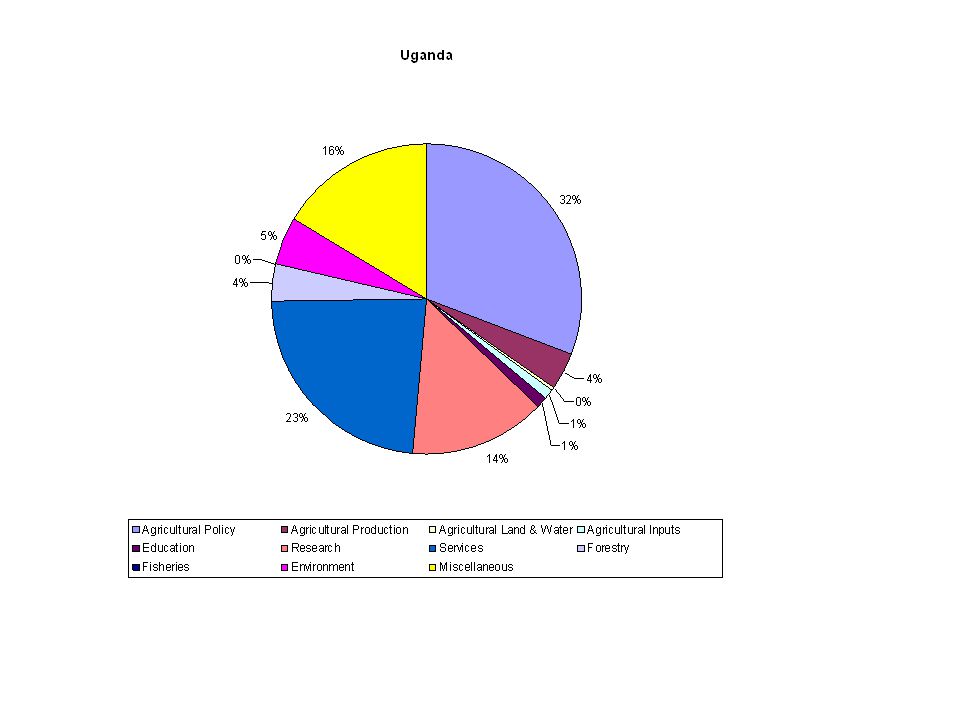
Aid by Purpose to 3 Countries

18
Shares of Official Development Assistance to SSA Agriculture by Donor (%) DAC EUUKFranceUSEC Donor ODA to SSA agriculture/ Donor ODA to SSA4.090.8811.971.792.4 Donor ODA to SSA agriculture/ DAC EU ODA to SSA agriculture1002.7337.878.5611.4
 DAC EUUKFranceUSEC Donor ODA to SSA agriculture/ Donor ODA to SSA Donor ODA to SSA agriculture/ DAC EU ODA to SSA agriculture")
Similar presentations


>")
 Jurgen Heimann UNFPA/PARIS 21 International.>")