Download presentation
Presentation is loading. Please wait.

1
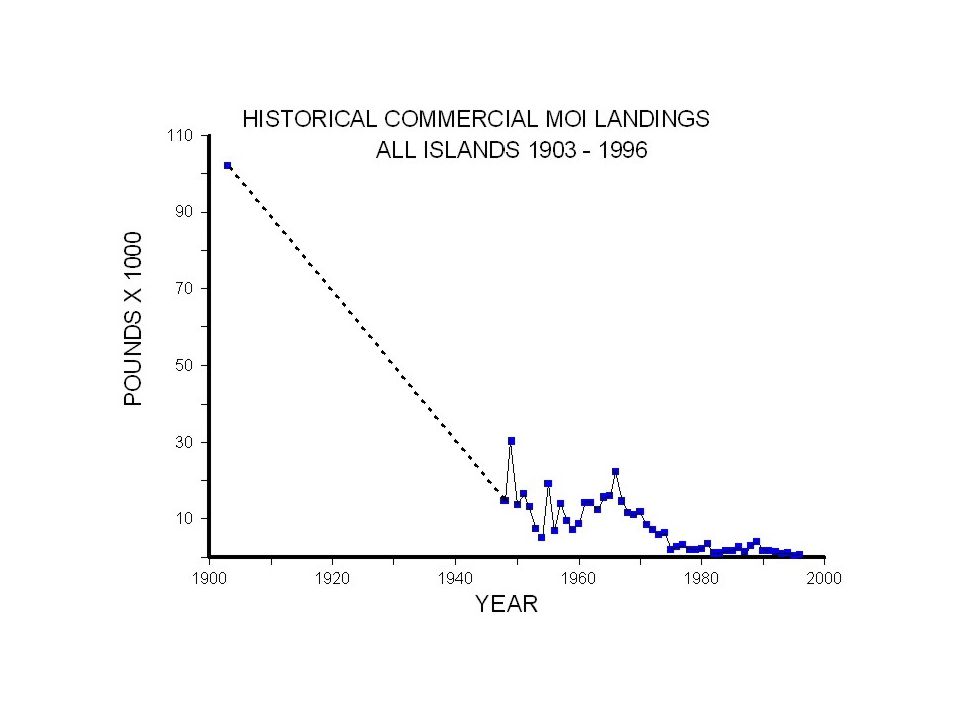
Hawaiian Fisheries Issues-3 Guide for Nearshore Fishes-NMFS/DAR Lay Gill Net Restrictions Omilu Story Leave the Big Ones Humpback Whale – Recent Phenomenon? Deep 7 Bottomfish Closure

3
Reference Shomura, R. 1987. Hawaii’s Fisheries Resources Yesterday (1900) and today (1986). Southwest Fisheries Center Administrative Report 87/21. 14pp. SH319 H3 S56 1987

4
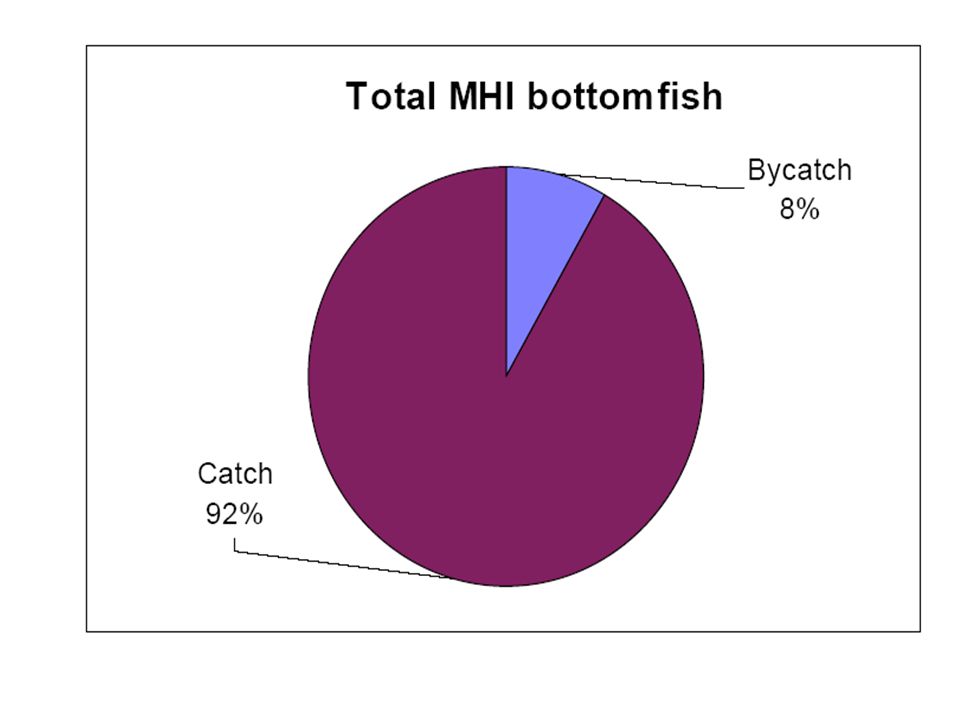
Case against Lay Gill Nets Lower biomass of reef fishes Fewer larger fish History Over-fishing Efficient Left unattended “disposable” By-catch Ghost-fishing Substrate destruction

5
Survey Gauging Public Attitudes 96%: ocean/reefs are “very important” 65%: conditions are fair-poor & worsening 65%: recreational over-fishing = problem After learning the term –94%: concerned over impact –76%: support for ban/restrictions

6
Omilu –White Ulua DLNR: Limit 10” (250mm) LR50 i.e., “legal” Tournament Results Sampled 200 fish Avg L = 350mm 6 = sexually mature All >600mm
 LR50 i.e., legal Tournament Results Sampled 200 fish Avg L = 350mm 6 = sexually mature All >600mm")
7
Leave the Big Ones More fecund Larvae show better survival Birkeland, c. and P. Dayton. 2005. the importance in fishery management of leaving the big ones. Trends in Ecology and Evolution. 20(7):356-7.
:")
8
Humpback Whales in Hawaii A Recent Phenomenon ? Not Present vs Not Noticed Recent Hawaiian Whale History Herman, L. M. 1979. Pacific Science. 33(1): 1-15
:")
9
Early Hawaii Whaling History 1820- Sperm whaling off Japan Balaena..took a sperm whale 1840’s: 1 st signs of humpbacks in Hawaii 1850’s more shore stations-rendering 1915- evidence of lower humpback #’s 1962-3: ~3400 humpbacks harvested

10
Not Present vs Not Noticed Cook’s log = 0 Early writings = 0 Petroglyphs = 0 Chants = 0 Vocabulary = 1 Legends, myths = 0 Diety = 0 Ceremonies = 0 Rituals = 0 Artifacts = 0 Viewing sites Boat contact Tail slapping Breaching Lahaina = capital Night singing Beachings

11
What caused the appearance? Not food Rx to disruptive relocation? Natural meandering? Changes in oceanographic conditions?

12
Deep 7 Management

13
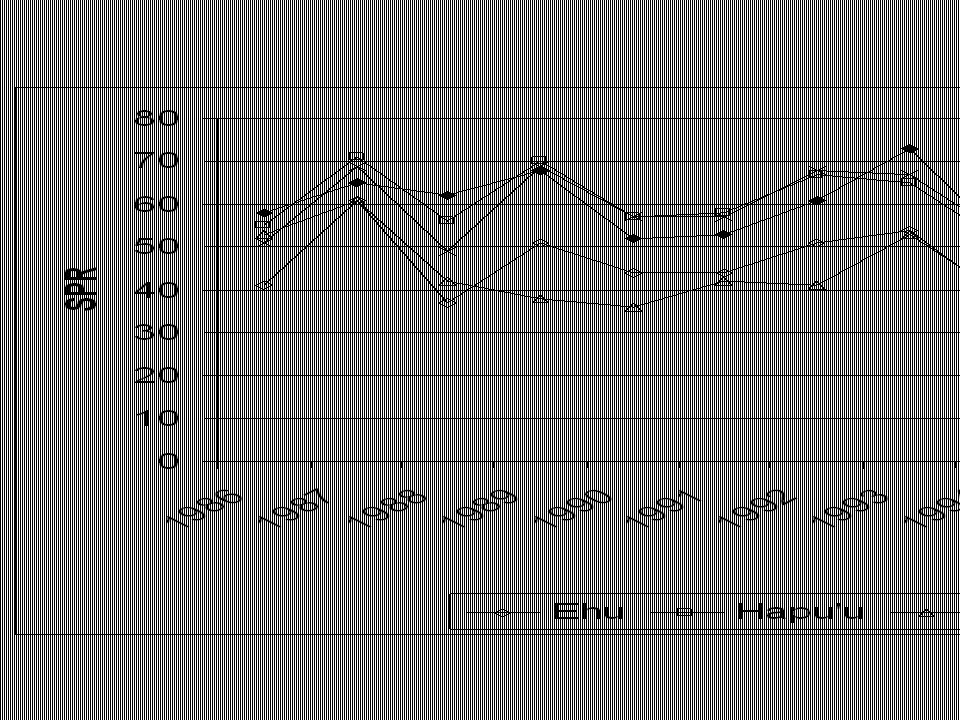
Bottomfish Fish Species Bottomfish Onaga Ehu Opakapaka Kalekale Uku Hapu‘upu‘u Gindai Lehi Butaguchi Ta‘ape White Ulua Affected by closure Onaga Ehu Kalekale Opakapaka Gindai Hapu‘upu‘u Lehi

14
Closure May 15 – Oct 31 + ?? (Year by Year) MHI Deep 7 Species Prohibited: Fish for, Possess, Sell Release Incidental Catch
 MHI Deep 7 Species Prohibited: Fish for, Possess, Sell Release Incidental Catch.")
15
Shafer-style Management F- ratio (CFM / FM@SY) Weighted for 3 zones CPUE based on gear used over time Weighted for habitat in 3 zones

16
Biology of these Fishes Spawning Early life history Settlement Age at maturity Long life span Slow growth rates

21
Chef Responses Said customers are willing to pay more for Hawaii-caught bottomfish 42.8 Said customers are not willing to pay more for Hawaii-caught bottomfish 19 Said customers expect Hawaii-caught bottomfish to be less expensive in Hawaii relative to other fish dishes 9.5 Named bottomfish on list of “most desirable fish species”77.3 Average percentage of meals that are fish48.6 Average percentage of fish meals that are bottomfish26.5 Average price of Hawaii-caught bottomfish dish$29.52 Average price of an imported bottomfish dish$28.46 Average portion size of a bottomfish dish6.78 oz Average product yield of whole fish (usefulness increases if stock made) 50% Average days last month with bottomfish on menu26.8 Average days last year with bottomfish on menu325.4 Average percentage customers who are visitors to Hawaii40.7% Percentage of Wholesalers Interviewed Said MHI are better in quality than NWHI bottomfish100 Said NWHI and imported bottomfish are comparable in quality33 Said imported better than NWHI bottomfish33
 50% Average days last month with bottomfish on menu26.8 Average days last year with bottomfish on menu325.4 Average percentage customers who are visitors to Hawaii40.7% Percentage of Wholesalers Interviewed Said MHI are better in quality than NWHI bottomfish100 Said NWHI and imported bottomfish are comparable in quality33 Said imported better than NWHI bottomfish33")
26
Current Status of Bottomfish in Hawaii’s Management Subareas Zone CPUE Ratio (current/MSY) Effort Ratio (current/MSY) ThresholdAbove 0.7Below 1.0 Hawaii, all areas combined 0.821.13 MHI0.471.88 Mau Zone1.010.96 Ho’omalu Zone1.130.39
 Effort Ratio (current/MSY) ThresholdAbove 0.7Below 1.0 Hawaii, all areas combined MHI Mau Zone Ho’omalu Zone")
27
More Information Moffitt, et al., 2006. Status of the Hawaiian Bottomfish Stocks, 2004. PIFSC Admin. Report H-06-01. http://www.pifsc.noaa.gov/adminrpts/2000- present/PIFSC_Admin_Rpt_06-01.pdf

Similar presentations


>")
 - 2003 Wayne Wakeland 1, Olgay Cangur 1, Guillermo.>")


 under the MSFD was defined as “Populations of all commercially exploited fish and shellfish.>")


