Download presentation
Presentation is loading. Please wait.

1
Ch.20: Trading with the World Trends in the Volume of Trade –In 1960, United States exported 3.5% of GDP imported 4.0% percent of GDP –In 2007, United States exported 11.9% of GDP. imported 17.0% of GDP.

2
Composition of Trade Trade in Goods –Manufactured goods 55% of U.S. imports 68% of U.S. exports. –Raw materials and semi-manufactured materials 14% of U.S. exports 15 % of U.S. imports. –Largest export item from the United States is capital goods –Largest import item is automobiles.

3
U.S. Trading Partners RankCountry Exports (Year- to-Date) Imports (Year- to-Date) Total Trade (Year-to-Date) Percent of Total Trade --- Total, All Countries1,001.901,629.002,630.90100.00% --- Total, Top 15 Countries685.61,176.401,862.0070.80% 1Canada203265.3468.417.80% 2China55250.4305.411.60% 3Mexico114.5166.5281.110.70% 4Japan51.6107.9159.56.10% 5 Federal Republic of Germany41.775.1116.84.40% 6 United Kingdom42.345.387.73.30% 7Korea, South27.636.764.32.40% Year-to-date, September 2008. source http://www.census.gov/foreign-trade/statistics/highlights/top/top0809yr.htmlhttp://www.census.gov/foreign-trade/statistics/highlights/top/top0809yr.html
 Imports (Year- to-Date) Total Trade (Year-to-Date) Percent of Total Trade --- Total, All Countries1, , , % --- Total, Top 15 Countries685.61, , % 1Canada % 2China % 3Mexico % 4Japan % 5 Federal Republic of Germany % 6 United Kingdom % 7Korea, South % Year-to-date, September source")
4
Net Exports and International Borrowing Net exports (NX)= exports - imports –In 2007, U.S. net exports = -$712 billion U.S. had a trade deficit. –Trade deficit (NX<0) country borrows from foreign countries or sells some of its assets (net borrower). –Trade surplus (NX>0) country lends to foreign countries or buys some of their assets (net lender).
 country borrows from foreign countries or sells some of its assets (net borrower). –Trade surplus (NX>0) country lends to foreign countries or buys some of their assets (net lender)..")
5
U.S. Trade Balance (Monthly): 1990-2008
:")
6
The Law of Comparative Advantage Nations can increase consumption of goods and services when they allocate resources to the production of those goods and services for which they have a comparative advantage Trade for the goods they do not have comparative advantage in.

7
Gains from International Trade The Law of Comparative Advantage: –Nations can increase consumption of goods and services when they allocate resources to the production of those goods and services for which they have a comparative advantage Trade for the goods they do not have comparative advantage in.

8
If without trade, U.S. produces at point A and Canada produces at point B: - who has comparative advantage in corn? - who has comparative advantage in lumber? Tons of Corn Tons of Lumber A (slope=-10)B (slope=-5) U.S. PPF Canada PPF
B (slope=-5) U.S. PPF Canada PPF.")
9
The Gains from Trade The Gains from Trade: Cheaper to Buy Than to Produce –In U.S., 1 lumber costs 10 corn 1 corn costs 1/10 lumber –In Canada 1 lumber costs 5 corn 1 corn costs 1/5 lumber –Corn is cheaper in U.S. –Lumber is cheaper in Canada

10
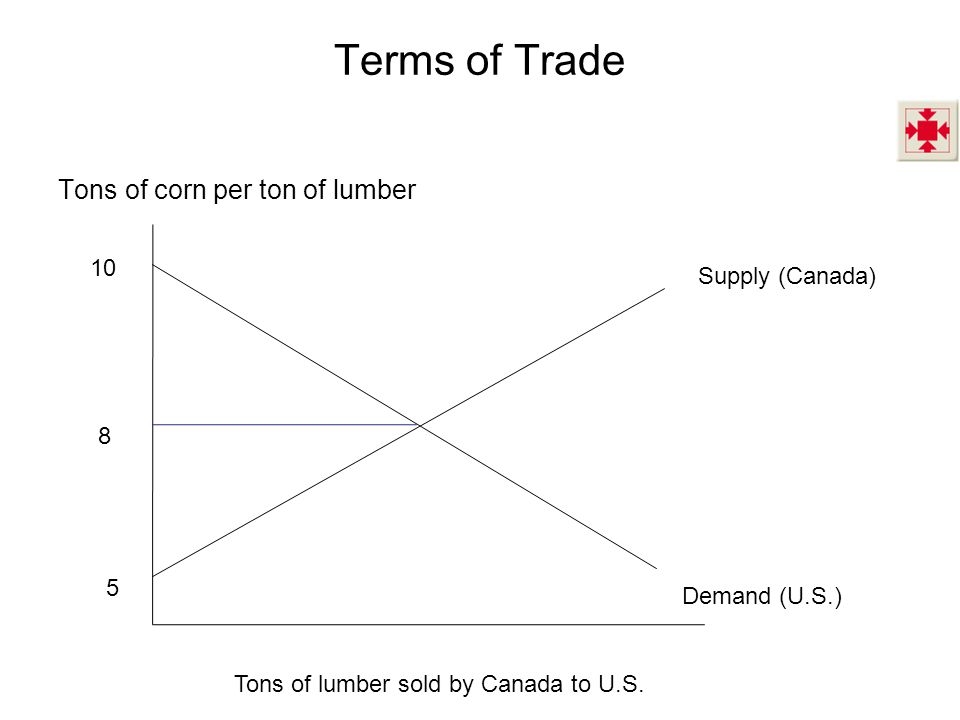
Terms of Trade Tons of corn per ton of lumber Supply (Canada) Demand (U.S.) Tons of lumber sold by Canada to U.S. 5 10 8
11
The Gains from Trade At mutually agreeable exchange rate: –U.S. buys lumber at a lower price than it would pay domestically, and sells corn at a higher price. –Canada buys corn at a lower price than it would pay domestically, and sells its lumber at a higher price. Both countries gain from trade. Opposition to trade? –Farm vs. lumber industry in U.S.? –Farm vs. lumber industry in Canada?

12
If terms of trade yields 8 tons corn per ton of lumber, both countries produce at a tangency with terms of trade line, and trade to move along consumption possibilities curve (CPC) Tons of Corn Tons of Lumber B (slope=-5) U.S. PPF Canada PPF CPC (slope=-8) A (slope=-10)
 A (slope=-10).")
13
International Trade Restrictions (Import) Tariff –Tax imposed by the importing country on imports. Non-tariff barrier –any action other than a tariff that restricts international trade Quotas Regulatory standards

14
The History of Tariffs

15
Sample tariff rates (2004) ProductGeneral Tarriff Rate (does not apply to Mexico or Canada) Roses46.8% Grapefruit$.019/kg Bicycles11% Trucks25% Cars2.5% Fax machines0% Tariff rates (Harmonized tarriff schedule) is nearly 3000 pages.
 ProductGeneral Tarriff Rate (does not apply to Mexico or Canada) Roses46.8% Grapefruit$.019/kg Bicycles11% Trucks25% Cars2.5% Fax machines0% Tariff rates (Harmonized tarriff schedule) is nearly 3000 pages.")
16
International Trade Restrictions General Agreement on Tariffs and Trade (GATT) –agreement between nations to have a series of trade negotiations, or “rounds,” to reduce tariffs on international trade. U.S. joined GATT in 1947. Subsequent rounds of GATT resulted in gradual decline in the average tariff rate in the United States

17
International Trade Restrictions The Uruguay round was the most ambitious and led to the creation of the World Trade Organization (WTO). The U.S. joined WTO in 1994. WTO membership brings greater obligations to follow GATT rules governing trade.

18
International Trade Restrictions NAFTA signed in 1994 –U.S., Canada, Mexico –trade barriers between Canada, Mexico and the U.S. are being lowered. European Union (EU) established in 1993 –organization of 27 countries that have agreed to eliminate trade barriers among them. Asia-Pacific Economic group (APEC) –agreement to reduce trade barriers among East Asian countries, including China.
 established in 1993 –organization of 27 countries that have agreed to eliminate trade barriers among them. Asia-Pacific Economic group (APEC) –agreement to reduce trade barriers among East Asian countries, including China..")
19
International Trade Restrictions CAFTA signed in 2004 –U.S. + Central America –Gradually eliminates or reduces trade restrictions

20
Types of Trade Restrictions Barriers to trade –Tariff –Quota –Voluntary export restraint (VER)
")
21
Effect of Tariff a.Price, output b.Producer surplus. c.Consumer surplus d.Tariff revenue. e.Excess burden of tax (deadweight loss).
..")
22
Effect of quota price, quantity. Consumer surplus Producer surplus Importer Deadweight loss A quota vs. tariff: importer profits but no tax revenue for govt. A VER is similar to a quota except that the exporter captures the economic profit.

23
Arguments for protection Protect national security Protect infant industries –How long? –How defined? Punish “dumping” –How defined? –Beneficiaries of dumping? Saves jobs –Costs other jobs

24
Arguments for protection –Brings diversity and stability to our economy At a cost Other ways to stabilize. –Penalizes nations with lax environmental standards or poor human rights records Our choice or theirs? –Prevents rich nations from exploiting poor ones What is “exploitation”?

25
Why Is International Trade Restricted? 2 key reasons for trade restrictions – Tariff revenue Relatively cheap to collect taxes on international transactions because international trade is carefully monitored. especially attractive to governments in developing nations. – Rent seeking lobbying and other political activities that seek to capture the gains from trade. Concentrated gains, widely dispersed losses

Similar presentations


