Download presentation
Presentation is loading. Please wait.

1
Luminescence is rare in nonaromatic hydrocarbons. Possible if highly conjugated due to – * transitions. Seyhan Ege, Organic Chemistry, D.C. Heath and Company, Lexington, MA, 1989. Nonaromatic Unsaturated Hydrocarbons

2
Aromatic Hydrocarbons Ingle and Crouch, Spectrochemical Analysis Low lying – * singlet state Fluorescent Phosphorescence is weak because there are no n electrons

3
Heterocyclic Aromatics Skoog, Hollar, Nieman, Principles of Instrumental Analysis, Saunders College Publishing, Philadelphia, 1998. Aromatics containing carbonyl or heteroatoms are more likely to phosphoresce n – * promotes intersystem crossing. Fluorescence is often weaker.

4
Aromatic Substituents Ingle and Crouch, Spectrochemical Analysis Electron donating groups usually increase F. Electron donating groups usually increase F. Electron withdrawing groups usually decrease F. Electron withdrawing groups usually decrease F.

5
Halogen Substituents Ingle and Crouch, Spectrochemical Analysis Internal Heavy Atom Effect Promotes intersystem crossing. F decreases as MW increases. P increases as MW increases. P decreases as MW increases.

6
Increased Conjugation Ingle and Crouch, Spectrochemical Analysis F increases as conjugation increases. P decreases as conjugation increases. Hypsochromic effect and bathochromic shift.

7
Rigid Planar Structure Skoog, Hollar, Nieman, Principles of Instrumental Analysis, Saunders College Publishing, Philadelphia, 1998. Ingle and Crouch, Spectrochemical Analysis F = 1.0 F = 0.2 F = 0.8 not fluorescent

8
Metals Skoog, Hollar, Nieman, Principles of Instrumental Analysis, Saunders College Publishing, Philadelphia, 1998. Metals other than certain lanthanides and actinides (with f-f transitions) are usually not themselves fluorescent. A number of organometallic complexes are fluorescent.
 are usually not themselves fluorescent. A number of organometallic complexes are fluorescent..")
9
Fluorescence and Phosphorescence FluorescencePhosphorescence … Labels/Tags 172925 … Dyes1061256 Which effect is used more regularly? SciFinder Scholar Citations www.wikipedia.org

10
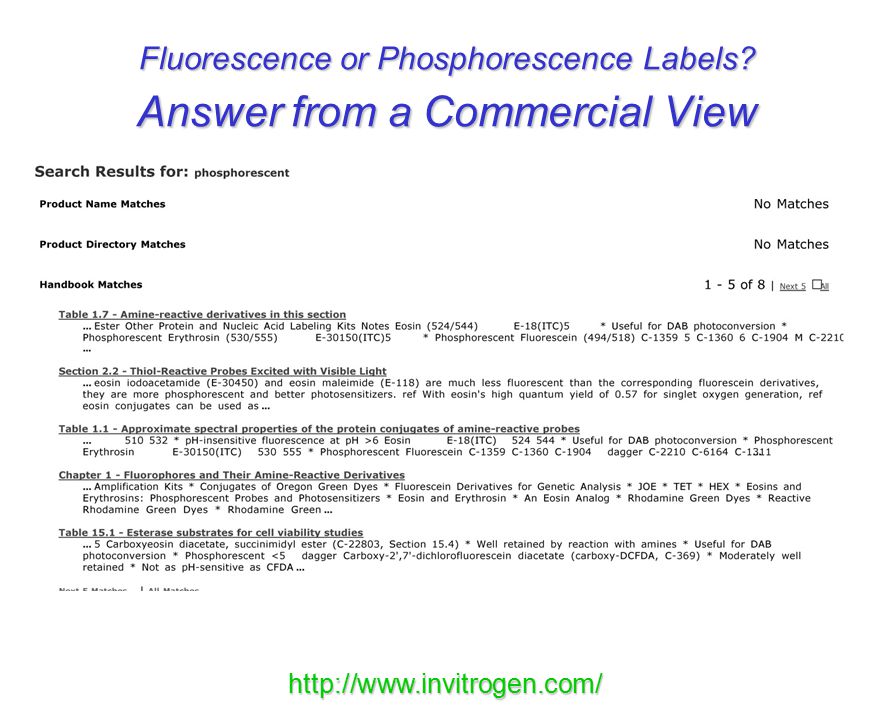
Fluorescence or Phosphorescence Labels? Answer from a Commercial View http://www.invitrogen.com/

11
http://www.invitrogen.com/
12
Fluorescence or Phosphorescence? Commercially Available Phosphorescence Labels Erythrosin derivative Eosin derivative http://www.invitrogen.com/

13
Fluorescence or Phosphorescence? Publications in Analytical Chemistry Fluorescence …Phosphorescence… 1380106 Phosphorescence is rarer than fluorescence => Higher selectivity. Phosphorescence is rarer than fluorescence => Higher selectivity. Phosphorescence: Analysis of aromatic compounds in environmental samples. Phosphorescence: Analysis of aromatic compounds in environmental samples.

14
Solvent Effects Increased viscosity can increase luminescence intensity. H-bonding and dipole interactions with the solvent contribute to the Stokes shift. Ashutosh Sharma and Stephen Schulman, Fluorescence Spectroscopy, John Wiley & Sons, New York, 1999. nonequilibrium excited state

15
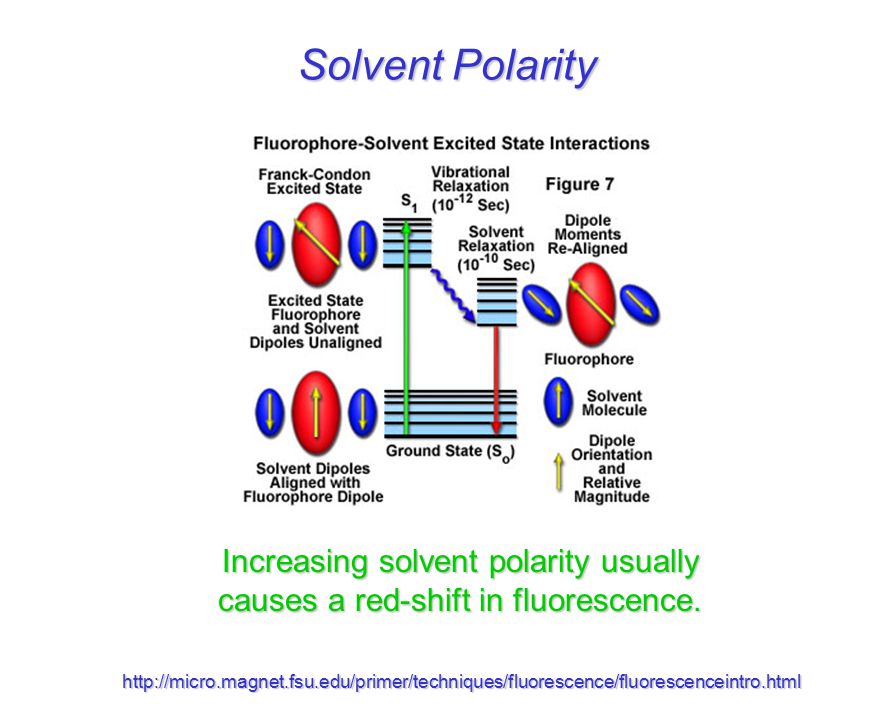
Solvent Polarity Increasing solvent polarity usually causes a red-shift in fluorescence. http://micro.magnet.fsu.edu/primer/techniques/fluorescence/fluorescenceintro.html
16
Solvent Polarity Joseph Lakowicz, Principles of Fluorescence Spectroscopy, Kluwer Academic / Plenum Publishers, New York, 1999.

17
Solvent Polarity Polar solvents can switch the lowest excited state from n - * to a - *. Polar solvents can switch the lowest excited state from n - * to a - *. H-bonding increases S 1 S 0 internal and external conversion, decreasing luminescence quantum yields. H-bonding increases S 1 S 0 internal and external conversion, decreasing luminescence quantum yields. Temperature Increased temperature usually decreases luminescence intensity. Increased temperature usually decreases luminescence intensity. More of an effect on phosphorescence. More of an effect on phosphorescence.

18
Temperature Joseph Lakowicz, Principles of Fluorescence Spectroscopy, Kluwer Academic / Plenum Publishers, New York, 1999. Increasing temperature increases k s

19
Joseph Lakowicz, Principles of Fluorescence Spectroscopy, Kluwer Academic / Plenum Publishers, New York, 1999. Decreasing temperature can induce a blue-shift in fluorescence.

20
Shpol’skii Spectroscopy Analytical potential of fluorescence spectroscopy often limited by unresolved band structure (5-50 nm)Analytical potential of fluorescence spectroscopy often limited by unresolved band structure (5-50 nm) homogeneous band broadening – depends directly on radiative deactivation properties of the excited state (usually 10 -3 nm)homogeneous band broadening – depends directly on radiative deactivation properties of the excited state (usually 10 -3 nm) inhomogeneous band broadening – various analyte microenvironments yields continuum of bands (usually few nm)inhomogeneous band broadening – various analyte microenvironments yields continuum of bands (usually few nm) Solution: Incorporate molecules in rigid matrix at low temperature to minimize broadeningSolution: Incorporate molecules in rigid matrix at low temperature to minimize broadening Result: Very narrow luminescence spectra with each band representing different substitution sites in the host crystalline matrixResult: Very narrow luminescence spectra with each band representing different substitution sites in the host crystalline matrix
Analytical potential of fluorescence spectroscopy often limited by unresolved band structure (5-50 nm) homogeneous band broadening – depends directly on radiative deactivation properties of the excited state (usually nm)homogeneous band broadening – depends directly on radiative deactivation properties of the excited state (usually nm) inhomogeneous band broadening – various analyte microenvironments yields continuum of bands (usually few nm)inhomogeneous band broadening – various analyte microenvironments yields continuum of bands (usually few nm) Solution: Incorporate molecules in rigid matrix at low temperature to minimize broadeningSolution: Incorporate molecules in rigid matrix at low temperature to minimize broadening Result: Very narrow luminescence spectra with each band representing different substitution sites in the host crystalline matrixResult: Very narrow luminescence spectra with each band representing different substitution sites in the host crystalline matrix")
21
Shpol’skii Spectroscopy Garrigues and Budzinski, Trends in Analytical Chemistry, 14 (5), 1995, pages 231-239. Requirements: 1.T < 77K with rapid freezing rate 2.Matrix with dimension match 3.Low analyte concentration Instrumentation: 1.Xe lamp excitation 2.Cryogenerator with sample cell 3.High resolution monochromator with PMT Analytes: polycyclic aromatic compounds in environmental, toxicological, or geochemical systems

22
Epi-Fluorescence Microscopy Light Source - Mercury or xenon lamp (external to reduce thermal effects) Light Source - Mercury or xenon lamp (external to reduce thermal effects) Dichroic mirror reflects one range of wavelengths and allows another range to pass. Dichroic mirror reflects one range of wavelengths and allows another range to pass. Barrier filter eliminates all but fluorescent light.Barrier filter eliminates all but fluorescent light. http://micro.magnet.fsu.edu/primer/techniques/fluorescence/fluorosources.html

23
Fluorescence Microscopy Need 3 filters: Exciter Filters Barrier Filters Dichromatic Beamsplitters http://microscope.fsu.edu/primer/techniques/fluorescence/filters.html

24
Are you getting the concept? You plan to excite catecholamine with the 406 nm line from a Hg lamp and measure fluorescence emitted at 470 ± 15 nm. Choose the filter cube you would buy to do this. Sketch the transmission profiles for the three optics. http://microscope.fsu.edu/primer/techniques/fluorescence/fluorotable3.html

25
Fluorescence Microscopy Objectives Image intensity is a function of the objective numerical aperture and magnification: Fabricated with low fluorescence glass/quartz with anti- reflection coatings http://micro.magnet.fsu.edu/primer/techniques/fluorescence/anatomy/fluoromicroanatomy.html

26
Fluorescence Microscopy Detectors No spatial resolution required: PMT or photodiode Spatial resolution required: CCD http://micro.magnet.fsu.edu/primer/digitalimaging/digitalimagingdetectors.html

27
Special Fluorescence Techniques TIRF http://microscopy.fsu.edu/primer/techniques/fluorescence/tirf/tirfintro.html LIF

Similar presentations

, but how to study in cells? Do rafts really exist in cells? Are.>")


 Spectroscopy Single-Beam or Double-Beam Fixed or Dispersive Common: Source – Tungsten Halogen Lamp (360-2000 nm) Sample.>")

 Identify m of real source and adjust T in to line up m 2) The ratio of: 3) Measure T w ( ) to calculate ( ) Ingle and Crouch,>")