Download presentation
Presentation is loading. Please wait.

2
Boosting Shai Raffaeli Seminar in mathematical biology http://www1.cs.columbia.edu/~freund/

3
Toy Example Computer receives telephone call Measures Pitch of voice Decides gender of caller Human Voice Male Female

4
Generative modeling Voice Pitch Probability mean1 var1 mean2 var2

5
Discriminative approach Voice Pitch No. of mistakes

6
Ill-behaved data Voice Pitch Probability mean1mean2 No. of mistakes

7
Traditional Statistics vs. Machine Learning Data Estimated world state Predictions Actions Statistics Decision Theory Machine Learning

9
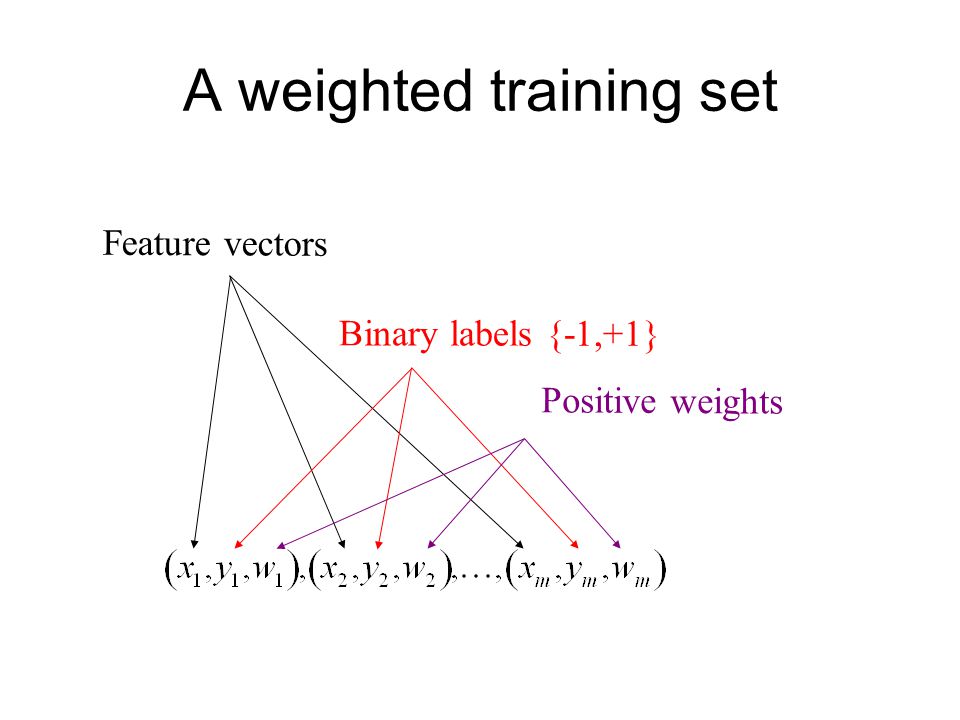
A weighted training set Feature vectors Binary labels {-1,+1} Positive weights

10
A weak learner weak learner A weak rule h Weighted training set (x1,y1,w1),(x2,y2,w2) … (xn,yn,wn) instances x1,x2,x3,…,xn h labels y1,y2,y3,…,yn The weak requirement: Feature vector Binary label Non-negative weights sum to 1
,(x2,y2,w2) … (xn,yn,wn) instances x1,x2,x3,…,xn h labels y1,y2,y3,…,yn The weak requirement: Feature vector Binary label Non-negative weights sum to 1")
11
The boosting process weak learner h1 (x1,y1,1/n), … (xn,yn,1/n) weak learner h2 (x1,y1,w1), … (xn,yn,wn) h3 (x1,y1,w1), … (xn,yn,wn) h4 (x1,y1,w1), … (xn,yn,wn) h5 (x1,y1,w1), … (xn,yn,wn) h6 (x1,y1,w1), … (xn,yn,wn) h7 (x1,y1,w1), … (xn,yn,wn) h8 (x1,y1,w1), … (xn,yn,wn) h9 (x1,y1,w1), … (xn,yn,wn) hT (x1,y1,w1), … (xn,yn,wn) Final rule: Sign [ ] h1 h2 hT
![The boosting process weak learner h1 (x1,y1,1/n), … (xn,yn,1/n) weak learner h2 (x1,y1,w1), … (xn,yn,wn) h3 (x1,y1,w1), … (xn,yn,wn) h4 (x1,y1,w1), … (xn,yn,wn) h5 (x1,y1,w1), … (xn,yn,wn) h6 (x1,y1,w1), … (xn,yn,wn) h7 (x1,y1,w1), … (xn,yn,wn) h8 (x1,y1,w1), … (xn,yn,wn) h9 (x1,y1,w1), … (xn,yn,wn) hT (x1,y1,w1), … (xn,yn,wn) Final rule: Sign [ ] h1 h2 hT ](http://images.slideplayer.com/16/4970395/slides/slide_11.jpg "The boosting process weak learner h1 (x1,y1,1/n), … (xn,yn,1/n) weak learner h2 (x1,y1,w1), … (xn,yn,wn) h3 (x1,y1,w1), … (xn,yn,wn) h4 (x1,y1,w1), … (xn,yn,wn) h5 (x1,y1,w1), … (xn,yn,wn) h6 (x1,y1,w1), … (xn,yn,wn) h7 (x1,y1,w1), … (xn,yn,wn) h8 (x1,y1,w1), … (xn,yn,wn) h9 (x1,y1,w1), … (xn,yn,wn) hT (x1,y1,w1), … (xn,yn,wn) Final rule: Sign [ ] h1 h2 hT ")
12
Adaboost Binary labels y = -1,+1 margin(x,y) = y [ t t h t (x)] P(x,y) = (1/Z) exp (-margin(x,y)) Given h t, we choose t to minimize (x,y) exp (-margin(x,y))
![Adaboost Binary labels y = -1,+1 margin(x,y) = y [ t t h t (x)] P(x,y) = (1/Z) exp (-margin(x,y)) Given h t, we choose t to minimize (x,y) exp (-margin(x,y))](http://images.slideplayer.com/16/4970395/slides/slide_12.jpg "Adaboost Binary labels y = -1,+1 margin(x,y) = y [ t t h t (x)] P(x,y) = (1/Z) exp (-margin(x,y)) Given h t, we choose t to minimize (x,y) exp (-margin(x,y))")
13
Adaboost Freund, Schapire 1997

14
Main property of adaboost If advantages of weak rules over random guessing are: T then in-sample error of final rule is at most

15
Adaboost as gradient descent Discriminator class: a linear discriminator in the space of “weak hypotheses” Original goal: find hyper plane with smallest number of mistakes –Known to be an NP-hard problem (no algorithm that runs in time polynomial in d, where d is the dimension of the space) Computational method: Use exponential loss as a surrogate, perform gradient descent.
 Computational method: Use exponential loss as a surrogate, perform gradient descent.")
16
Margins view Prediction = + - + + + + + + - - - - - - - w Correct Mistakes Project Margin Cumulative # examples MistakesCorrect Margin =

17
Adaboost et al. Loss Correct Margin Mistakes Brownboost Logitboost Adaboost = 0-1 loss

18
One coordinate at a time Adaboost performs gradient descent on exponential loss Adds one coordinate (“weak learner”) at each iteration. Weak learning in binary classification = slightly better than random guessing. Weak learning in regression – unclear. Uses example-weights to communicate the gradient direction to the weak learner Solves a computational problem

19
What is a good weak learner? The set of weak rules (features) should be flexible enough to be (weakly) correlated with most conceivable relations between feature vector and label. Small enough to allow exhaustive search for the minimal weighted training error. Small enough to avoid over-fitting. Should be able to calculate predicted label very efficiently. Rules can be “specialists” – predict only on a small subset of the input space and abstain from predicting on the rest (output 0).
 should be flexible enough to be (weakly) correlated with most conceivable relations between feature vector and label. Small enough to allow exhaustive search for the minimal weighted training error. Small enough to avoid over-fitting. Should be able to calculate predicted label very efficiently. Rules can be specialists – predict only on a small subset of the input space and abstain from predicting on the rest (output 0)..")
20
Decision Trees X>3 Y>5 +1 no yes no X Y 3 5 +1

21
-0.2 Decision tree as a sum X Y -0.2 Y>5 +0.2-0.3 yes no X>3 -0.1 no yes +0.1 -0.1 +0.2 -0.3 +1 sign

22
An alternating decision tree X Y +0.1-0.1 +0.2 -0.3 sign -0.2 Y>5 +0.2-0.3 yes no X>3 -0.1 no yes +0.1 +0.7 Y<1 0.0 no yes +0.7 +1 +1

23
Example: Medical Diagnostics Cleve dataset from UC Irvine database. Heart disease diagnostics (+1=healthy,-1=sick) 13 features from tests (real valued and discrete). 303 instances.
 13 features from tests (real valued and discrete). 303 instances..")
24
Adtree for Cleveland heart-disease diagnostics problem

25
Cross-validated accuracy Learning algorithm Number of splits Average test error Test error variance ADtree617.0%0.6% C5.02727.2%0.5% C5.0 + boostin g 44620.2%0.5% Boost Stumps 1616.5%0.8%

27
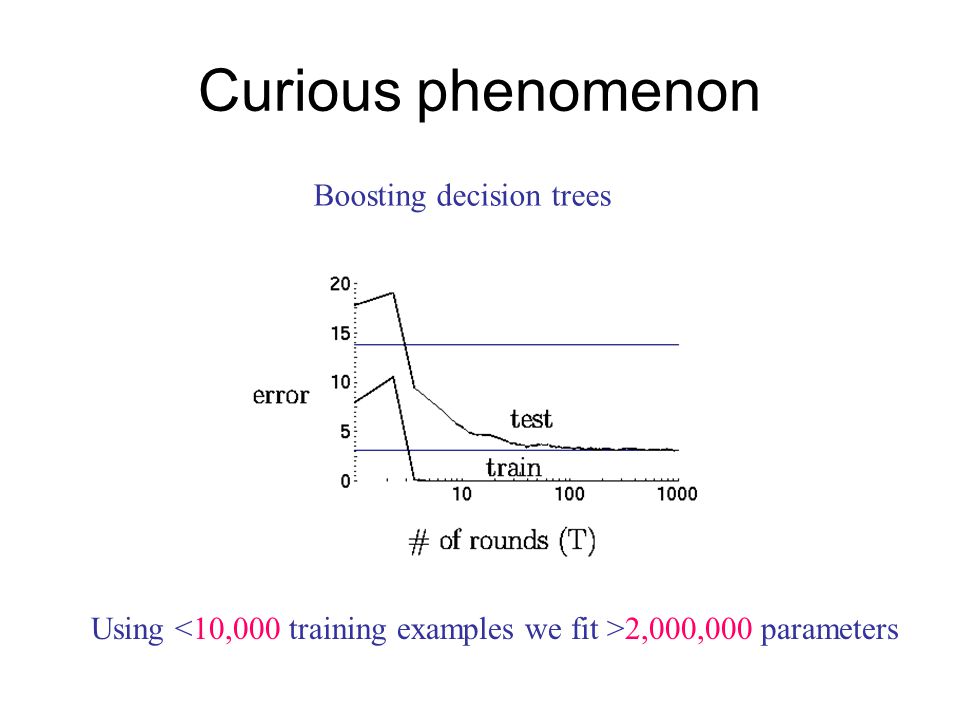
Curious phenomenon Boosting decision trees Using 2,000,000 parameters

28
Explanation using margins Margin 0-1 loss

29
Explanation using margins Margin 0-1 loss No examples with small margins!!

30
Experimental Evidence

31
Theorem For any convex combination and any threshold Probability of mistake Fraction of training example with small margin Size of training sample VC dimension of weak rules No dependence on number of weak rules of weak rules that are combined!!! Schapire, Freund, Bartlett & Lee Annals of stat. 98

32
Suggested optimization problem Margin

33
Idea of Proof

35
Applications of Boosting Academic research Applied research Commercial deployment

36
Academic research DatabaseOtherBoosting Error reduction Cleveland27.2 (DT)16.539% Promoter s 22.0 (DT)11.846% Letter13.8 (DT)3.574% Reuters 45.8, 6.0, 9.82.95~60% Reuters 811.3, 12.1, 13.47.4~40% % test error rates
16.539% Promoter s 22.0 (DT)11.846% Letter13.8 (DT)3.574% Reuters 45.8, 6.0, ~60% Reuters 811.3, 12.1, ~40% % test error rates")
37
Applied research “AT&T, How may I help you?” Classify voice requests Voice -> text -> category Fourteen categories Area code, AT&T service, billing credit, calling card, collect, competitor, dial assistance, directory, how to dial, person to person, rate, third party, time charge,time Schapire, Singer, Gorin 98

38
Yes I’d like to place a collect call long distance please Operator I need to make a call but I need to bill it to my office Yes I’d like to place a call on my master card please I just called a number in Sioux city and I musta rang the wrong number because I got the wrong party and I would like to have that taken off my bill Examples collect third party billing credit calling card

39
Calling card Collect call Third party Weak Rule Category Word occurs Word does not occur Weak rules generated by “boostexter”

40
Results 7844 training examples – hand transcribed 1000 test examples –hand / machine transcribed Accuracy with 20% rejected –Machine transcribed: 75% –Hand transcribed: 90%

41
Commercial deployment Distinguish business/residence customers Using statistics from call-detail records Alternating decision trees –Similar to boosting decision trees, more flexible –Combines very simple rules –Can over-fit, cross validation used to stop Freund, Mason, Rogers, Pregibon, Cortes 2000

42
Summary Boosting is a computational method for learning accurate classifiers Resistance to over-fit explained by margins Underlying explanation – large “neighborhoods” of good classifiers Boosting has been applied successfully to a variety of classification problems

43
DNA Measurable quantity Gene Regulation Regulatory proteins bind to non-coding regulatory sequence of a gene to control rate of transcription regulators mRNA transcript binding sites

44
From mRNA to Protein mRNA transcript Nucleus wall ribosome Protein folding Protein sequence

45
Protein Transcription Factors regulator

46
Genome-wide Expression Data

47
Microarrays measure mRNA transcript expression levels for all of the ~6000 yeast genes at once. Very noisy data Rough time slice over all compartments of many cells. Protein expression not observed

48
Partial “Parts List” for Yeast Many known and putative –Transcription factors –Signaling molecules that activate transcription factors –Known and putative binding site “motifs” –In yeast, regulatory sequence = 500 bp upstream region TFSM M TF TF M TF

49
Predict target gene regulatory response from regulator activity and binding site data Microarray Image R1R1 R2R2 RpRp R4R4 R3R3 ….. “Parent” gene expression G1G1 … Target gene expression G2G2 G3G3 G4G4 GtGt GeneClass: Problem Formulation G1G1 G2G2 G3G3 G4G4 GtGt Binding sites (motifs) in upstream region … M. Middendorf, A. Kundaje, C. Wiggins, Y. Freund, C. Leslie. Predicting Genetic Regulatory Response Using Classification. ISMB 2004.
 in upstream region … M. Middendorf, A. Kundaje, C. Wiggins, Y. Freund, C. Leslie. Predicting Genetic Regulatory Response Using Classification. ISMB")
50
Role of quantization +1 0 By Quantizing expression into three classes We reduce noise but maintain most of signal Weighting +1/-1 examples linearly with Expression level performs slightly better.

51
Problem setup Data point = Target gene X Microarray Input features: –Parent state {-1,0,+1} –Motif Presence {0,1} Predict output: –Target Gene {-1,+1}

52
Boosting with Alternating Decision Trees (ADTs) Use boosting to build a single ADT, margin- based generalization of decision tree Splitter Node Is Motif MIG1 present AND Parent XBP1 up? Prediction Node F(x) given by sum of prediction nodes along all paths consistent with x
 given by sum of prediction nodes along all paths consistent with x.")
53
Statistical Validation 10-fold cross-validation experiments, ~50,000 (gene/microarray) training examples Significant correlation between prediction score and true log expression ratio on held-out data. Prediction accuracy on +1/-1 labels: 88.5%

54
Biological Interpretation From correlation to causation Good prediction only implies Correlation. To infer causation we need to integrate additional knowledge. Comparative case studies: train on similar conditions (stresses), test on related experiments Extract significant features from learned model –Iteration score (IS): Boosting iteration at which feature first appears Identifies significant motifs, motif-parent pairs –Abundance score (AS): Number of nodes in ADT containing feature Identifies important regulators In silico knock-outs: remove significant regulator and retrain.
, test on related experiments Extract significant features from learned model –Iteration score (IS): Boosting iteration at which feature first appears Identifies significant motifs, motif-parent pairs –Abundance score (AS): Number of nodes in ADT containing feature Identifies important regulators In silico knock-outs: remove significant regulator and retrain..")
55
Case Study: Heat Shock and Osmolarity Training set: Heat shock, osmolarity, amino acid starvation Test set: Stationary phase, simultaneous heat shock+osmolarity Results: Test error = 9.3% Supports Gasch hypothesis: heat shock and osmolarity pathways independent, additive –High scoring parents (AS): USV1 (stationary phase and heat shock), PPT1 (osmolarity response), GAC1 (response to heat)
: USV1 (stationary phase and heat shock), PPT1 (osmolarity response), GAC1 (response to heat)")
56
Case Study: Heat Shock and Osmolarity Results: High scoring binding sites (IS): MSN2/MSN4 STRE element Heat shock related: HSF1 and RAP1 binding sites Osmolarity/glycerol pathways: CAT8, MIG1, GCN4 Amino acid starvation: GCN4, CHA4, MET31 –High scoring motif-parent pair (IS): TPK1~STRE pair (kinase that regulates MSN2 via cellular localization) – indirect effect TF M TF P P MpMp P MMpMp Direct bindingIndirect effectCo-occurrence
: MSN2/MSN4 STRE element Heat shock related: HSF1 and RAP1 binding sites Osmolarity/glycerol pathways: CAT8, MIG1, GCN4 Amino acid starvation: GCN4, CHA4, MET31 –High scoring motif-parent pair (IS): TPK1~STRE pair (kinase that regulates MSN2 via cellular localization) – indirect effect TF M TF P P MpMp P MMpMp Direct bindingIndirect effectCo-occurrence")
57
Case Study: In silico knockout Training and test sets: Same as heat shock and osmolarity case study Knockout: Remove USV1 from regulator list and retrain Results: –Test error: 12% (increase from 9%) –Identify putative downstream targets of USV1: target genes that change from correct to incorrect label –GO annotation analysis reveals putative functions: Nucleoside transport, cell-wall organization and biogenesis, heat-shock protein activity –Putative functions match those identified in wet lab USV1 knockout (Segal et al., 2003)
 –Identify putative downstream targets of USV1: target genes that change from correct to incorrect label –GO annotation analysis reveals putative functions: Nucleoside transport, cell-wall organization and biogenesis, heat-shock protein activity –Putative functions match those identified in wet lab USV1 knockout (Segal et al., 2003)")
58
Conclusions: Gene Regulation New predictive model for study of gene regulation –First gene regulation model to make quantitative predictions. –Using actual expression levels - no clustering. –Strong prediction accuracy on held-out experiments –Interpretable hypotheses: significant regulators, binding motifs, regulator-motif pairs New methodology for biological analysis: comparative training/test studies, in silico knockouts

59
Summary Boosting is an efficient and flexible method for constructing complex and accurate classifiers. Correlation -> Causation : still a hard problem, requires domain specific expertise and integration of data sources.

60
Improvement suggestions... Use of binary labels simplify the algorithm, but doesn’t reflect reality. “Confusion table”.

61
The End.

62
Large margins Thesis: large margins => reliable predictions Very similar to SVM.

63
Experimental Evidence

64
Theorem Schapire, Freund, Bartlett & Lee / Annals of statistics 1998 H: set of binary functions with VC-dimension d C No dependence on no. of combined functions!!!

65
Idea of Proof

Similar presentations


 Computer Science cpsc502, Lecture 15 Nov, 1, 2011 Slide credit: C. Conati, S.>")


