Download presentation
Presentation is loading. Please wait.

1
Global Strategy to Improve Agricultural Statistics ISI Satellite Conference on Agricultural Statistics Fred Vogel August 13, 2009

2
Purpose of the Strategy Provide the vision for a statistical system to support decision making requirements in the 21 st century Reflect data/information requirements –Policy –markets--investment Establish methodological framework for statistical capacity building

3
Purpose of the Presentation Provide an overview of the draft strategy –Key point is that the strategy is still under development—main purpose of this meeting is for more input Set the stage for the discussions to follow Provide the framework to reach agreement on the basic principles

4
Overview of the presentation Why need a global strategy? –Basic and emerging data requirements –Conceptual framework for agriculture –Assessment of current agricultural statistics Steps to develop the strategy Governance to meet strategic goals Data quality, capacity building, and the way forward

5
Crop production Forecasts And estimates Livestock Inventories And production Prices Stocks Aquaculture & Fishery Production Forestry Inventory & Production Basic Data Requirements Declining quantity and Quality of data, Or simply Not available

6
Food price Crises Global Economy Energy Costs Bio Fuels Agriculture’s Affect on The Environment Land and Water use Global warming Climate change Millennium Development Goals Emerging Data Requirements Happening at Same time, Are inter-related, Much data not available

7
Conceptual Framework— Agricultural production Natural Environment, (climate, soil, water) Output and Utilization Food, feed, seed, Fiber, Etc. Inputs to Production ( labor, capital, land, Feed, seed, Etc. ) Socio-economic, Political (Households, holdings’ enterprises Institutional Framework (Markets, government Global economy) Outcomes and Results ( National income, Food security) The production process (growing crops, raising livestock, Fish capture, timber removals)
 Socio-economic, Political (Households, holdings’ enterprises Institutional Framework (Markets, government Global economy) Outcomes and Results ( National income, Food security) The production process (growing crops, raising livestock, Fish capture, timber removals).")
8
Conceptual Framework Broaden scope to include forestry, fisheries Statistical units: Agriculture holding, household, and establishments Inclusion of rural and rural communities Scope includes production by households Land cover and use, Water use

9
Statistics—Current Status Declining response

10
Statistics—current status Declining number of countries reporting basic production Loss of statistical capacity Agriculture left out of National Strategies for Development of Statistics Duplicative efforts-conflicting numbers Forestry, fisheries outside national and agricultural systems

11
Statistics current status -The Dilemma – who does what National Statistics Offices Ministry – Departments of Agriculture Land Management/Natural Resources Agencies Marketing Boards/ Commissions Health, education agencies Development efforts by donors, WB Each Collects data for own use with results that do not always agree – and limited ability to share data

12
Assessment of Agricultural Statistics The assessment remains to be completed The scope of capacity building will depend on the assessment of the statistical system to meet the requirements of the global strategy

13
Steps to determine the strategy Develop a menu of indicators –FAO evaluations –World Bank/FAO Source Book of Indicators –FAO World Programme for Ag Census Identify a minimum sub set of core data items that meets most urgent data needs Determine additional national data needed Determine methodology, governance, capacity building needed

14
Menu of Indicators Meets basic and emerging requirements –Data to estimate each indicator, sources, –Technical notes/ classifications, etc –More than any one country can do annually Shows where indicators require overlapping data (crop production/ land/water use/ input use, etc.) Determine a minimum subset of core all countries agree to provide annually Evaluate national needs to select additional items, determine frequency
 Determine a minimum subset of core all countries agree to provide annually Evaluate national needs to select additional items, determine frequency")
15
Choice of Core About 15 major commodities account for over 95 percent of world production –Production, prices, trade,--balances –Value added, food security, productivity –Land, water use –Plus Forestry, aquaculture & fishery Major economic variables –Labor, household income, agricultural income inputs, demographics, consumption

16
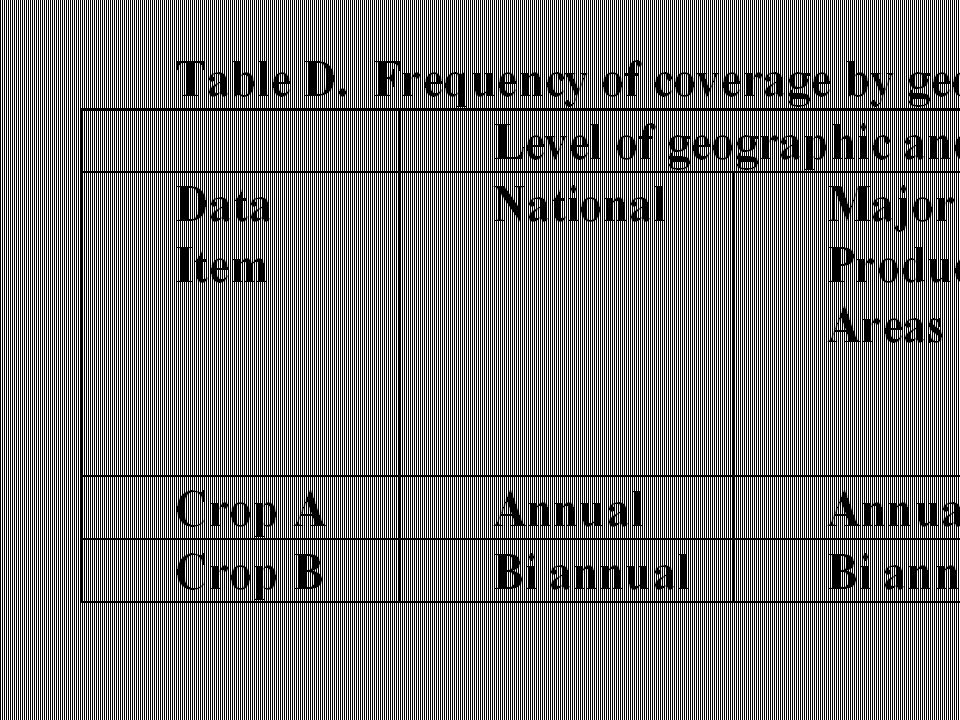
What add to national system? Provide ranking of items –Percent of land/water use –Percent value of production –Percent of HH/enterprises producing –Distributions by size –Scale—affect on environment, climate –Permanent or temporary

17
Lesson for international organizations requesting data. Base requests on country capability to meet annual vs less frequent data requirements.

18
How meet core and national requirements? Points to need to integrate agriculture into national statistical system Agreed upon set of methodology Governance to coordinate if have decentralized system

19
Global Strategy to Improve Agricultural Statistics Data requirements and Conceptual Framework Menu of indicators Minimum set of “core-national” Data items Integrate Agriculture into National statistics System Methodology to Integrate Agriculture Master Sample Frame Integrated Data Base Integrated Survey Framework Governance and Statistical Capacity Building

20
Census of Population And Housing Area Frame/ classified By land use via Remote sensing Rural HH Farm HH Ag Census Master Sampling Frame Developing the Master Sampling Frame Primary Sampling Units Villages/clusters Sample Grids points Geo reference Non Household Enterprises Census Enumeration areas

21
Integrated Survey Framework Master Sampling Frame (Population/agricultural census data Geo referenced to land use) Annual Survey(s) core & National Household holdings & enterprises Periodic surveys, (2-5 year cycles) Quarterly Semi- Annual Monthly Supply and utilization, income, & Environmental accounts, Food Balances, etc. Community Surveys Windshield Surveys Administrative Data Remote Sensing Agri businesses Integrated Data Bases

22
Integrated data bases Official statistics –Harmonized definitions and classifications –Each item appear one time; i.e. one official number for everything from population, GDP, to maize forecast or production. Micro data—long term view –Connect across surveys over time –Increase analytical capabilities

23
The governance challenge How coordinate efforts of Ministries of Agriculture, National Statistical Offices, and others? Who does what—Master sample frame, Integrated Survey Frame work, Integrated data base? Starting point—form a Statistical Council Build off strengths of each stakeholder –Technical expertise –Subject matter knowledge

24
The governance challenge Role of national organizations –Add agriculture (forestry and fisheries) to National Strategies for Development of Statistics –Focus fund raising on national statistical system Role of international organizations –Focus capacity building and support for statistics on overall national statistical system –Centers of excellence-statistics, remote sensing? Role of Donors –Work with Statistical Council instead of separate sectors

25
Challenges needing research Crop yield forecasts and estimates –Mult-cropping –Root crops –Use of remote sensing with ground truth Sampling and survey methodology for integrated survey framework Use of remote sensing to monitor land use- early warning capabilities Geo referencing survey data with satellite digitized frame

26
The global strategy and data quality for agriculture Data quality dimensions for agriculture –Accuracy—trade-off with timeliness –Timeliness-related to production cycle –Comparability across time and countries –Availability—Official data/ micro data Driven by needs of data users and customers

27
Capacity Building Challenge Building infrastructure—statisticians- data collectors, etc Education on statistical methodology, technology (GPS), remote sensing Date analysis—how to use the data to answer questions Build sustainable system
, remote sensing Date analysis—how to use the data to answer questions Build sustainable system")
28
The way forward National input—Min of AG, National Statistical Offices & other stakeholders –Review and update National Strategies for Development of Statistics International input from stakeholders –ISI Satellite meeting on agricultural statistics Develop final strategy for 2010 UNSC Develop Implementation Plan

29
Thank you

32
Census of Population And Housing Area Frame/ classified By land use via Remote sensing Rural HH Farm HH Ag Census Master Sampling Frame Developing the Master Sampling Frame Primary Sampling Units Villages/clusters Sample Grids points Geo reference Non Household Enterprises Census Enumeration areas

33
Census of Population And Housing Area Frame/ classified By land use via Remote sensing Rural HH Farm HH Ag Census Master Sampling Frame Developing the Master Sampling Frame Primary Sampling Units Villages/clusters Sample Grids points Geo reference Non Household Enterprises Census Enumeration areas

34
Census of Population And Housing Area Frame/ classified By land use via Remote sensing Rural HH Farm HH Ag Census Master Sampling Frame Developing the Master Sampling Frame Primary Sampling Units Villages/clusters Sample Grids points Geo reference Non Household Enterprises Census Enumeration areas

35
The Policy Challenge Agriculture primary source to feed and clothe a growing global population While doing so, must: –Raise millions out of poverty –Reduce agriculture’s affect on the environment and global warming –Sustain water and land resources Determine information needed to make policy decisions, monitor their effect

Similar presentations