Download presentation
Presentation is loading. Please wait.

1
Regulatory Network (Part II) 11/05/07
 11/05/07")
2
Methods Linear –PCA (Raychaudhuri et al. 2000) –NIR (Gardner et al. 2003) Nonlinear –Bayesian network (Friedman et al. 2000; Friedman 2004)
 Nonlinear –Bayesian network (Friedman et al. 2000; Friedman 2004).")
3
Cell-cycle network Data (Spellman et al. 1998) 76 arrays 7 time points 6177 yeast genes 800 cell-cycle related genes identified
 76 arrays 7 time points 6177 yeast genes 800 cell-cycle related genes identified.")
4
PCA Raychaudhuri et al. 2000

5
The PCA components identify the dominant modes of variation.

6
Limitations of PCA Does not directly associate regulators with their target genes. Alternatively, it can be interpreted as the network is fully connected. The expression of each gene is regulated by the linear combination of all other genes.

7
NIR Idea: The dynamics of gene activities can be approximated by gene expression levels approximately reach steady state. perturbation

8
NIR Solve for A This is unidentifiable since M << N. Add constraint that there are at most k- connections for any given gene (k < M). For each row, use multiple regression to find a linear combination of k-genes so that the least square error is minimal. #genes#perturbations
. For each row, use multiple regression to find a linear combination of k-genes so that the least square error is minimal. #genes#perturbations.")
9
Application of NIR repression activation Known E Coli SOS pathway

10
Application of NIR Regression coefficients

11
Limitation of NIR True dynamics is nonlinear. The choice of k is ad hoc. Steady state approximation does not apply to oscillatory genes.

12
Bayesian network Directed acyclic graph (DAG) Nodes: random variables Edges: direct effect --- conditional dependency Friedman 2004
 Nodes: random variables Edges: direct effect --- conditional dependency Friedman 2004")
13
An example EarthquakeBurglary Radio Alarm Call

14
This is not a Bayesian network A B C

15
A B C D E Tree: a special kind of DAG Each node has only one parent node.

16
Advantage Intuitive --- popular among biologists Graph structure is easy to interpret Well-established probabilistic tools for DAG models. Support all the features for probabilistic learning –Model selection criteria –Handling of missing data

17
Known Structure, complete data E B A.9.1 e b e.7.3.99.01.8.2 be b b e BEP(A | E,B) ?? e b e ?? ? ? ?? be b b e BE E B A Network structure is specified –Inducer needs to estimate parameters Data does not contain missing values Learner E, B, A. (Nir Friedman)
.")
18
Unknown Structure, Complete Data E B A.9.1 e b e.7.3.99.01.8.2 be b b e BEP(A | E,B) ?? e b e ?? ? ? ?? be b b e BE E B A Network structure is not specified –Inducer needs to select arcs & estimate parameters Data does not contain missing values E, B, A. Learner (Nir Friedman)
.")
19
Learning parameters E B A C Training data has the form:

20
Likelihood Function E B A C Assume i.i.d. samples Likelihood function is

21
Likelihood Function E B A C By definition of network, we get

22
Likelihood Function E B A C Rewriting terms, we get

23
General Bayesian Networks Generalization for any Bayesian network: Parameters can be estimated independently!

24
Bayesian Inference Represent uncertainty about parameters using a probability distribution over parameters, data Using Bayes rule Common prior distributions: –Dirichlet (discrete) –Normal (continuous)
 –Normal (continuous)")
25
Why Struggle for Accurate Structure? Increases the number of parameters to be estimated Wrong assumptions about domain structure Cannot be compensated for by fitting parameters Wrong assumptions about domain structure EarthquakeAlarm Set Sound Burglary EarthquakeAlarm Set Sound Burglary Earthquake Alarm Set Sound Burglary Adding an arc Missing an arc

26
Scorebased Learning E, B, A. E B A E B A E B A Search for a structure that maximizes the score Define scoring function that evaluates how well a structure matches the data G1G1 S(G 1 ) = 10S(G 2 ) = 1.5S(G 3 ) = 0.01 G2G2 G3G3
 = 10S(G 2 ) = 1.5S(G 3 ) = 0.01 G2G2 G3G3.")
27
Max likelihood params Structure Score Likelihood score: Bayesian score: –Average over all possible parameter values Likelihood Prior over parameters Marginal Likelihood

28
Search for Optimal Network Structure Start with a given network –empty network –best tree –a random network At each iteration –Evaluate all possible changes –Apply change based on score Stop when no modification improves score

29
Typical operations: S C E D Reverse C E Delete C E Add C D S C E D S C E D S C E D Search for Optimal Network Structure

30
Typical operations: S C E D Reverse C E Delete C E Add C D S C E D S C E D S C E D score = S({C,E} D) - S({E} D) Search for Optimal Network Structure At each iteration only need to score the site that is being updated !
 - S({E} D) Search for Optimal Network Structure At each iteration only need to score the site that is being updated !")
31
Structure Discovery Task: Discover structural properties –Is there a direct connection between X & Y –Does X separate between two “subsystems” –Does X causally effect Y Example: scientific data mining –Disease properties and symptoms –Interactions between the expression of genes

32
Discovering Structure –There may be many high scoring models –Answer should not be based on any single model –Want to average over many models E R B A C E R B A C E R B A C E R B A C E R B A C P(G|D)
")
33
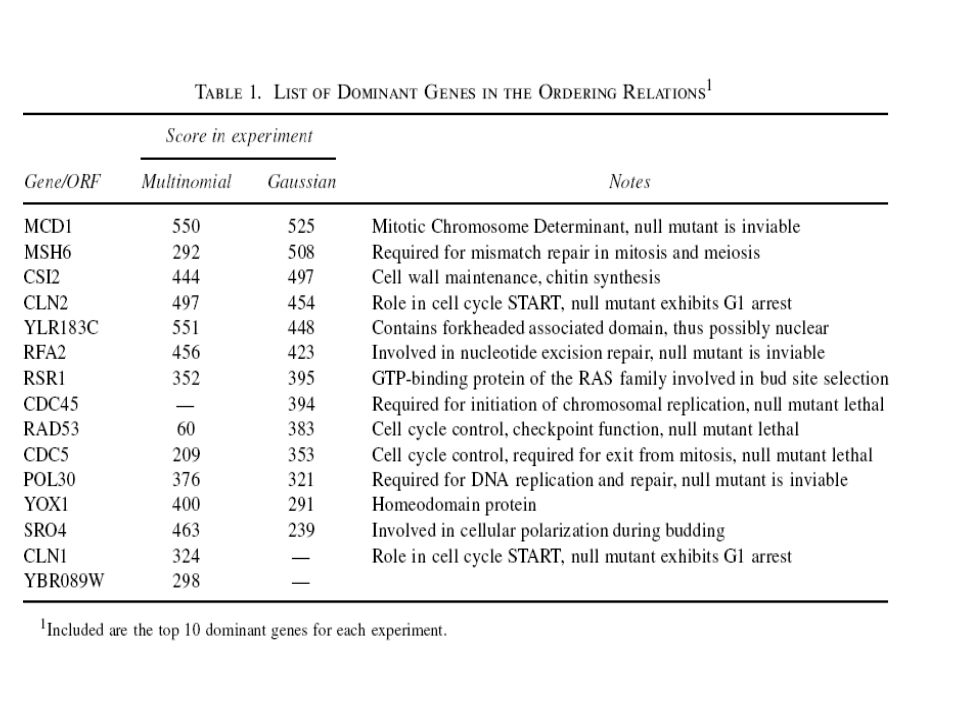
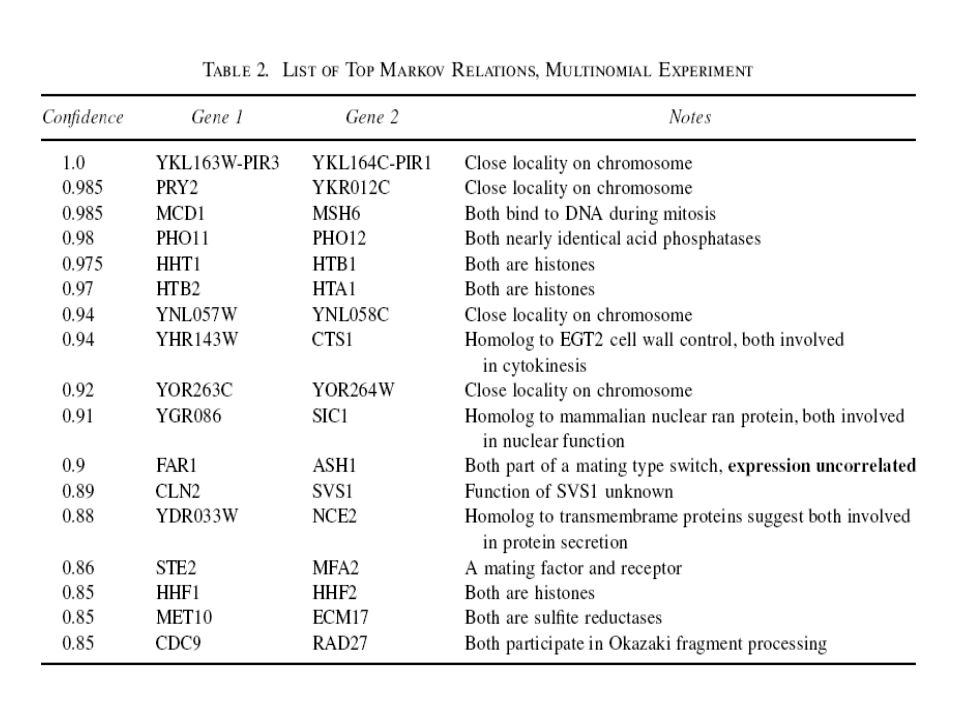
Cell-cycle network Friedman et al 2000

36
Limitations for Bayesian network Computationally costly –It is NP hard problem to identify the globally optimal network structure Heuristic approaches may be trapped to local maxima. Prior distribution for DAGs is tricky. In practice, failure to find more difficult network structures than cell-cycle data.

37
Equivalence of graphs When two DAGs can represent the same set of conditional independence assertions, we say that these DAGs are equivalent YZYZ Are these graphs equivalent?

38
X YZ X YZ

39
Therefore, the exact graph is unidentifiable!

40
Reading List Raychaudhuri et al. 2000 –Apply PCA to analyze gene expression Gardner et al. 2003 –Developed NIR to find regulatory network Friedman et al. 2000 –Applied Bayesian network to analysis cell- cycle network. Friedman 2004 –Review of probabilistic graphic models.

41
Acknowledgement Some of the slides are obtained from Nir Friedman

Similar presentations


 Daphne Koller (Stanford) Aviv Regev (Harvard) Nir Friedman.>")


 – Section 2.11>")


