Download presentation
Presentation is loading. Please wait.

1
C E N T R F O R I N T E G R A T I V E B I O I N F O R M A T I C S V U E Master Course Sequence Alignment Lecture 9 Database searching (3)
")
2
Dot-plots a simple way to visualise sequence similarity Can be a bit messy, though... Filter: 6/10 residues have to match...

3
Dot-plots, what about... Insertions/deletions -- DNA and proteins Duplications (e.g. tandem repeats) – DNA and proteins Inversions -- DNA Dot plots are calculated using a diagonal window of preset length that is slid through the search matrix -- typically the central cell holds the window score (e.g. sum, average)
 – DNA and proteins Inversions -- DNA Dot plots are calculated using a diagonal window of preset length that is slid through the search matrix -- typically the central cell holds the window score (e.g. sum, average).")
4
Dot-plots, self-comparison Direct repeat Tandem repeat Inverted repeat

5
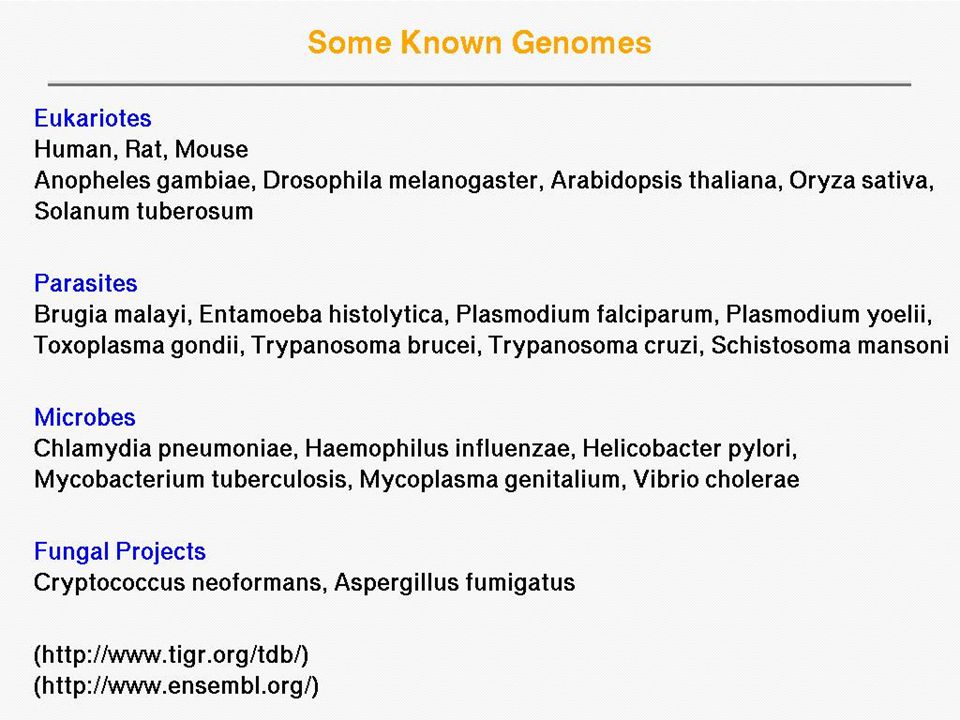
The amount of genetic information in organisms Name# genes 0.5 470 Escherichia coli 4.5 4400 12 5500 120 18000 97 22000 Homo sapiens 350023457 Zea mays 250050000 Genome size (Mb) Mycoplasma genitalium Saccharomyces cerevisiae Drosophila melanogaster Caenorhabtitis elegans
 Mycoplasma genitalium Saccharomyces cerevisiae Drosophila melanogaster Caenorhabtitis elegans")
8
charge

10
(cysteine bridge)
")
12
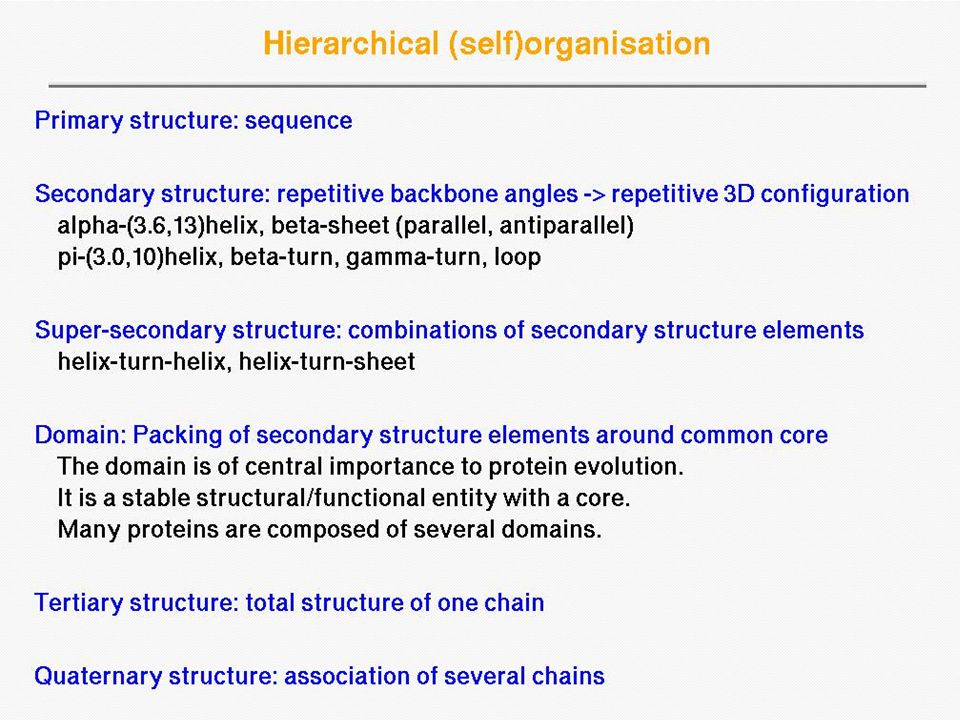
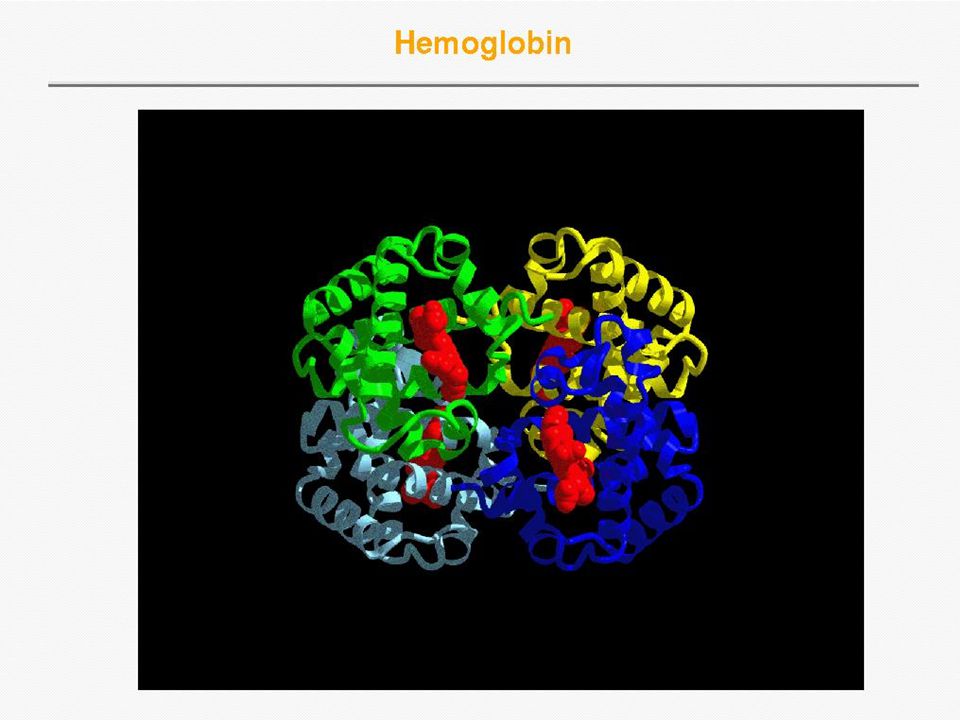
VHLTPEEKSAVTALWGKVNVDE VGGEALGRLLVVYPWTQRFFE SFGDLSTPDAVMGNPKVKAHG KKVLGAFSDGLAHLDNLKGTFA TLSELHCDKLHVDPENFRLLGN VLVCVLAHHFGKEFTPPVQAAY QKVVAGVANALAHKYH PRIMARY STRUCTURE (amino acid sequence) QUATERNARY STRUCTURE (oligomers) SECONDARY STRUCTURE (helices, strands) TERTIARY STRUCTURE (fold) Protein structure hierarchical levels
 QUATERNARY STRUCTURE (oligomers) SECONDARY STRUCTURE (helices, strands) TERTIARY STRUCTURE (fold) Protein structure hierarchical levels")
14
Globin fold protein myoglobin PDB: 1MBN Helices are labelled ‘A’ (blue) to ‘H’ (red). D helix can be missing in some globins: what happens with the alignment?

15
sandwich protein immunoglobulin PDB: 7FAB

16
TIM barrel / protein Triose phosphate IsoMerase PDB: 1TIM

17
Pyruvate kinase Phosphotransferase barrel regulatory domain barrel catalytic substrate binding domain nucleotide binding domain

18
What does this mean for alignment? Alignments need to be able to skip secondary structural elements to complete domains (i.e. putting gaps opposite these motifs in the shorter sequence). Depending on gap penalties chosen, the algorithm might have difficulty with making such long gaps (for example when using high affine gap penalties), resulting in incorrect alignment.
. Depending on gap penalties chosen, the algorithm might have difficulty with making such long gaps (for example when using high affine gap penalties), resulting in incorrect alignment..")
19
What does this mean for homology searching? Database searching algorithms just need to decide if the alignment score is good enough for inferring homology Sometimes, alignments can be incorrect but the score can be close enough for the database searching method to correctly identify the DB sequence as a homolog (or not) However, for distant hits alignments become crucial
 However, for distant hits alignments become crucial.")
21
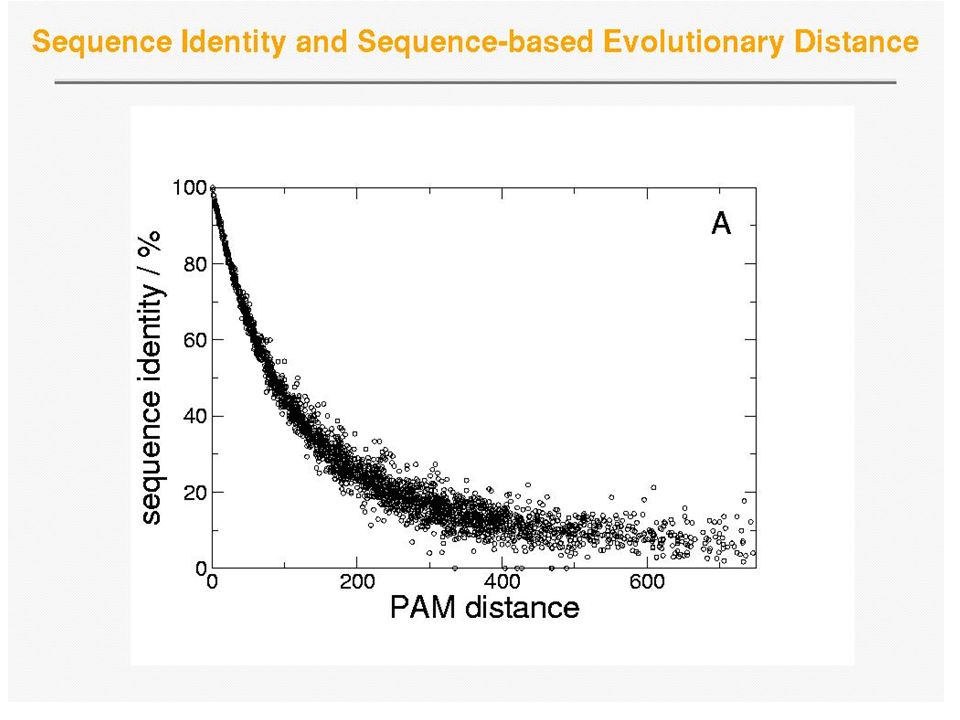
Sequence Analysis/Database Searching Finding relationships between genes and gene products of different species, including those at large evolutionary distances

25
Compared to the preceding plot, RMSD is better able to pin-point relationships between more divergent sequences (RMSD stays relatively small for a longer time as compared to PAM distance) – Structure more conserved than sequence. Note that the spread around RMSD is larger

26
Structural superpositioning RMSD: how far are equivalenced Cα atoms separated on average?

27
C5 anaphylatoxin -- human (PDB code 1kjs) and pig (1c5a)) proteins are superposed Two superposed protein structures with two well- superposed helices Red: well superposed Blue: low match quality
 and pig (1c5a)) proteins are superposed Two superposed protein structures with two well- superposed helices Red: well superposed Blue: low match quality")
29
How to assess homology search methods We need an annotated database, so we know which sequences belong to what homologous (super)families Examples of databases of homologous families are PFAM, Homstrad or Astral The idea is to take a protein sequence from a given homologous family, then run the search method, and then assess how well the method has carried out the search This should be repeated for many query sequences and then the overall performance can be measured
families Examples of databases of homologous families are PFAM, Homstrad or Astral The idea is to take a protein sequence from a given homologous family, then run the search method, and then assess how well the method has carried out the search This should be repeated for many query sequences and then the overall performance can be measured")
30
C; family: zinc finger -- CCHH-type C; class: small C; reordered by kitschorder 1.0a C; reordered by kitschorder 1.0a C; last update 7/9/98 >P1;1zaa1 structureX:1zaa: 3 :C: 33 :C:zinc-finger (ZIF268, domain 1):Mus musculus:2.10:18.20 ------RPYACPVESCDRRFSRSDELTRHI-RI-HTGQK* >P1;1zaa2 structureX:1zaa: 34 :C: 61 :C:zinc-finger (ZIF268, domain 2):Mus musculus:2.10:18.20 -------PFQCRI--CMRNFSRSDHLTTHI-RT-HTGEK* >P1;1zaa3 structureX:1zaa: 62 :C: 87 :C:zinc-finger (ZIF268, domain 3):Mus musculus:2.10:18.20 -------PFACDI--CGRKFARSDERKRHT-KI-HLR--* >P1;1ard structureN:1ard: 102 : : 130 : :zinc-finger (transcription factor ADR1):Saccharomyces cerevisiae:-1.00:-1.00 ------RSFVCEV--CTRAFARQEHLKRHY-RS-HTNEK* >P1;1znf structureN:1znf: 1 : : 25 : :zinc-finger (XFIN, 31st domain):Xenopus laevis:-1.00:-1.00 --------YKCGL--CERSFVEKSALSRHQ-RV-HKN--* >P1;2drp2 structureX:2drp: 137 :A: 165:A:zinc-finger (tramtrack, domain 2):Drosophila melanogaster:2.80:19.30 ----NVKVYPCPF--CFKEFTRKDNMTAHV-KIIHK---* >P1;3znf structureN:3znf: 1 : : 30 : :zinc-finger (enhancer binding protein):Homo sapiens:-1.00:-1.00 ------RPYHCSY--CNFSFKTKGNLTKHMKSKAHSKK-* >P1;5znf structureN:5znf: 1 : : 30 : :zinc-finger (ZFY-6T):Homo sapiens:-1.00:-1.00 ------KTYQCQY--CEYRSADSSNLKTHIKTK-HSKEK* Example You can also look at superposed structures..
:Mus musculus:2.10: RPYACPVESCDRRFSRSDELTRHI-RI-HTGQK* >P1;1zaa2 structureX:1zaa: 34 :C: 61 :C:zinc-finger (ZIF268, domain 2):Mus musculus:2.10: PFQCRI--CMRNFSRSDHLTTHI-RT-HTGEK* >P1;1zaa3 structureX:1zaa: 62 :C: 87 :C:zinc-finger (ZIF268, domain 3):Mus musculus:2.10: PFACDI--CGRKFARSDERKRHT-KI-HLR--* >P1;1ard structureN:1ard: 102 : : 130 : :zinc-finger (transcription factor ADR1):Saccharomyces cerevisiae:-1.00: RSFVCEV--CTRAFARQEHLKRHY-RS-HTNEK* >P1;1znf structureN:1znf: 1 : : 25 : :zinc-finger (XFIN, 31st domain):Xenopus laevis:-1.00: YKCGL--CERSFVEKSALSRHQ-RV-HKN--* >P1;2drp2 structureX:2drp: 137 :A: 165:A:zinc-finger (tramtrack, domain 2):Drosophila melanogaster:2.80: NVKVYPCPF--CFKEFTRKDNMTAHV-KIIHK---* >P1;3znf structureN:3znf: 1 : : 30 : :zinc-finger (enhancer binding protein):Homo sapiens:-1.00: RPYHCSY--CNFSFKTKGNLTKHMKSKAHSKK-* >P1;5znf structureN:5znf: 1 : : 30 : :zinc-finger (ZFY-6T):Homo sapiens:-1.00: KTYQCQY--CEYRSADSSNLKTHIKTK-HSKEK* Example You can also look at superposed structures..")
31
Sequence searching QUERY DATABASE True Positive True Negative True Positive False Positive True Negative False Negative T POSITIVES NEGATIVES

32
So what have we got TP TN FP FN Observed Predicted P P N N

33
Sensitivity and Specificity – medical world + - Test Test + 9990 True Positive (TP) 990 False Positive (FP) All with Positive Test TP+FP Positive Predictive Value= TP/(TP+FP) 9990/(9990+990) =91% - 10 False Negative (FN) 989,010 True Negative (TN) All with Negative Test FN+TN Negative Predictive Value= TN/(FN+TN) 989,010/(10+989,0 10) =99.999% All with Disease 10,000 All without Disease 999,000 Everyone= TP+FP+FN+TN Sensitivity= TP/(TP+ FN) 9990/(99 90+10) Specificity= TN/(FP+TN) 989,010/ (989,010+99 0) Pre-Test Probability= (TP+FN)/(TP+FP+FN+TN) (in this case = prevalence) 10,000/1,000,000 = 1%
 990 False Positive (FP) All with Positive Test TP+FP Positive Predictive Value= TP/(TP+FP) 9990/( ) =91% - 10 False Negative (FN) 989,010 True Negative (TN) All with Negative Test FN+TN Negative Predictive Value= TN/(FN+TN) 989,010/(10+989,0 10) =99.999% All with Disease 10,000 All without Disease 999,000 Everyone= TP+FP+FN+TN Sensitivity= TP/(TP+ FN) 9990/( ) Specificity= TN/(FP+TN) 989,010/ (989, ) Pre-Test Probability= (TP+FN)/(TP+FP+FN+TN) (in this case = prevalence) 10,000/1,000,000 = 1%")
34
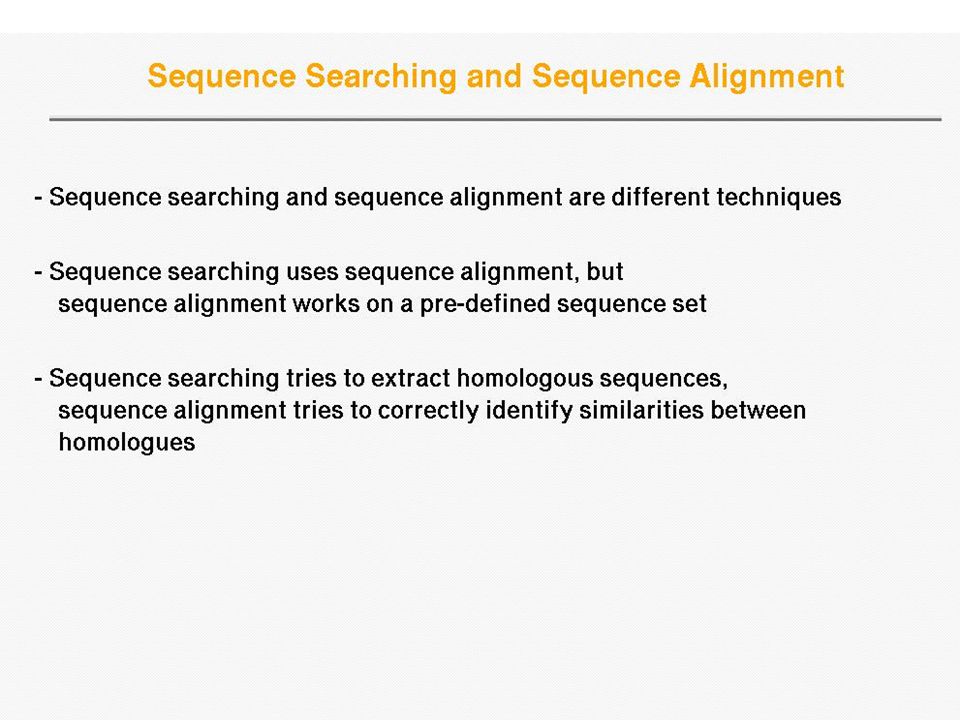
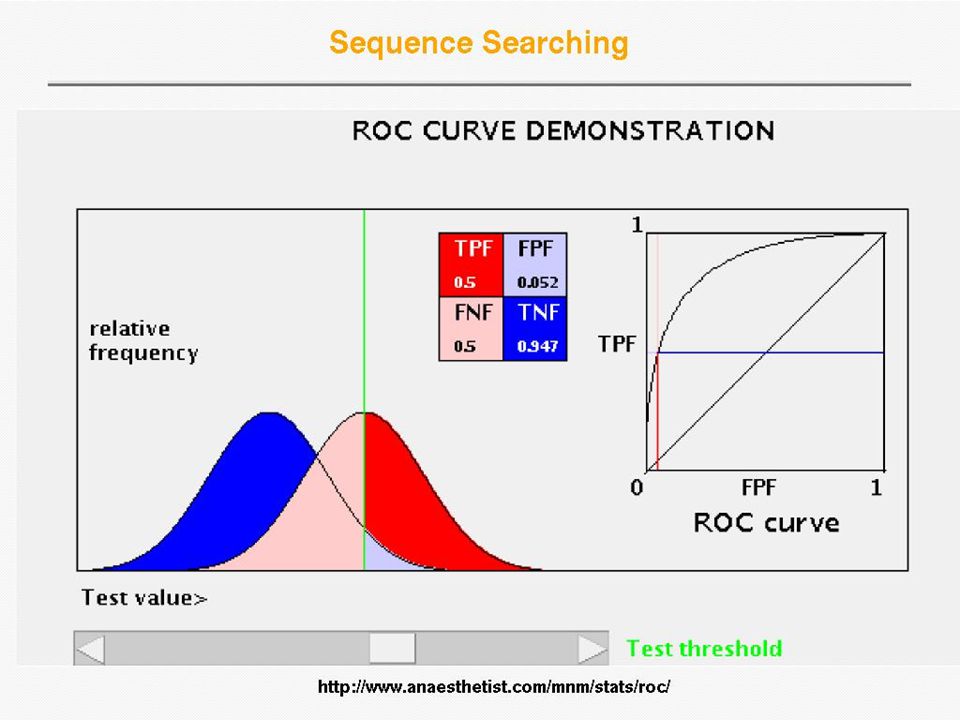
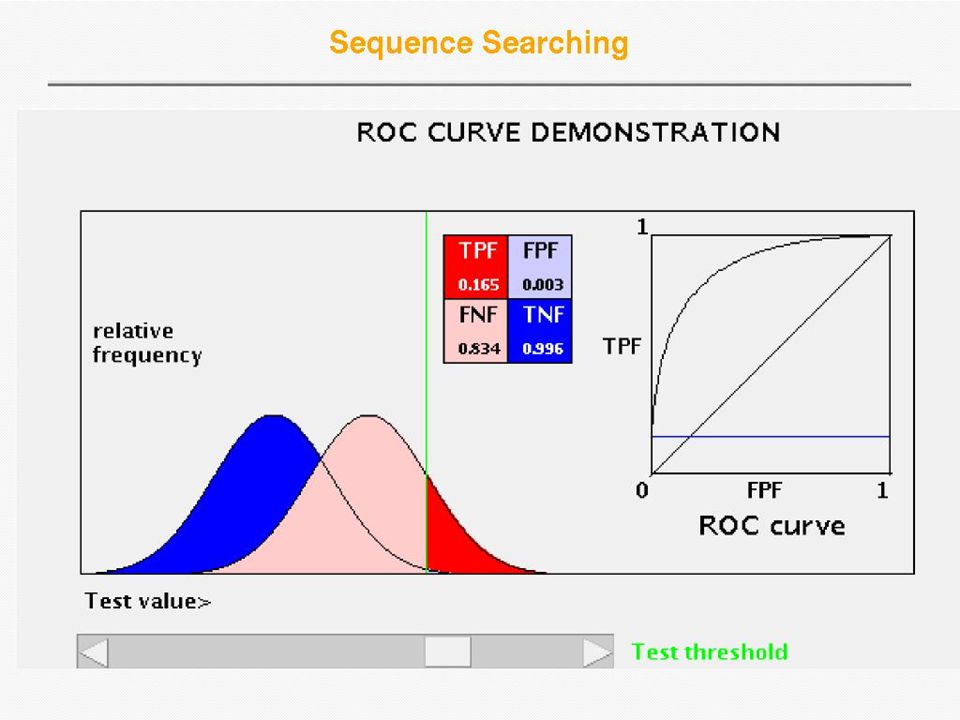
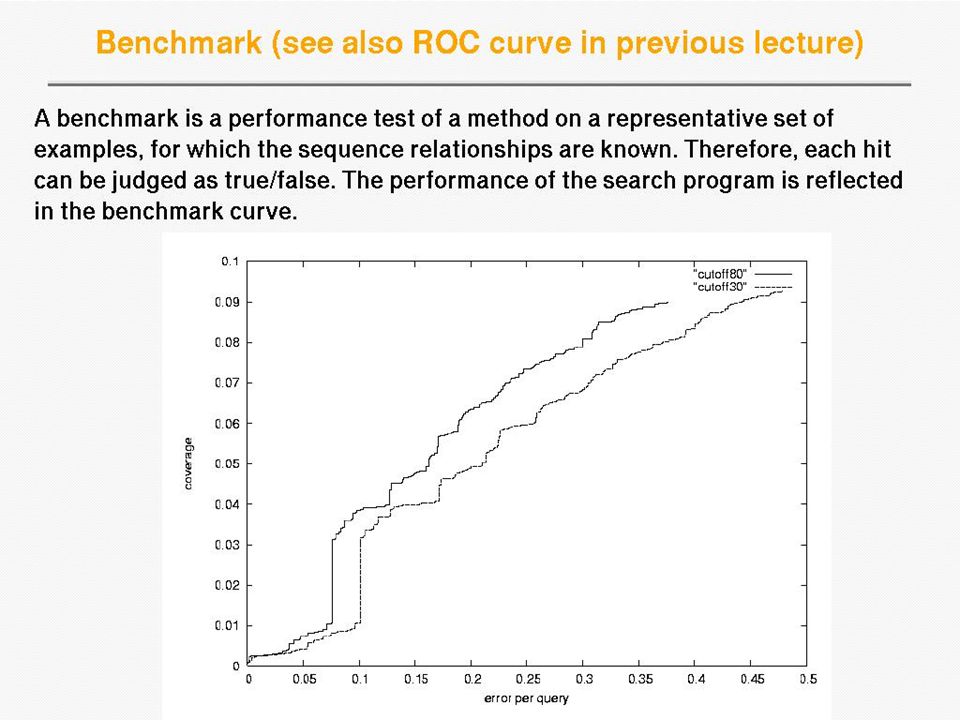
Receiver Operator Curve (ROC) Plot Sensitivity (TP/(TP+FN)) against 1- Specificity (1 - TN/(FP+TN)), where the latter is called error Error = 1 - specificity Sensitivity Sensitivity is also called Coverage
 Plot Sensitivity (TP/(TP+FN)) against 1- Specificity (1 - TN/(FP+TN)), where the latter is called error Error = 1 - specificity Sensitivity Sensitivity is also called Coverage")
38
Database Search Algorithms: Sensitivity, Selectivity Sensitivity – the ability to detect weak similarities between sequences (often due to long evolutionary separation). Increasing sensitivity reduces false negatives, i.e. those database sequences similar to the query, but rejected. Sensitivity (or Coverage) = TP / (TP+FN) Selectivity – the ability to screen out similarities due to chance. Increasing selectivity reduces false positives, those sequences recognized as similar when they are not. Selectivity (or Positive Prediction Value) = TP / (TP + FP) Specificity also describes the ability of the method to select proper hits Specificity = TN / (TN + FP) Sensitivity Selectivity, Specificity Courtesy of Gary Benson (ISSCB 2003)
 = TP / (TP+FN) Selectivity – the ability to screen out similarities due to chance. Increasing selectivity reduces false positives, those sequences recognized as similar when they are not. Selectivity (or Positive Prediction Value) = TP / (TP + FP) Specificity also describes the ability of the method to select proper hits Specificity = TN / (TN + FP) Sensitivity Selectivity, Specificity Courtesy of Gary Benson (ISSCB 2003).")
42
COG – Cluster of Orthologous Groups Orthologues found using bi- directional best hit searching with PSI-BLAST All COG family members are supposed to have the same function Searching with an unknown sequence only needs to hit a single member of a COG family, annotation can then be transferred COG2813 http://www.ncbi.nlm.nih.gov/COG/

43
Structure-based function prediction SCOP (http://scop.berkeley.edu/) is a protein structure classification database where proteins are grouped into a hierarchy of families, superfamilies, folds and classes, based on their structural and functional similarities

44
Structure-based function prediction SCOP hierarchy – the top level: 11 classes

45
Structure-based function prediction All-alpha protein Coiled-coil protein All-beta protein Alpha-beta proteinmembrane protein

46
Structure-based function prediction SCOP hierarchy – the second level: 800 folds

47
Structure-based function prediction SCOP hierarchy - third level: 1294 superfamilies

48
Structure-based function prediction SCOP hierarchy - third level: 2327 families

49
Structure-based function prediction Using sequence-structure alignment method, one can predict a protein belongs to a –SCOP family, superfamily or fold Proteins predicted to be in the same SCOP family are orthologous Proteins predicted to be in the same SCOP superfamily are homologous Proteins predicted to be in the same SCOP fold are structurally analogous folds superfamilies families

51
Profile wander

52
ABAB B C C D

53
Multi-domain Proteins (cont.) A common conserved protein domain such as the tyrosine kinase domain can obscure weak but relevant matches to other domain types (e.g. only appearing after 5000 kinase hits) Sequences containing low-complexity regions, such as coiled coils and transmembrane regions, can cause an explosion of the search rather than convergence because of the absence of any strong sequence signals. Conversely, some searches may lead to premature convergence; this occurs when the PSSM is too strict only allowing matches to very similar proteins, i.e., sequences with the same domain organization as the query are detected but no homologues with different domain combinations.
 Sequences containing low-complexity regions, such as coiled coils and transmembrane regions, can cause an explosion of the search rather than convergence because of the absence of any strong sequence signals. Conversely, some searches may lead to premature convergence; this occurs when the PSSM is too strict only allowing matches to very similar proteins, i.e., sequences with the same domain organization as the query are detected but no homologues with different domain combinations..")
54
Multi-domain Proteins - DOMAINATION George R.A. and Heringa J. (2002) Protein domain identification and improved sequence similarity searching using PSI-BLAST, Proteins: Struct. Func. Gen. 48, 672-681. Iterate PSI-BLAST searches and domain delineation DOMAINATION uses sequence signals to identify domain boundaries
 Protein domain identification and improved sequence similarity searching using PSI-BLAST, Proteins: Struct. Func. Gen. 48, Iterate PSI-BLAST searches and domain delineation DOMAINATION uses sequence signals to identify domain boundaries.")
55
Multi-domain Proteins – DOMAINATION method query Strategy: Combine C- and N-termini of local alignments to delineate domain boundaries Count start and stops of alignments P(boundary)
")
56
DOMAINATION: Identifying domain boundaries Sum N- and C-termini of gapped local alignments True N- and C- termini are counted twice (within 10 residues) Boundaries are smoothed using two windows (15 residues long) Combine scores using biased protocol: if Ni x Ci = 0 then Si = Ni + Ci else Si = Ni + Ci +(Ni x Ci)/(Ni + Ci)
 Boundaries are smoothed using two windows (15 residues long) Combine scores using biased protocol: if Ni x Ci = 0 then Si = Ni + Ci else Si = Ni + Ci +(Ni x Ci)/(Ni + Ci)")
57
DOMAINATION: identifying domain deletions Deletions in the query (or insertion in the DB sequences) are identified by –two adjacent segments in the query align to the same DB sequences (>70% overlap), which have a region of >35 residues not aligned to the query. (remove N- and C- termini) DB Query
 DB Query.")
58
DOMAINATION: identifying domain permutations A domain shuffling event is declared –when two local alignments (>35 residues) within a single DB sequence match two separate segments in the query (>70% overlap), but have a different sequential order. DB Query b a a b

59
DOMAINATION: identifying continuous and discontinuous domains Each segment is assigned an independence score (In). If In>10% the segment is assigned as a continuous domain. An association score is calculated between non-adjacent fragments by assessing the shared sequence hits to the segments. If score > 50% then segments are considered as discontinuous domains and joined.

61
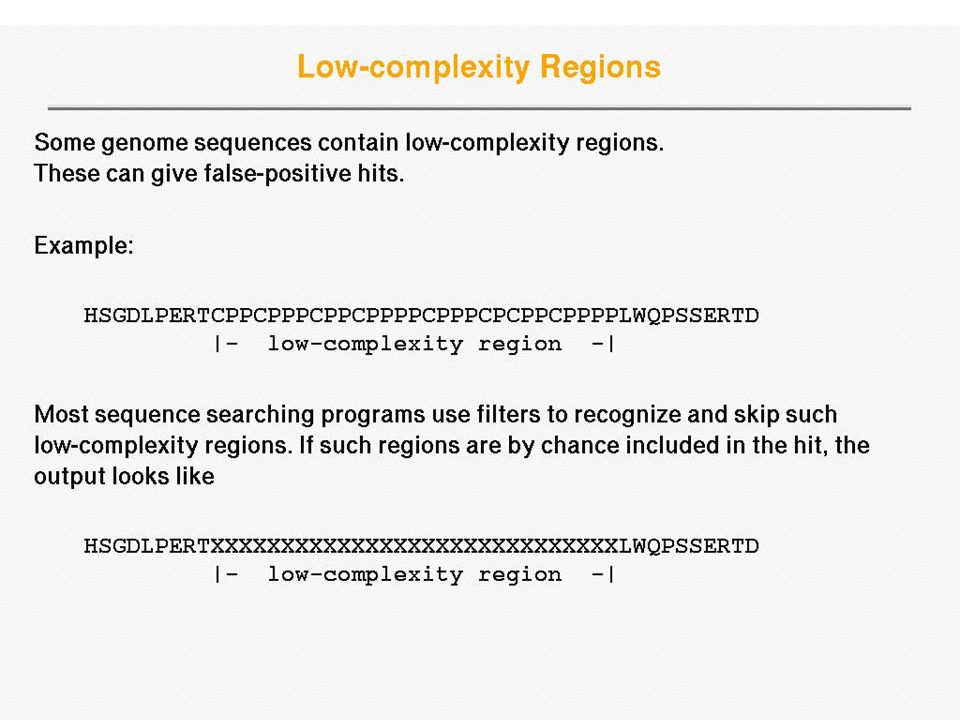
Low Complexity segments A sequence of L residues of N types can have L!/ N n a ! different sequences of that same composition, where the composition vector = (n 1,.., n a,.., N) and N n a ! = n 1 ! * n 2 ! *.. * n N ! If R c is a vector of length N, where the vector numbers correspond to the number of residues with a given frequency (e.g. there are 5 amino acid types with 0 abundance, 3 amino acid types with abundance 1, etc., in the sequence), then the total number of distinct sequences corresponding to a particular complexity state-vector is (L! / N n a !) * (N! / L r c !), where L r c ! = r 0 ! * r 1 ! *.. * r L-1 ! * r L ! Based on this, the final complexity score calculated by the SEG program is P SEG = (1/N L ) * (L! / N n a !) * (N! / L r c !)
 and N n a . = n 1 . * n 2 . *.. * n N . If R c is a vector of length N, where the vector numbers correspond to the number of residues with a given frequency (e.g. there are 5 amino acid types with 0 abundance, 3 amino acid types with abundance 1, etc., in the sequence), then the total number of distinct sequences corresponding to a particular complexity state-vector is (L. / N n a !) * (N. / L r c !), where L r c . = r 0 . * r 1 . *.. * r L-1 . * r L . Based on this, the final complexity score calculated by the SEG program is P SEG = (1/N L ) * (L. / N n a !) * (N. / L r c !).")
62
DOMAINATION: Post-processing low complexity regions in database sequences Remove local fragments with > 15% LC

66
Conserved hypotheticals >P00001 Conserved hypothetical A substantial fraction of genes in sequenced genomes encodes 'conserved hypothetical' proteins, i.e. those that are found in organisms from several phylogenetic lineages but have not been functionally characterized.

67
Profile wander (or matrix migration) Permissive iterative searching user higher E-values can lead to incorrect hits (false positives) that become included into the profile. More incorrect hits can then be added in subsequent iterations, and true homologues can be lost. Also, the search can explode, leading to large numbers of spurious hits. A further loss of information can be incurred with PSIBLAST, because PSI-BLAST PSSMs are trimmed to only use the highest scoring region in a search, ignoring less conserved regions

70
Sequence identity scoring zones >25-30%: homology zone 15-25%: twilight zone <15%: midnight zone (Rost, 1999) Is midnight zone properly definable?
 Is midnight zone properly definable")
Similar presentations


 Expected number of hits, of equivalent or better score, found by random chance in a database of the size.>")
>")
>")


>")

 –Fold recognition (threading) Outstanding difficult.>")

 The Mechanics of Alignments.>")