Download presentation
Presentation is loading. Please wait.

1
New designs and paradigms for science- based oncology clinical trials Richard Simon, D.Sc. Chief, Biometric Research Branch National Cancer Institute http://brb.nci.nih.gov rsimon@nih.gov

2
Prognostic & Predictive Biomarkers in Oncology Many cancer treatments benefit only a minority of patients to whom they are administered – Large NNT Being able to predict which patients are likely to benefit can – Help patients get effective treatment – Help control medical costs – Improve the success rate of drug development We now have better tools for understanding variability in outcome and response to rx

3
Prognostic biomarker or signature – Identify patients with very good or very poor outcome on standard treatment Predictive biomarker – Identify patients likely or unlikely to respond to a specific treatment

5
Major problems with prognostic studies of gene expression signatures Inadequate focus on intended use – Patient selection for study and approach to data analysis are not guided by an intended use Reporting biased estimates of predictive value

7
Validation of Prognostic Model Completely independent validation dataset Splitting dataset into training and testing sets – Evaluate 1 completely specified model on test set Complete cross-validation

8
Leave-one-out Cross Validation for Estimating the Misclassification Rate of Binary Classifier Full dataset P={1,2,…,n} Omit case 1 V 1 ={1}; T 1 ={2,3,…,n} Develop classifier using training set T 1 Classify cases in V 1 and count whether classification is correct or not Repeat for case 2,3,… Total number of mis-classified cases

9
Complete cross Validation Cross-validation simulates the process of separately developing a model on one set of data and predicting for a test set of data not used in developing the model – All aspects of the model development process must be repeated for each loop of the cross-validation Feature selection Tuning parameter optimization

10
The cross-validated estimate of misclassification error is an estimate of the prediction error for the model fit applying the specified algorithm to the full dataset

12
Partition data set D into K equal parts D 1,D 2,...,D K First training set T 1 =D-D 1 Develop completely specified prognostic model M 1 using only data T 1 eg Using M 1, compute risk group for cases in D 1 Repeat, for new training set T 2 =D-D 2 Develop model M 2 using only T 2 and then score cases in D 2

13
Repeat for... T 3, …, T K Calculate Kaplan-Meier survival curve for each risk-group Calculate time-dependent ROC curve using the cross-validated risk groups and compute AUC

15
The cross-validated estimate of the survival curves for the risk groups is an estimate of the future performance for the model fit applying the specified algorithm to the full dataset

20
To evaluate significance, the log-rank test cannot be used for cross-validated Kaplan- Meier curves because the survival times are not independent

21
Statistical significance can be properly evaluated by approximating the null distribution of the cross-validated log-rank statistic Permute the survival times and repeat the entire cross-validation procedure to generate new cross-validated K-M curves for low risk and high risk groups – Compute log-rank statistic for the curves Repeat for many sets of permutations

22
In many positive phase III clinical trials comparing a new treatment to control, most of the patients treated with the new treatment do not benefit. – Adjuvant breast cancer: 70% long-term disease- free survival on control. 80% disease-free survival on new treatment. 70% of patients don’t need the new treatment. Of the remaining 30%, only 1/3 rd benefit.

23
Standard Paradigm of Phase III Clinical Trials Broad eligibility Base primary analysis on ITT eligible population Don’t size for subset analysis, allocate alpha for subset analysis or trust subset analysis – Only do subset analysis if overall treatment effect is significant and interaction is significant

24
Standard Paradigm Sometimes Leads to Large NNT Small average treatment effects Inconsistent results among studies False negative studies

25
Predictive Biomarkers Cancers of a primary site often represent a heterogeneous group of diverse molecular entities which vary fundamentally with regard to – the oncogenic mutations that cause them – their responsiveness to specific treatments Molecularly targeted drugs are likely to be effective only for tumors that are driven by de-regulation of the pathway which is a target of the drug

27
Neither conventional approaches to post-hoc subset analysis nor the broad eligibility paradigm are adequate for genomic based oncology clinical trials

28
How can we develop new drugs in a manner more consistent with modern disease biology and obtain reliable information about what regimens work for what kinds of patients?

29
When the Biology is Clear the Development Path is Straightforward Develop a classifier that identifies the patients likely to benefit from the new drug Develop an analytically validated test – Measures what it should accurately and reproducibly Design a focused clinical trial to evaluate effectiveness of the new treatment in test + patients (i.e. those predicted likely to benefit)
.")
30
Using phase II data, develop predictor of response to new drug Develop Predictor of Benefit from New Drug Patient Predicted Responsive New Drug Control Patient Predicted Non-Responsive Off Study Enrichment design

31
Successful use of targeted enrichment design Trastuzumab, pertuzumab, ado-trastuzumab emtansine for HER2 over-expressed or amplified breast cancer Vemurafinib, dabrafinib, trametinib for BRAF mutated melanoma Crizotinib and ceritinib in ALK translocated NSCLC Afatinib in EGFR mutated NSCLC 31

32
Advantages of enrichment design Targets larger treatment effect less diluted by non-sensitive tumors Avoids exposing patients less likely to benefit to adverse effects of drug until drug is shown effective for those whom it is supposed to benefit Clarity of interpretation

33
Regulatory Pathway for Test Companion diagnostic test with intended use of identifying patients who have disease subtype for which the drug is proven effective

34
If the drug is effective in test positive patients, it can be later evaluated in test negative patients. – Saves test – patients toxicity until drug is shown effective in the target population it should work in 34

35
All comers design Invites poor design – Too few test + patients – Too many test – patients – Failure to have a specific analysis plan Invites inappropriate analysis – Inappropriate requirement of not doing subset analysis unless ITT test is significant and interaction is significant 35

36
Evaluating the Efficiency of Targeted Design Simon R and Maitnourim A. Evaluating the efficiency of targeted designs for randomized clinical trials. Clinical Cancer Research 10:6759- 63, 2004; Correction and supplement 12:3229, 2006 Simon R and Maitnourim A. Evaluating the efficiency of targeted designs for randomized clinical trials. Clinical Cancer Research 10:6759- 63, 2004; Correction and supplement 12:3229, 2006 Maitnourim A and Simon R. On the efficiency of targeted clinical trials. Statistics in Medicine 24:329-339, 2005. Maitnourim A and Simon R. On the efficiency of targeted clinical trials. Statistics in Medicine 24:329-339, 2005.

37
Two Clinical Trial Designs Standard design – Randomized comparison of new drug E to control C without the test for screening patients Enrichment design – Test patients – Randomize only test + patients Size each design to have power 0.9 and significance level 0.05

38
RandRat = n untargeted /n targeted TE + =rx effect in marker + stratum TE - = rx effect in marker – stratum p + =proportion of patients marker +

39
RandRat = n untargeted /n targeted If TE - =0 RandRat = 1/ p + 2 – if p + =0.5, RandRat=4

40
RandRat = n untargeted /n targeted If TE - = TE + /2 RandRat = 4/(p + +1) 2 – if p + =0.5, RandRat=16/9=1.77
 2 – if p + =0.5, RandRat=16/9=1.77")
41
Comparing E vs C on Survival or DFS 5% 2-sided Significance and 90% Power % Reduction in HazardNumber of Events Required 25%509 30%332 35%227 40%162 45%118 50%88

42
RandRat = n untargeted /n targeted B + =TE in biology + pts TE + =TE in test + pts TE + =(ppv)B + + (1-ppv)B -
B + + (1-ppv)B -")
43
Sensitivity = Pr[Test is + | Biology is +] Specificity = Pr[Test is - | Biology is -] PPV = Pr[Biology is + | Test is +]
![Sensitivity = Pr[Test is + | Biology is +] Specificity = Pr[Test is - | Biology is -] PPV = Pr[Biology is + | Test is +]](http://images.slideplayer.com/16/4893750/slides/slide_43.jpg "Sensitivity = Pr[Test is + | Biology is +] Specificity = Pr[Test is - | Biology is -] PPV = Pr[Biology is + | Test is +]")
44
44

45
SensitivitySpecificityp+B-PPVRand Ratio 0.8 0.3300.672 0.8 0.33B+/20.671.25 45

46
Implications for Early Phase Studies Need to design and size early phase studies to define predictive biomarker Need to establish an analytically validated test

47
Early Phase Studies May need to evaluate several candidate markers May need to evaluate several candidate tests – e.g. protein expression of target or amplification of gene Phase II trials sized for adequate numbers of test positive patients and to determine appropriate cut-point of positivity

48
Umbrella Design

51
Run-in Short term (e.g. 4 weeks) On test treatment or control Happens before randomization
 On test treatment or control Happens before randomization")
52
Pharmacodynamic measure of treatment effect Immunologic measure of treatment effect Short-term quantitative imaging change in tumor size PSA or quantitative CTC Run-in “response” used as predictive biomarker, not as surrogate endpoint

58
Cancer biology is complex and it is not always possible to have the right single predictive classifier identified with an appropriate cut- point by the time the phase III trial of a new drug is ready to start accrual Cancer biology is complex and it is not always possible to have the right single predictive classifier identified with an appropriate cut- point by the time the phase III trial of a new drug is ready to start accrual

60
Provides a general framework for adaptive enrichment, i.e. restricting the eligibility criteria during the course of the trial based on interim results. Framework includes threshold based enrichment or enrichment based on multi- marker modeling Framework handles multiple types of endpoints (continuous, binary, time-to-event)
.")
61
One primary statistical significance test is performed at the end of the trial, including all randomized patients, of the strong null hypothesis that the new treatment is uniformly ineffective Fixed sample size regardless of changes in eligibility Framework identifies classes of significance tests which preserve the type I error even with time dependent and data dependent changes to outcome distributions of patients

62
Example: Single binary biomarker If at interim analysis the posterior probability that the test treatment is better than control for marker negative patients is < ε, then stop enrolling marker negative patients If it is also true for maker positive patients, then stop enrolling all patients

63
Example: Single quantitative biomarker Single biomarker with K candidate cut-points b 1,…,b K Use uniform prior distribution that the optimal cut- point is 0 or b 1,…,b K,or b K+1 – cut-point 0 means that all patients benefit from the test treatment – cut-point b K+1 means no patients benefit from the test treatment – cut-point b k means no treatment effect for B b k do benefit At interim analyis, compute posterior distribution for the true cut-point If Pr post [b true >b k ]>1-ε, stop accrual of patients with B>b k
![Example: Single quantitative biomarker Single biomarker with K candidate cut-points b 1,…,b K Use uniform prior distribution that the optimal cut- point is 0 or b 1,…,b K,or b K+1 – cut-point 0 means that all patients benefit from the test treatment – cut-point b K+1 means no patients benefit from the test treatment – cut-point b k means no treatment effect for B b k do benefit At interim analyis, compute posterior distribution for the true cut-point If Pr post [b true >b k ]>1-ε, stop accrual of patients with B>b k](http://images.slideplayer.com/16/4893750/slides/slide_63.jpg "Example: Single quantitative biomarker Single biomarker with K candidate cut-points b 1,…,b K Use uniform prior distribution that the optimal cut- point is 0 or b 1,…,b K,or b K+1 – cut-point 0 means that all patients benefit from the test treatment – cut-point b K+1 means no patients benefit from the test treatment – cut-point b k means no treatment effect for B b k do benefit At interim analyis, compute posterior distribution for the true cut-point If Pr post [b true >b k ]>1-ε, stop accrual of patients with B>b k")
64
Example: K binary biomarkers At interim analysis evaluate whether any of the K biomarkers appear sufficiently predictive If not, continue to enroll all patients and do not use any biomarker for final analysis If so, use the most prognostic biomarker to restrict further accrual to marker negative patients.

65
Simulation Example Adaptive threshold enrichment Single biomarker uniformly distributed on (0,1) K candidate thresholds Binary response with probability p 0 (b) for control and p 1 (b) for test treatment p 0 (b)=p 0 for all b p 1 (b)=p 0 for b x* True threshold x* Single interim analysis
 K candidate thresholds Binary response with probability p 0 (b) for control and p 1 (b) for test treatment p 0 (b)=p 0 for all b p 1 (b)=p 0 for b x* True threshold x* Single interim analysis")
67
p 0 =.2, p 1 =.5, K=5, N tot =200, 100 patients/yr True cut-pointPower adaptive Power non- adaptive Accrual adaptive Accrual non- adaptive.25.968.9552.552.25.5.897.7263.193.25.67.768.4243.974.75 67

68
Significance tests that preserve type I error with group sequential adaption

69
Survival Data Use intermediate endpoint for adapting eligibility – PFS or response t k =standardized log-rank statistic for patients accrued in period k but evaluated at final analysis time

70
Adaptive enrichment designs We have subsequently extended the analysis plans to Test the null hypothesis of no treatment effect for the eligible population selected at the final interim analysis Obtain an unbiased estimate of treatment effect for the eligible population selected at the final interim analysis

71
Designs When there are many candidate markers and multi-marker classifiers are of Interest

74
The indication classifier is not a binary classifier of whether a patient has good prognosis or poor prognosis It is a predictive classifier that indicates whether the prognosis of a patient on E is better than the prognosis of the patient on C

75
The classifier need not use all the covariates but variable selection must be determined using only the training set – Variable selection may be based on selecting variables with apparent interactions with treatment, with cut-off for variable selection determined by cross-validation within training set for optimal classification 75

76
Example 1: Predictive Classifier Optimize the cut-point of a pre-specified biomarker in the training set If B > c then assign E; otherwise C. Optimize to – Exclude patients unlikely to benefit from E. – Maximize E-C treatment effect for B>c – Maximize chance of obtaining statistical significance in B>c subset in validation set

77
Example 2: Predictive Classifier Select one from among K candidate biomarkers based on training set performance and optimize cut-point of that marker Candidate biomarkers B 1, …, B K Select B k* If B k* >c k* then treat with E; otherwise C.

78
Example 3: Predictive Classifier Generate an optimal decision tree using K candidate biomarkers and their candidate cut- points to optimize training set performance e.g. If IHC EGFR >1 and KRAS=WT, then treat with E; otherwise C.

79
Example 4: Predictive Classifier Fit penalized logistic regression models relating response rate to a linear combination of log gene expression values separately for each treatment group E and C. If predicted response for patient on E exceeds predicted response on C by ≥ Δ then treat with E; otherwise C.

80
Key Idea Replace multiple significance testing by development of one predictive classifier Obtain unbiased estimate of treatment effect in classifier + patients and test null hypothesis that the treatment effect in classifier + patients is 0.

83
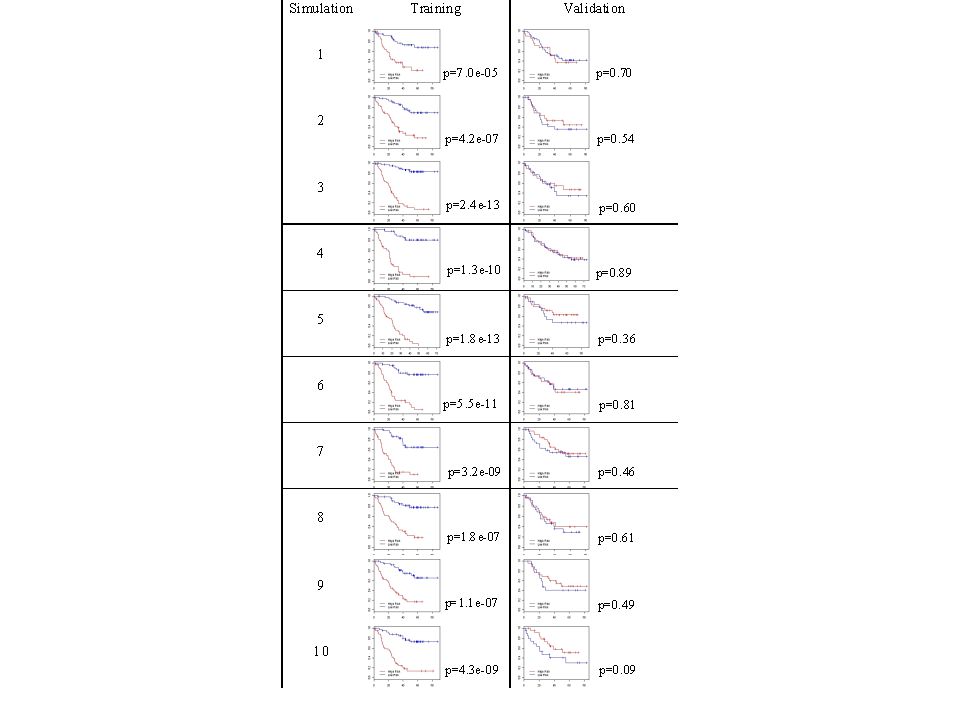
The cross-validated adaptive signature “design” can be used as a method for re- analysis of previously conducted phase III clinical trials to find a predictive classifier and to internally validate that classifier.

84
At the conclusion of the trial randomly partition the patients into K approximately equally sized sets D 1, …, D K Let D -i denote the full dataset minus data for patients in D i Omit patients in D 1 Apply the defined algorithm to analyze the data in D -1 to obtain a classifier M -1 Classify each patient j in D 1 using model M -1 Record the treatment recommendation E or C

85
Repeat the above steps for all K loops of the cross-validation (develop classifier from scratch in each loop and classify omitted patients) When cross-validation is completed, all patients have been classified once as what their optimal treatment is predicted to be
 When cross-validation is completed, all patients have been classified once as what their optimal treatment is predicted to be")
86
Let P denote the set of patients for whom treatment E is predicted optimal Compare outcomes for patients in P who actually received E to those in P who actually received C – Compute Kaplan Meier curves of those receiving E and those receiving C – The difference between these Kaplan Meier curves is our measure of treatment effect – e.g. Let z = standardized log-rank statistic

87
Test of Significance for Effectiveness of E vs C Compute statistical significance of z by randomly permuting treatment labels and repeating the entire cross-validation procedure to obtain a new set P’ and a new logrank statistic z’ – Do this 1000 or more times to generate the permutation null distribution of treatment effect for the patients in P

88
The size of the E vs C treatment effect for the indicated population is estimated by the Kaplan Meier survival curves of E and of C in P The predictive classifier to be used in the future is obtained by applying our classifier development algorithm to the full dataset

96
Adaptive Treatment Selection 96

97
97

99
99

100
100

101
101

102
102

106
Thoughts for future development Need to study lots of combinations – Need efficient new phase I combination designs and perhaps greater use of phase II selection designs – Use doses so that all components have serum levels necessary for full activity

107
Thoughts for future development Need to re-consider when to do a phase III trial – Different considerations for companies and for non-commercial research organizations – May not be optimal to do phase 3 trials targeting small effects or to restrict combinations to drugs which have demonstrated prolongation of survival

108
How many drugs do we need to combine? Naïve thoughts about tumor heterogeneity may give an overly pessimistic view Many tumors may have only a small (e.g. <5) number of “founder” mutations These mutations are present in all sub-clones of the tumor and may be the best targets The tumor is heterogeneous with regard to the other “driver” and passenger mutations
 number of founder mutations These mutations are present in all sub-clones of the tumor and may be the best targets The tumor is heterogeneous with regard to the other driver and passenger mutations.")
109
How many drugs do we need to combine? The other driver mutations develop in the context of the founder mutations and may only be viable in that context Reversing the effect of the founder mutations may lead to apoptosis of the tumor cells if the tumor is treated early enough

111
How many drugs do we need to combine? We need to hit each founder mutation with either – A high enough concentration of the inhibitor to inhibit even partially resistant cells – Two inhibitors with distinct binding sites – An inhibitor of the mutated target and an inhibitor “downstream” of “the” de-regulated pathways

112
We need to Encourage development of kinase inhibitors more specific for mutated protein as in the case of vemurafinib Systematically map and model the key “pathways” de-regulated in tumors Develop synthetic lethality strategies for targeting cells with de-regulated tumor suppressors and apoptosis controls

113
We need to Carry out more synthetic lethality studies on panels of tumor cell lines and provide public access Carry out deep single molecule sequencing studies of tumors and candidate precursors to identify cell of origin and founder mutations

114
We need to Focus academic developmental therapeutics on a strategy complementary to that of industry Fund some academic developmental therapeutics to address problems too risky for industry or R01 small lab research Solicit the cooperation of industry to facilitate the conduct of academic studies of combinations involving the drugs of several companies

115
We need to Provide oversight to regulatory agencies to ensure that they do not roadblock sound adaptive biomarker based designs

116
Acknowledgements Boris Freidlin (NCI) Wenyu Jiang (Queens U) Aboubakar Maitournam (U Niger) Noah Simon (U Washington)
 Wenyu Jiang (Queens U) Aboubakar Maitournam (U Niger) Noah Simon (U Washington)")
Similar presentations


 How.>")


 Design. Prospective Co-Development of Drugs and Companion Diagnostics 1. Develop a completely specified genomic classifier of the.>")


 Hajime Uno (Kitasato University) Tianxi Cai, Els Goetghebeur,>")
 assessment Dr. Huiru Zheng Dr. Franscisco Azuaje School of Computing and Mathematics Faculty of Engineering.>")


