Download presentation
Presentation is loading. Please wait.

1
REAL ESTATE MARKET UPDATE May 27, 2015 Berkeley/Oakland AOR Leslie Appleton-Young Chief Economist

2
OVERVIEW Macro-Economic Outlook California Housing Market Outlook Housing Affordability Regional Market Stats 2015 Forecast

3
ECONOMIC OUTLOOK

4
GDP STALLED: DROP IN CONSUMER SPENDING, LOWER EXPORTS & INVESTMENT 2013: 1.9% 2014: 2.4%; Q1 2015:.2% ANNUAL PERCENT CHANGE, CHAIN-TYPE (2005) $ ANNUALLYQUARTERLY SERIES: GDP SOURCE: US Dept. of Commerce, Bureau of Economic Analysis

5
SERIES: Components of GDP SOURCE: US Dept. of Commerce, Bureau of Economic Analysis EVERY SECTOR DOWN IN Q1 Components of GDP ANNUAL PERCENT CHANGE

6
UNEMPLOYMENT RATES AT 7-YEAR LOWS CA (Mar 2015): 6.5% vs. US (Apr 2015): 5.4% SERIES: Unemployment Rate SOURCE: US Bureau of Labor Statistics, CA Employment Development Division
: 5.4% SERIES: Unemployment Rate SOURCE: US Bureau of Labor Statistics, CA Employment Development Division.")
7
PARTICIPATION DOWN: AGING POP & SLOW JOB GROWTH & HIGH LONG TERM UNEMPLOYMENT CA- 62.5% (Dec. 2014) vs. USA- 62.7% (Dec. 2014) Labor Force Rate SERIES: Labor Force Participation Rate SOURCE: BLS, Data Buffet
 vs. USA- 62.7% (Dec. 2014) Labor Force Rate SERIES: Labor Force Participation Rate SOURCE: BLS, Data Buffet.")
8
JOB LOSSES IN PRIOR RECESSIONS - RECENT CYCLE WORST BY FAR

9
CALIFORNIA JOB GROWTH ACCELERATING AGAIN ANNUAL PERCENT CHANGE SERIES: Total Nonfarm Employment SOURCE: US Bureau of Labor Statistics, CA Employment Development Division

10
JOB TRENDS BY CALIFORNIA METRO AREA SERIES: Total Nonfarm Employment SOURCE: CA Employment Development Division ANNUAL PERCENT CHANGE March 2015: CA +3.2%, +502,200

11
CALIFORNIA JOB CHANGES BY INDUSTRY SERIES: Total Nonfarm Employment By Industry SOURCE: US Bureau of Labor Statistics, CA Employment Development Division March 2015: CA +3.2%, +502,200 ANNUAL PERCENT CHANGE

12
MAY: UPTICK IN CONFIDENCE May 2015: 95.4 INDEX, 100=1985 SERIES: Consumer Confidence SOURCE: The Conference Board

13
STILL NO INFLATION IN SIGHT… March 2015: All Items 0% YTY; Core +1.8% YTY ANNUAL PERCENT CHANGE SERIES: Consumer Price Index SOURCE: US Bureau of Labor Statistics

14
MORTGAGE RATES BACK TO 2013 LOWS January 2009 – March 2015 MONTHLY WEEKLY SERIES: 30Yr FRM, 1Yr ARM SOURCE: Federal Home Loan Mortgage Corporation

15
U.S. DEPOSITORY INSTITUTIONS: HIGH LEVEL OF EXCESS RESERVES SINCE 9/08 SERIES: Excess Reserves of Depository Institutions SOURCE: Federal Reserve Bank of Saint Louis $ BILLIONS

16
IS THERE A FORECAST BIAS FOR RISING RATES? Percent SERIES: Loan Officer Survey SOURCE: Philadelphia Federal Reserve Survey of Professional Forecasters, Bloomberg

17
CALIFORNIA ECONOMIC OUTLOOK SERIES: CA Economic Outlook SOURCE: CALIFORNIA ASSOCIATION OF REALTORS®

18
CALIFORNIA HOUSING MARKET OUTLOOK

19
CALIFORNIA HOUSING MARKET FORECAST SERIES: CA Housing Market Outlook SOURCE: CALIFORNIA ASSOCIATION OF REALTORS®

20
SLOW START; SALES NOW UP 4.1% YEAR TO DATE California, Apr. 2015 Sales: 427,620 Units, +4.1% YTD, +9.3% YTY *Sales are seasonally adjusted and annualized SERIES: Sales of Existing Single Family Homes SOURCE: CALIFORNIA ASSOCIATION OF REALTORS® Apr-15: 427,620 Apr-14: 391,330

21
CALIFORNIA SALES UP YEAR-OVER-YEAR SERIES: Sales of Existing Single Family Homes, Not Seasonally Adjusted SOURCE: CALIFORNIA ASSOCIATION OF REALTORS®

22
CHANGE IN SALES BY PRICE RANGE (Year-to-Year) SERIES: Sales of Existing Detached Homes SOURCE: CALIFORNIA ASSOCIATION OF REALTORS®
 SERIES: Sales of Existing Detached Homes SOURCE: CALIFORNIA ASSOCIATION OF REALTORS®")
23
SALES BY REGION(EXISTING SFH) SERIES: Sales, Not Seasonally Adjusted SOURCE: CALIFORNIA ASSOCIATION OF REALTORS®
 SERIES: Sales, Not Seasonally Adjusted SOURCE: CALIFORNIA ASSOCIATION OF REALTORS®")
24
SALES LOOKING POSITIVE SO FAR FOR ‘15 SERIES: Sales of Existing Single Family Homes, Seasonally Adjusted SOURCE: CALIFORNIA ASSOCIATION OF REALTORS®

25
SHARE OF EQUITY SALES NEAR 90% SINCE MID - 2014 SERIES: Distressed Sales, Not Seasonally Adjusted SOURCE: CALIFORNIA ASSOCIATION OF REALTORS®

26
NINE OF TEN SALES WERE EQUITY SALES SERIES: Distressed Sales, Not Seasonally Adjusted SOURCE: CALIFORNIA ASSOCIATION OF REALTORS® California: Mar 2015

27
OAKLAND Preforeclosure: 148 Auction: 180 Bank Owned: 39 SOURCE: PropertyRadar on 5/26/15

28
BERKELEY Preforeclosure: 24 Auction: 21 Bank Owned: 2 SOURCE: PropertyRadar on 5/26/15

29
CITY OF ALAMEDA Preforeclosure: 23 Auction: 10 Bank Owned: 3 SOURCE: PropertyRadar on 5/26/15

30
ALAMEDA COUNTY Preforeclosure: 594 Auction: 486 Bank Owned: 82 SOURCE: PropertyRadar on 5/26/15

31
ALAMEDA COUNTY Preforeclosure: 594 Auction: 486 Bank Owned: 82 SOURCE: PropertyRadar on 5/26/15

32
ALAMEDA COUNTY Preforeclosure: 594 Auction: 486 Bank Owned: 82 SOURCE: PropertyRadar on 5/26/15

33
CONTRA COSTA COUNTY Preforeclosure: 639 Auction: 309 Bank Owned: 138 SOURCE: PropertyRadar on 5/26/15

34
CONTRA COSTA COUNTY Preforeclosure: 639 Auction: 309 Bank Owned: 138 SOURCE: PropertyRadar on 5/26/15

35
CONTRA COSTA COUNTY Preforeclosure: 639 Auction: 309 Bank Owned: 138 SOURCE: PropertyRadar on 5/26/15

36
INVENTORY DROPPED SIGNIFICANTLY IN THE BAY AREA SINCE 2009 BUT REMAINED TIGHT Note: “Unsold Inventory Index” represents the number of months it would take to sell the remaining inventory for the month in question. The remaining inventory for the month is defined as the number of properties that were “Active”, “Pending”, and “Contingent” (when available) and divide the sum by the number of “Sold” properties for the month in question. SERIES: Unsold Inventory Index of Existing Single Family Homes SOURCE: CALIFORNIA ASSOCIATION OF REALTORS®
 and divide the sum by the number of Sold properties for the month in question. SERIES: Unsold Inventory Index of Existing Single Family Homes SOURCE: CALIFORNIA ASSOCIATION OF REALTORS®.")
37
APRIL MEDIAN HIGHEST SINCE NOV 2007 California, Apr. 2015: $481,760, +2.8% MTM, +7.4% YTY SERIES: Median Price of Existing Single Family Homes SOURCE: CALIFORNIA ASSOCIATION OF REALTORS® Apr-15: $481,760 Apr-15: $448,720

38
HOME PRICE APPRECIATIONS HAVE MODERATED SINCE MID 2013 SERIES: Sales of SFH and Condo Units SOURCE: CALIFORNIA ASSOCIATION OF REALTORS® YTY% Chg. in Price

39
SALES-TO-LIST RATIO April 2015: 98.8%, Up 0.5% MTM, Down 0.2% YTY Sales-to-List Price Ratio SERIES: Sales-to-List Ratio SOURCE: CALIFORNIA ASSOCIATION OF REALTORS®

40
INVENTORY DROPPED SLIGHTLY FROM LAST YEAR Apr 2014: 3.6 Months; Apr 2015: 3.5 Months Note: “Unsold Inventory Index” represents the number of months it would take to sell the remaining inventory for the month in question. The remaining inventory for the month is defined as the number of properties that were “Active”, “Pending”, and “Contingent” (when available) and divide the sum by the number of “Sold” properties for the month in question. SERIES: Unsold Inventory Index of Existing Single Family Homes SOURCE: CALIFORNIA ASSOCIATION OF REALTORS®
 and divide the sum by the number of Sold properties for the month in question. SERIES: Unsold Inventory Index of Existing Single Family Homes SOURCE: CALIFORNIA ASSOCIATION OF REALTORS®.")
41
UNSOLD INVENTORY INDEX (MONTHS) Note: “Unsold Inventory Index” represents the number of months it would take to sell the remaining inventory for the month in question. The remaining inventory for the month is defined as the number of properties that were “Active”, “Pending”, and “Contingent” (when available) and divide the sum by the number of “Sold” properties for the month in question. SERIES: Unsold Inventory Index of Existing Single Family Homes SOURCE: CALIFORNIA ASSOCIATION OF REALTORS®
 and divide the sum by the number of Sold properties for the month in question. SERIES: Unsold Inventory Index of Existing Single Family Homes SOURCE: CALIFORNIA ASSOCIATION OF REALTORS®.")
42
INVENTORY TIGHTEST IN THE BAY AREA Note: “Unsold Inventory Index” represents the number of months it would take to sell the remaining inventory for the month in question. The remaining inventory for the month is defined as the number of properties that were “Active”, “Pending”, and “Contingent” (when available) and divide the sum by the number of “Sold” properties for the month in question. SERIES: Unsold Inventory Index of Existing Single Family Homes SOURCE: CALIFORNIA ASSOCIATION OF REALTORS®
 and divide the sum by the number of Sold properties for the month in question. SERIES: Unsold Inventory Index of Existing Single Family Homes SOURCE: CALIFORNIA ASSOCIATION OF REALTORS®.")
43
WHERE IS THE INVENTORY? – Affordability challenge for repeat buyers Low mortgage- mortgage Lock-In Effect Low property taxes Why list when there is nowhere to go I can afford? – Foreclosure pipeline is dry – Investors renting instead of flipping – New construction recovering but LOW – Off- MLS (aka “pocket’) listings not being counted in listing stats
 listings not being counted in listing stats.")
44
HOUSING DEMAND OUTPACED SUPPLY IN THE BAY AREA AND SO CAL SOURCE: CALIFORNIA ASSOCIATION OF REALTORS® April 2015

45
HOUSING DEMAND OUTPACED SUPPLY IN THE BAY AREA SOURCE: CALIFORNIA ASSOCIATION OF REALTORS® April 2015

46
ANNUAL HOUSING MARKET SURVEY: 2014 FINDINGS

47
MULTIPLE OFFERS DECLINE - LESS INTENSE MARKET COMPETITION AFTER PEAKING IN 2013 SERIES: 2014 Housing Market Survey SOURCE: CALIFORNIA ASSOCIATION OF REALTORS®

48
Long Run Average = 19% FEWER HOMES SOLD ABOVE THE ASKING PRICE AS MARKET COMPETITION COOLED IN 2014 QUESTION: What was the original list sales price of the property? What was the final sales price of the property? SERIES: 2014 Housing Market Survey SOURCE: CALIFORNIA ASSOCIATION OF REALTORS®

49
49 % SOLD BELOW ASKING IN 2014 SERIES: 2014 Housing Market Survey SOURCE: CALIFORNIA ASSOCIATION OF REALTORS® Median Reduction: 4.5% of List Price

50
INVESTMENT BUYERS DROPPING : 15% MARKET SHARE Long Run Average: 12 % SERIES: 2013 Housing Market Survey SOURCE: CALIFORNIA ASSOCIATION OF REALTORS®

51
BUYING TO RENT V. FLIP; CHANGE IN PREFERRED INVESTMENT STRATEGY 2013: 18% 2014: 30% 2013: 82% 2014: 70% Investment to Flip Rental Property SERIES: 2014 Housing Market Survey SOURCE: CALIFORNIA ASSOCIATION OF REALTORS®

52
REGIONAL & LOCAL HOUSING MARKETS

53
ALAMEDA COUNTY

54
SALES OF RESIDENTIAL HOMES Alameda County, April 2015: 1,228 Units Up 18.0% MTM, Up 3.7% YTY SOURCE: Clarus Market Metrics

55
MEDIAN PRICE OF RESIDENTIAL HOMES Alameda County, April 2015: $660,000 Up 3.4% MTM, Up 13.8% YTY SOURCE: Clarus Market Metrics

56
FOR SALE PROPERTIES Alameda County, April 2015: 2,931 Units Up 7.9% MTM, Down 14.7% YTY Note: “For Sale Properties” represents the overall supply that exist throughout the entire month, including any listings that appear as “Active” any point in time during the month. SOURCE: Clarus Market Metrics

57
MONTH’S SUPPLY OF INVENTORY Alameda County, April 2015: 0.9 Months Note: “Month’s Supply of Inventory” represents the number of months it would take to sell the remaining inventory for the month in question. The remaining inventory for the month is defined as the number of properties that were “For Sale” on the last day of the month in question. The inventory figure is then divided by the number of properties that went Under Contract during the month. SOURCE: Clarus Market Metrics

58
CONTRA COSTA COUNTY

59
SALES OF RESIDENTIAL HOMES Contra Costa County, April 2015: 1,243 Units Up 14.0% MTM, Up 4.5% YTY SOURCE: Clarus Market Metrics

60
MEDIAN PRICE OF RESIDENTIAL HOMES Contra Costa County, April 2015: $495,000 Up 5.0% MTM, Up 6.7% YTY SOURCE: Clarus Market Metrics

61
FOR SALE PROPERTIES Contra Costa County, April 2015: 3,312 Units Up 4.2% MTM, Down 8.5% YTY SOURCE: Clarus Market Metrics Note: “For Sale Properties” represents the overall supply that exist throughout the entire month, including any listings that appear as “Active” any point in time during the month.

62
MONTH’S SUPPLY OF INVENTORY Contra Costa County, April 2015: 1.1 Months Note: “Month’s Supply of Inventory” represents the number of months it would take to sell the remaining inventory for the month in question. The remaining inventory for the month is defined as the number of properties that were “For Sale” on the last day of the month in question. The inventory figure is then divided by the number of properties that went Under Contract during the month. SOURCE: Clarus Market Metrics

63
OAKLAND

64
SALES OF RESIDENTIAL HOMES Oakland, April 2015: 286 Units Up 7.5% MTM, Down 11.5% YTY SOURCE: Clarus Market Metrics

65
MEDIAN PRICE OF RESIDENTIAL HOMES Oakland, April 2015: $600,000 Up 24.4% MTM, Up 29.0% YTY SOURCE: Clarus Market Metrics

66
FOR SALE PROPERTIES Oakland, April 2015: 803 Units Up 6.6% MTM, Down 20.9% YTY SOURCE: Clarus Market Metrics Note: “For Sale Properties” represents the overall supply that exist throughout the entire month, including any listings that appear as “Active” any point in time during the month.

67
MONTH’S SUPPLY OF INVENTORY Oakland, April 2015: 1.0 Months SOURCE: Clarus Market Metrics Note: “Month’s Supply of Inventory” represents the number of months it would take to sell the remaining inventory for the month in question. The remaining inventory for the month is defined as the number of properties that were “For Sale” on the last day of the month in question. The inventory figure is then divided by the number of properties that went Under Contract during the month.

68
BERKELEY

69
SALES OF RESIDENTIAL HOMES Berkeley, April 2015: 57 Units Even 0% MTM, Up 7.5% YTY SOURCE: Clarus Market Metrics

70
MEDIAN PRICE OF RESIDENTIAL HOMES Berkeley, April 2015: $1,000,000 Up 3.6% MTM, Up 4.2% YTY SOURCE: Clarus Market Metrics

71
FOR SALE PROPERTIES Berkeley, April 2015: 115 Units Down 5.7% MTM, Down 20.1% YTY Note: “For Sale Properties” represents the overall supply that exist throughout the entire month, including any listings that appear as “Active” any point in time during the month. SOURCE: Clarus Market Metrics

72
MONTH’S SUPPLY OF INVENTORY Berkeley, April 2015: 0.7 Months Note: “Month’s Supply of Inventory” represents the number of months it would take to sell the remaining inventory for the month in question. The remaining inventory for the month is defined as the number of properties that were “For Sale” on the last day of the month in question. The inventory figure is then divided by the number of properties that went Under Contract during the month. SOURCE: Clarus Market Metrics

73
CITY OF ALAMEDA

74
SALES OF RESIDENTIAL HOMES City of Alameda, April 2015: 45 Units Up 15.4% MTM, Up 25.0% YTY SOURCE: Clarus Market Metrics

75
MEDIAN PRICE OF RESIDENTIAL HOMES City of Alameda, April 2015: $788,000 Up 1.0% MTM, Up 9.7% YTY SOURCE: Clarus Market Metrics

76
FOR SALE PROPERTIES City of Alameda, April 2015: 100 Units Up 23.5% MTM, Up 12.4% YTY SOURCE: Clarus Market Metrics Note: “For Sale Properties” represents the overall supply that exist throughout the entire month, including any listings that appear as “Active” any point in time during the month.

77
MONTH’S SUPPLY OF INVENTORY City of Alameda, April 2015: 0.6 Months Note: “Month’s Supply of Inventory” represents the number of months it would take to sell the remaining inventory for the month in question. The remaining inventory for the month is defined as the number of properties that were “For Sale” on the last day of the month in question. The inventory figure is then divided by the number of properties that went Under Contract during the month. SOURCE: Clarus Market Metrics

78
2015 FORECAST

79
CALIFORNIA HOUSING MARKET OUTLOOK SERIES: CA Housing Market Outlook SOURCE: CALIFORNIA ASSOCIATION OF REALTORS®

80
HOUSING AFFORDABILITY: CRISIS BREWING

81
CALIFORNIA PRICES MORE VOLATILE AND HIGHER THAN THE NATION 1970-2014 SOURCE: CALIFORNIA ASSOCIATION OF REALTORS® SERIES: Median Price of Existing Single Family Homes SOURCE: CALIFORNIA ASSOCIATION OF REALTORS® 2014 Dollar Value

82
HOUSING AFFORDABILITY DOWN SHARPLY SINCE Q1 2012 California vs. U.S. – 1984-2014 % OF HOUSEHOLDS THAT CAN BUY A MEDIAN-PRICED HOME SERIES: Housing Affordability Index of Traditional Buyers SOURCE: CALIFORNIA ASSOCIATION OF REALTORS® AnnualQuarterly

83
IN MOST COUNTIES FEWER THAN 1 IN 3 HOUSEHOLDS QUALIFY SERIES: Housing Affordability Index SOURCE: CALIFORNIA ASSOCIATION OF REALTORS® HAI % able to purchase median priced home 2014 Q4

84
INCOME TO BUY MEDIAN-PRICED HOME IN CA: UP SHARPLY IN TWO Change in minimum required income: $37,269 Increase in income attributed to interest rate increase: $836 (2.2% of total change) Increase in income attributed to price increase : $36,433 (97.8% of total change) SERIES: Housing Affordability Index SOURCE: CALIFORNIA ASSOCIATION OF REALTORS®
 Increase in income attributed to price increase : $36,433 (97.8% of total change) SERIES: Housing Affordability Index SOURCE: CALIFORNIA ASSOCIATION OF REALTORS®")
85
HOW WAGES MEASURED AGAINST INCOME REQUIRED TO BUY A HOME SOURCE: Bureau of Labor Statistics, C.A.R. Annual Mean Wage Los Angeles

86
SHARE OF FIRST-TIME BUYERS UP IN ’14 BUT STILL BELOW LONG-RUN AVERAGE Long Run Average = 38% QUESTION: Was the buyer a first-time buyer? SERIES: 2014 Housing Market Survey SOURCE: CALIFORNIA ASSOCIATION OF REALTORS®

87
HOMEOWNERSHIP RATES STABILIZING AFTER A LARGE DROP California Vs. U.S. SERIES: Homeownership Rates SOURCE: U.S. Census Bureau

88
HOMEOWNERSHIP RATE BY AGE OF HOUSEHOLDER SOURCE: Census Bureau

89
“MISSING” 100,000 UNITS ANNUALLY, AT LEAST 2014p: 83,000 (43,000 sf, 40,000 mf) 2015f: 101,000 total units SERIES: New Housing Permits SOURCE: Construction Industry Research Board Household Growth: 165,000/yr
 2015f: 101,000 total units SERIES: New Housing Permits SOURCE: Construction Industry Research Board Household Growth: 165,000/yr")
90
HOUSING CONSTRUCTION HAS SLOWED IN THE CALIFORNIA’S COASTAL METROS Total Number of SFH Building Permits by Region SERIES: New Single Family Housing Permits SOURCE: Construction Industry Research Board

91
FICO SCORE AT ORIGINATION FOR PURCHASE LOANS

92
1.5 MILLION PURCHASE LOANS MISSING DUE TO LACK OF CREDIT AVAILABILITY

93
LENDING STANDARD DROVE 50% OF THE DECLINE BETWEEN 2001 AND 2012

94
NUMBER OF HOUSEHOLDS LOST IN THE GREAT RECESSION SOURCE: California Dept. of Finance; compiled by C.A.R.

95
CALIFORNIA’S HOUSING DILEMMA Even with everything (or at least most things) going right, our homeownership market is in trouble… The rental market, even with the conversion of 500,000 SFH’s, is still exhibiting inadequate supply and rising rents CA Housing Needs = Minimally 165,000 Units Annually – Regulatory Problem – Impact Fees – Public Attitudes
 going right, our homeownership market is in trouble… The rental market, even with the conversion of 500,000 SFH’s, is still exhibiting inadequate supply and rising rents CA Housing Needs = Minimally 165,000 Units Annually – Regulatory Problem – Impact Fees – Public Attitudes")
96
THE FINANCE HELPLINE finance.car.org (213)739-8383 financehelpline@car.org
")
97
DOWN PAYMENT RESOURCE DIRECTORY DOWNPAYMENT.CAR.ORG Down Payment Resource™ Homeownership Program Index’s Key Findings: Over 300 programs in California 59% provide direct down payment & closing cost assistance 10% provide mortgage credit up to $2,000 for the life of the loan 26% are available to repeat buyers There are hundreds of homeownership programs available to help motivate buyers. Visit downpayment.car.org to find them.

98
INTERNATIONAL BUYERS MAKE THEIR MARK

99
1/3 FROM CHINA Please tell us about your last closed transaction with an international client. What is your client’s country of permanent residence?

100
INTENDED USE FOR PROPERTY? HOME What was the intended use of the property in your last closed transaction with an international client?

101
ALL CASH INTERNATIONAL BUYERS SOURCE: 2013 International Client Survey, 2013 Annual Housing Market Survey How did your last international buyer pay for the property?

102
MILLENNIALS: TOMORROW’S HOME OWNERS?

103
OVER 1/3 LIVE WITH THEIR PARENTS What is your current living situation? SERIES: 2014 Millennials Survey SOURCE: CALIFORNIA ASSOCIATION OF REALTORS®

104
ATTITUDE TOWARD THE HOME BUYING PROCESS – MIXED RESULTS SOURCE: How would you describe your attitude towards the home buying process? C.A.R. 2014 Millennial Survey

105
MOST MILLENNIALS UNCERTAIN/DOUBTFUL THAT THEY COULD OBTAIN A MORTGAGE NOW?AMILLENNIAL ETHNICITY SOURCE: C.A.R. 2014 Millennial Survey Q: Could you obtain a mortgage if you applied now ?

106
PEOPLE WOULD PREFER THE FOLLOWING OVER GOING THROUGH THE HOME MORTGAGE PROCESS AGAIN: SOURCE: Guaranteed Rate Mortgage Survey of 1,000 adults 25 and older USA Today April 2014

107
STAY CONNECTED WITH RESEARCH CARResearchGroup CARResearchInfo On.car.org/CARResearch Housingmatters.car.org

108
Understanding California Home Buyers Understanding California Home Buyers Thursday, May 28, 2015 2:00 PM – 3:00 PM To register: WWW. CAR.ORG/MARKETDATA/VIDEOS WWW. CAR.ORG/MARKETDATA/VIDEOS JOIN US FOR OUR NEXT WEBINAR…

109
2015 Book Recommendations

112
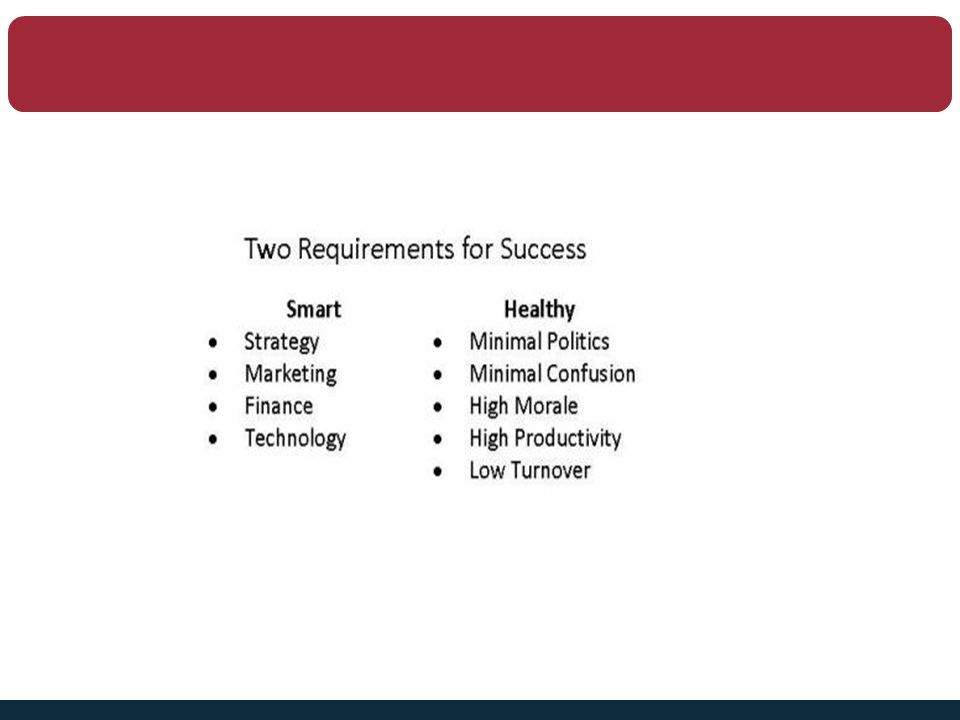
WHAT IS A HEALTHY ORGANIZATION? Smart is permission to play – no company has a comparative advantage based on knowledge anymore Healthy is simple; not complicated or sophisticated Not easy to quantify – but its everything It’s the single most untapped competitive advantage Transformational opportunity

114
THANK YOU! www.car.org/marketdata lesliea@car.org Facebook: CARResearchgroup Twitter: CARResearchInfo This presentation can be found on www.car.org/marketdata Speeches & Presentations

Similar presentations


 forbid the unauthorized reproduction of this report by any means, including.>")


 forbid the unauthorized reproduction of this report by any means, including facsimile.>")