Download presentation
Presentation is loading. Please wait.

1
Aggregate Demand and Aggregate Supply 12 McGraw-Hill/Irwin Copyright © 2012 by The McGraw-Hill Companies, Inc. All rights reserved.

2
Aggregate Demand Real GDP desired at each price level Inverse relationship Real balances effect Interest effect Foreign purchases effect LO1 12-2

3
Aggregate Demand Real domestic output, GDP Price level AD LO1 0 12-3

4
Changes in Aggregate Demand Determinants of aggregate demand Shift factors affecting C, I, G, X n 2 components involved Change in one of the determinants Multiplier effect LO1 12-4

5
Changes in Aggregate Demand Real domestic output, GDP Price level AD 1 AD 3 AD 2 LO1 0 12-5

6
Consumer Spending Consumer wealth Household borrowing Consumer expectations Personal taxes LO1 12-6

7
Investment Spending Real interest rates Expected returns Expectations about future business conditions Technology Degree of excess capacity Business taxes LO1 12-7

8
Government Spending Government spending increases Aggregate demand increases (as long as interest rates and tax rates do not change) More transportation projects Government spending decreases Aggregate demand decreases Less military spending LO1 12-8
 More transportation projects Government spending decreases Aggregate demand decreases Less military spending LO1 12-8")
9
Net Export Spending National income abroad Exchange rates Dollar depreciation Dollar appreciation LO1 12-9

10
Aggregate Supply Total real output produced at each price level Relationship depends on time horizon Immediate short run Short run Long run LO2 12-10

11
AS: Immediate Short Run Real domestic output, GDP Price level AS ISR QfQf Immediate-short-run aggregate supply P1P1 0 LO2 12-11

12
Aggregate Supply: Short Run Real domestic output, GDP Price level 0 QfQf AS Aggregate supply (short run) LO2 12-12
 LO")
13
Aggregate Supply: Long Run Real domestic output, GDP Price level AS LR QfQf 0 Long-run aggregate supply LO2 12-13

14
Changes in Aggregate Supply Determinants of aggregate supply Shift factors Collectively position the AS curve Changes raise or lower per-unit production costs LO2 12-14

15
Changes in Aggregate Supply Real domestic output, GDP Price level AS 1 AS 3 AS 2 0 LO2 12-15

16
Input Prices Domestic resource prices Labor Capital Land Prices of imported resources Imported oil Exchange rates LO2 12-16

17
Productivity Real output per unit of input Increases in productivity reduce costs Decreases in productivity increase costs LO2 Per-unit production cost = total input cost total output Productivity = total output total inputs 12-17

18
Legal-Institutional Environment Legal changes alter per-unit costs of output Taxes and subsidies Extent of government regulation LO2 12-18

19
Equilibrium Real domestic output, GDP (billions of dollars) Price level (index numbers) 100 92 502510514 a b AD AS Real Output Demanded (Billions) Price Level (Index Number) Real Output Supplied (Billions) $506108$513 508104 512 510100 510 51296 507 51492 502 0 LO3 12-19
 Price level (index numbers) a b AD AS Real Output Demanded (Billions) Price Level (Index Number) Real Output Supplied (Billions) $506108$ LO")
20
AD Increases: Demand-Pull Inflation Real domestic output, GDP Price level AD 1 AS P1P1 P2P2 Q2Q2 Q1Q1 QfQf AD 2 0 LO4 12-20

21
Decreases in AD: Recession Real domestic output, GDP Price level AD 1 AS P1P1 P2P2 Q1Q1 Q 2 QfQf AD 2 c a b 0 LO4 12-21

22
Decreases in AD: Recession Prices are downwardly inflexible Fear of price wars Menu costs Wage contracts Efficiency wages Minimum wage law LO4 12-22

23
Decreases in AS: Cost-Push Inflation Real domestic output, GDP Price level AD AS 1 P1P1 P2P2 Q1Q1 QfQf AS 2 a b 0 LO4 12-23

24
Increases in AS: Full-Employment Real domestic output, GDP Price level AD 1 AS 2 P1P1 P2P2 Q 2 Q1Q1 AS 1 b AD 2 c P3P3 Q3Q3 a 0 LO4 12-24

25
Impact of Oil Prices Diminished? 1970’s Reduced AS and negative GDP gap Cost-push inflation Rising unemployment 2000’s Core inflation steady Use 50% less oil and gas today Federal Reserve more vigilant 12-25

26
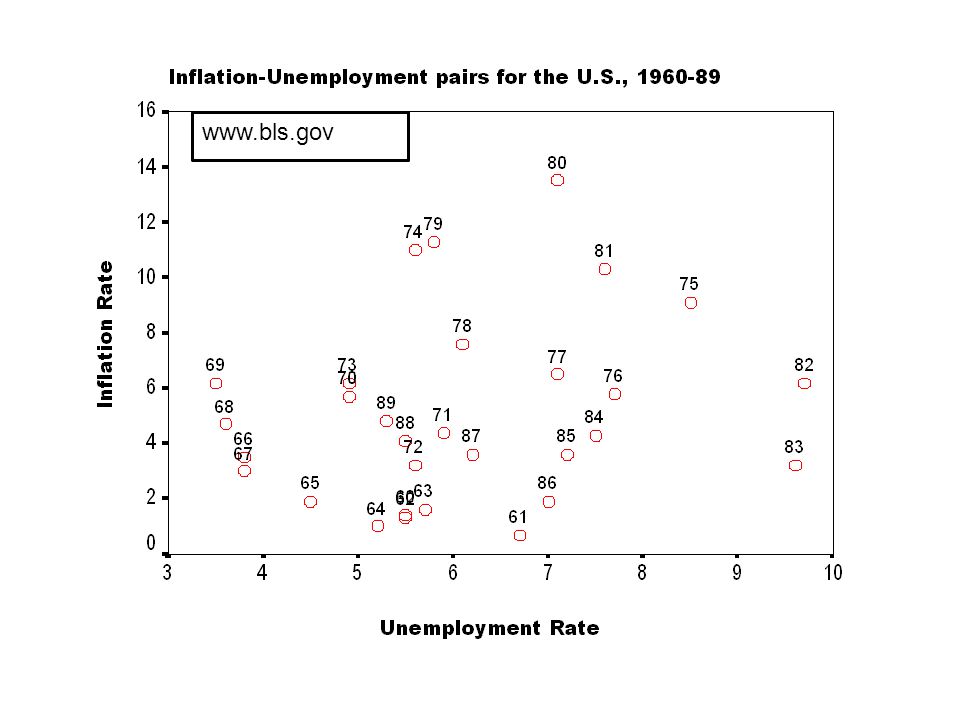
Stagflation is a combination of recession (falling real GDP) and inflation. Now we will show how stagflation could be produced by a supply shock

27
www.bls.gov
28
Price per barrel of 32 0 crude oil Source: Petroleum Economist Anchovies Grain failures

29
Stagflation due to oil price shock 10.09.75 AS 0 AD AS 1 110 115 Real GDP 0 Price Level Story of Joseph Buffer Stock program

Similar presentations


 and Aggregate Supply (AS) Model.>")


 at various price levels A schedule or curve that shows the amounts of.>")


