Download presentation
Presentation is loading. Please wait.

1
Clustering

2
Idea and Applications Clustering is the process of grouping a set of physical or abstract objects into classes of similar objects. It is also called unsupervised learning. It is a common and important task that finds many applications. Applications in Search engines: Structuring search results Suggesting related pages Automatic directory construction/update Finding near identical/duplicate pages Improves recall Increases diversity** Allows disambiguation Recovers missing details

5
(Text Clustering) When & From What
Clustering can be based on: URL source Put pages from the same server together Text Content -Polysemy (“bat”, “banks”) -Multiple aspects of a single topic Links -Look at the connected components in the link graph (A/H analysis can do it) -look at co-citation similarity (e.g. as in collab filtering) Clustering can be done at: Indexing time At query time Applied to documents Applied to snippets
 -Multiple aspects of a single topic. Links. -Look at the connected components in the link graph (A/H analysis can do it) -look at co-citation similarity (e.g. as in collab filtering) Clustering can be done at: Indexing time. At query time. Applied to documents. Applied to snippets.")
6
10/13 Mid-term on Tu (10/18) Closed book and notes
You are allowed one 8.5x11 sheet of hand written notes Calculators ok 10/13 Today’s agenda: Text Clustering continued (Not included in mid-term)
")
7
Clustering issues --Hard vs. Soft clusters --Distance measures
cosine or Jaccard or.. --Cluster quality: Internal measures --intra-cluster tightness --inter-cluster separation External measures --How many points are put in wrong clusters. [From Mooney]

8
General issues in clustering
Inputs/Specs Are the clusters “hard” (each element in one cluster) or “Soft” Hard Clustering=> partitioning Soft Clustering=> subsets.. Do we know how many clusters we are supposed to look for? Max # clusters? Max possibilities of clusterings? What is a good cluster? Are the clusters “close-knit”? Do they have any connection to reality? Sometimes we try to figure out reality by clustering… Importance of notion of distance Sensitivity to outliers?
 or Soft Hard Clustering=> partitioning. Soft Clustering=> subsets.. Do we know how many clusters we are supposed to look for Max # clusters Max possibilities of clusterings What is a good cluster Are the clusters close-knit Do they have any connection to reality Sometimes we try to figure out reality by clustering… Importance of notion of distance. Sensitivity to outliers")
9
Cluster Evaluation “Clusters can be evaluated with “internal” as well as “external” measures Internal measures are related to the inter/intra cluster distance A good clustering is one where (Intra-cluster distance) the sum of distances between objects in the same cluster are minimized, (Inter-cluster distance) while the distances between different clusters are maximized Objective to minimize: F(Intra,Inter) External measures are related to how representative are the current clusters to “true” classes. Measured in terms of purity, entropy or F-measure Note that in real world, you often don’t know what the true classes are. (This is why clustering is called unsupervised learning)
 the sum of distances between objects in the same cluster are minimized, (Inter-cluster distance) while the distances between different clusters are maximized. Objective to minimize: F(Intra,Inter) External measures are related to how representative are the current clusters to true classes. Measured in terms of purity, entropy or F-measure. Note that in real world, you often don’t know what the true classes are. (This is why clustering is called unsupervised learning)")
10
Inter/Intra Cluster Distances
Inter-cluster distance Sum the (squared) distance between all pairs of clusters Where distance between two clusters is defined as: distance between their centroids/medoids Distance between farthest pair of points (complete link) Distance between the closest pair of points belonging to the clusters (single link) Intra-cluster distance/tightness (Sum/Min/Max/Avg) the (absolute/squared) distance between All pairs of points in the cluster OR “diameter”—two farthest points Between the centroid /medoid and all points in the cluster Letter grades and Single vs. Complete link Red: Single-link Black: complete-link
 distance between all pairs of clusters. Where distance between two clusters is defined as: distance between their centroids/medoids. Distance between farthest pair of points (complete link) Distance between the closest pair of points belonging to the clusters (single link) Intra-cluster distance/tightness. (Sum/Min/Max/Avg) the (absolute/squared) distance between. All pairs of points in the cluster OR. diameter —two farthest points. Between the centroid /medoid and all points in the cluster. Letter grades and Single vs. Complete link. Red: Single-link. Black: complete-link.")
11
Cluster Evaluation “Clusters can be evaluated with “internal” as well as “external” measures Internal measures are related to the inter/intra cluster distance A good clustering is one where (Intra-cluster distance) the sum of distances between objects in the same cluster are minimized, (Inter-cluster distance) while the distances between different clusters are maximized Objective to minimize: F(Intra,Inter) External measures are related to how representative are the current clusters to “true” classes. Measured in terms of purity, entropy or F-measure
 the sum of distances between objects in the same cluster are minimized, (Inter-cluster distance) while the distances between different clusters are maximized. Objective to minimize: F(Intra,Inter) External measures are related to how representative are the current clusters to true classes. Measured in terms of purity, entropy or F-measure.")
12
Cluster Purity (given Gold Standard classes)
Cluster I Cluster II Cluster III Pure size of a cluster = # elements from the majority class Sum of pure sizes of clusters Total number of elements across clusters Purity of clustering: Will it work if you allow # of clusters to increase? = ( )/ ( ) = 12/17 = 0.71
/ ( ) = 12/17 =")
13
Rand-Index: Precision/Recall based
How many couplings did you preserve/break? Rand-Index: Precision/Recall based Compare to Standard Precision & Recall The following table classifies all pairs of entities (of which there are n choose 2) into One of four classes Is the cluster putting non-class items in? TN FP Different classes in ground truth FN TP Same class in ground truth Clusters in clustering Same Cluster in Number of points Is the cluster missing any in-class items?
 into. One of four classes. Is the cluster. putting non-class. items in TN. FP. Different. classes in. ground truth. FN. TP. Same class. in ground. truth. Clusters in. clustering. Same. Cluster in. Number of. points. Is the cluster. missing any in-class items")
14
Rand-Index Example Cluster I
Cluster I Cluster II Cluster III RI= 20+72/( ) =0.68 Elementary combinatorics TP+FP (total pairs in the same clusters) = 6 C C C 2 = 40 To get TP = 5 C C C C 2 = 20 You can compute FN/TN simlarly
 =0.68. Elementary combinatorics. TP+FP (total pairs in the same clusters) = 6 C C C 2 = 40. To get TP. = 5 C C C C 2 = 20. You can compute FN/TN simlarly.")
15
Unsupervised? Clustering is normally seen as an instance of unsupervised learning algorithm So how can you have external measures of cluster validity? The truth is that you have a continuum between unsupervised vs. supervised Answer: Think of “no teacher being there” vs. “lazy teacher” who checks your work once in a while. Examples: Fully unsupervised (no teacher) Teacher tells you how many clusters are there Teacher tells you that certain pairs of points will fall or will not fill in the same cluster Teacher may occasionally evaluate the goodness of your clusters (external measures of validity)
 Teacher tells you how many clusters are there. Teacher tells you that certain pairs of points will fall or will not fill in the same cluster. Teacher may occasionally evaluate the goodness of your clusters (external measures of validity)")
16
How hard is clustering? One idea is to consider all possible clusterings, and pick the one that has best inter and intra cluster distance properties Suppose we are given n points, and would like to cluster them into k-clusters How many possible clusterings? Too hard to do it brute force or optimally Solution: Iterative optimization algorithms Start with a clustering, iteratively improve it (eg. K-means)
")
17
Classical clustering methods
Partitioning methods k-Means (and EM), k-Medoids Hierarchical methods agglomerative, divisive, BIRCH Model-based clustering methods
, k-Medoids. Hierarchical methods. agglomerative, divisive, BIRCH. Model-based clustering methods.")
18
Properties of Vector Similarity as a distance measure for text clusterings
Similarity between a doc and the centroid is equal to avg similarity between that doc and every other doc Average similarity between all pairs of documents is equal to the square of centroid’s magnitude.

19
K-means Works when we know k, the number of clusters we want to find
Idea: Randomly pick k points as the “centroids” of the k clusters Loop: For each point, put the point in the cluster to whose centroid it is closest Recompute the cluster centroids Repeat loop (until there is no change in clusters between two consecutive iterations.) Iterative improvement of the objective function: Sum of the squared distance from each point to the centroid of its cluster (Notice that since K is fixed, maximizing tightness also maximizes inter-cluster distance)
 Iterative improvement of the objective function: Sum of the squared distance from each point to the centroid of its cluster. (Notice that since K is fixed, maximizing tightness also maximizes inter-cluster. distance)")
20
K Means Example (K=2) Pick seeds Reassign clusters Compute centroids
Reasssign clusters x Compute centroids Reassign clusters Converged! [From Mooney]

21
What is K-Means Optimizing?
Define goodness measure of cluster k as sum of squared distances from cluster centroid: Gk = Σi (di – ck) (sum over all di in cluster k) G = Σk Gk Reassignment monotonically decreases G since each vector is assigned to the closest centroid. Is it global optimum? No.. because each node independently decides whether or not to shift clusters; sometimes there may be a better clustering but you need a set of nodes to simultaneously shift clusters to reach that.. (Mass Democrats moving en block to AZ example). What cluster shapes will have the lowest sum of squared distances to the centroid? Is it global optimum? No.. because each node independently decides whether or not to shift clusters; sometimes there may be a better clustering but you need a set of nodes to simultaneously shift clusters to reach that.. (MA Democrats moving en block to AZ example). Spheres… But what if the real data doesn’t have spherical clusters? (We will still find them!)
2 (sum over all di in cluster k) G = Σk Gk. Reassignment monotonically decreases G since each vector is assigned to the closest centroid. Is it global optimum No.. because each node independently decides whether or not to shift clusters; sometimes there may be a better clustering but you need a set of nodes to simultaneously shift clusters to reach that.. (Mass Democrats moving en block to AZ example). What cluster shapes will have the lowest sum of squared distances to the centroid Is it global optimum No.. because each node independently decides whether or not to shift clusters; sometimes there may be a better clustering but you need a set of nodes to simultaneously shift clusters to reach that.. (MA Democrats moving en block to AZ example). Spheres… But what if the real data doesn’t have spherical clusters (We will still find them!)")
22
K-means Example For simplicity, 1-dimension objects and k=2.
Numerical difference is used as the distance Objects: 1, 2, 5, 6,7 K-means: Randomly select 5 and 6 as centroids; => Two clusters {1,2,5} and {6,7}; meanC1=8/3, meanC2=6.5 => {1,2}, {5,6,7}; meanC1=1.5, meanC2=6 => no change. Aggregate dissimilarity (sum of squares of distanceeach point of each cluster from its cluster center--(intra-cluster distance) = = 2.5 |1-1.5|2
 = = 2.5. |1-1.5|2.")
23
Example of K-means in operation
[From Hand et. Al.]

24
Vector Quantization: K-means as Compression

25
10/20

26
Variations on K-means Recompute the centroid after every (or few) changes (rather than after all the points are re-assigned) Improves convergence speed Starting centroids (seeds) change which local minima we converge to, as well as the rate of convergence Use heuristics to pick good seeds Can use another cheap clustering over random sample Run K-means M times and pick the best clustering that results Bisecting K-means takes this idea further… Lowest aggregate Dissimilarity (intra-cluster distance)
 change which local minima we converge to, as well as the rate of convergence. Use heuristics to pick good seeds. Can use another cheap clustering over random sample. Run K-means M times and pick the best clustering that results. Bisecting K-means takes this idea further… Lowest aggregate. Dissimilarity. (intra-cluster. distance)")
27
Why not the minimum value?
Problems with K-means Why not the minimum value? Need to know k in advance Could try out several k? Cluster tightness increases with increasing K. Look for a kink in the tightness vs. K curve Tends to go to local minima that are sensitive to the starting centroids Try out multiple starting points Disjoint and exhaustive Doesn’t have a notion of “outliers” Outlier problem can be handled by K-medoid or neighborhood-based algorithms Assumes clusters are spherical in vector space Sensitive to coordinate changes, weighting etc.

28
Looking for knees in the sum of intra-cluster dissimilarity
The problem is that Comparing G values across different clustering sizes (k) is apple/organge comparison Once k is allowed to change we need to also consider inter-cluster distance that is not captured by G
 is apple/organge. comparison. Once k is allowed. to change we need. to also consider. inter-cluster distance. that is not captured by G.")
29
Penalize lots of clusters
For each cluster, we have a Cost C. Thus for a clustering with K clusters, the Total Cost is KC. Define the Value of a clustering to be = Total Benefit - Total Cost. Find the clustering of highest value, over all choices of K. Total benefit increases with increasing K. But can stop when it doesn’t increase by “much”. The Cost term enforces this.

30
Problems with K-means Need to know k in advance
Could try out several k? Cluster tightness increases with increasing K. Look for a kink in the tightness vs. K curve Tends to go to local minima that are sensitive to the starting centroids Try out multiple starting points Disjoint and exhaustive Doesn’t have a notion of “outliers” Outlier problem can be handled by K-medoid or neighborhood-based algorithms Assumes clusters are spherical in vector space Sensitive to coordinate changes, weighting etc. Example showing sensitivity to seeds In the above, if you start with B and E as centroids you converge to {A,B,C} and {D,E,F} If you start with D and F you converge to {A,B,D,E} {C,F}

31
Time Complexity Assume computing distance between two instances is O(m) where m is the dimensionality of the vectors. Reassigning clusters: O(kn) distance computations, or O(knm). Computing centroids: Each instance vector gets added once to some centroid: O(nm). Assume these two steps are each done once for I iterations: O(Iknm). Linear in all relevant factors, assuming a fixed number of iterations, more efficient than O(n2) HAC (to come next)
 distance computations, or O(knm). Computing centroids: Each instance vector gets added once to some centroid: O(nm). Assume these two steps are each done once for I iterations: O(Iknm). Linear in all relevant factors, assuming a fixed number of iterations, more efficient than O(n2) HAC (to come next)")
32
Hierarchical Clustering Techniques
Generate a nested (multi-resolution) sequence of clusters Two types of algorithms Divisive Start with one cluster and recursively subdivide Bisecting K-means is an example! Agglomerative (HAC) Start with data points as single point clusters, and recursively merge the closest clusters “Dendogram”
 sequence of clusters. Two types of algorithms. Divisive. Start with one cluster and recursively subdivide. Bisecting K-means is an example! Agglomerative (HAC) Start with data points as single point clusters, and recursively merge the closest clusters. Dendogram")
33
Bisecting K-means For I=1 to k-1 do{ Pick a leaf cluster C to split
Hybrid method 1 Can pick the largest Cluster or the cluster With lowest average similarity For I=1 to k-1 do{ Pick a leaf cluster C to split For J=1 to ITER do{ Use K-means to split C into two sub-clusters, C1 and C2 Choose the best of the above splits and make it permanent} } Divisive hierarchical clustering method uses K-means

34
Hierarchical Clustering Techniques
Generate a nested (multi-resolution) sequence of clusters Two types of algorithms Divisive Start with one cluster and recursively subdivide Bisecting K-means is an example! Agglomerative (HAC) Start with data points as single point clusters, and recursively merge the closest clusters “Dendogram”
 sequence of clusters. Two types of algorithms. Divisive. Start with one cluster and recursively subdivide. Bisecting K-means is an example! Agglomerative (HAC) Start with data points as single point clusters, and recursively merge the closest clusters. Dendogram")
35
Hierarchical Agglomerative Clustering Example
{Put every point in a cluster by itself. For I=1 to N-1 do{ let C1 and C2 be the most mergeable pair of clusters (defined as the two closest clusters) Create C1,2 as parent of C1 and C2} Example: For simplicity, we still use 1-dimensional objects. Numerical difference is used as the distance Objects: 1, 2, 5, 6,7 agglomerative clustering: find two closest objects and merge; => {1,2}, so we have now {1.5,5, 6,7}; => {1,2}, {5,6}, so {1.5, 5.5,7}; => {1,2}, {{5,6},7}. Qn: What should be the distance between two clusters (or a cluster and a point) Single-link (closest two points); multi-link (farthest two points)… 1 2 5 6 7
 Create C1,2 as parent of C1 and C2} Example: For simplicity, we still use 1-dimensional objects. Numerical difference is used as the distance. Objects: 1, 2, 5, 6,7. agglomerative clustering: find two closest objects and merge; => {1,2}, so we have now {1.5,5, 6,7}; => {1,2}, {5,6}, so {1.5, 5.5,7}; => {1,2}, {{5,6},7}. Qn: What should be the distance between two clusters (or a cluster and a point) Single-link (closest two points); multi-link (farthest two points)…")
36
Single Link Example

37
Complete Link Example

38
Impact of cluster distance measures
“Single-Link” (inter-cluster distance= distance between closest pair of points) “Complete-Link” (inter-cluster distance= distance between farthest pair of points) [From Mooney]
 Complete-Link (inter-cluster distance= distance between farthest pair of points) [From Mooney]")
39
Group-average Similarity based clustering
Instead of single or complete link, we can consider cluster distance in terms of average distance of all pairs of points from each cluster Problem: n*m similarity computations Thankfully, this is much easier with cosine similarity… (but only with cosine similarity)
")
40
Group-average Similarity based clustering
Instead of single or complete link, we can consider cluster distance in terms of average distance of all pairs of points from each cluster Problem: n*m similarity computations Thankfully, this is much easier with cosine similarity! Average similarity between all pairs of documents is equal to the square of centroid’s magnitude.

41
Properties of HAC Creates a complete binary tree (“Dendogram”) of clusters Various ways to determine mergeability “Single-link”—distance between closest neighbors “Complete-link”—distance between farthest neighbors “Group-average”—average distance between all pairs of neighbors “Centroid distance”—distance between centroids is the most common measure Deterministic (modulo tie-breaking) Runs in O(N2) time
 Runs in O(N2) time.")
42
Bisecting K-means (example of Divisive Hierarchical)
Can pick the largest Cluster or the cluster With lowest average similarity For I=1 to k-1 do{ Pick a leaf cluster C to split For J=1 to ITER do{ /*Look for the best split */ Use K-means to split C into two sub-clusters, C1 and C2 Choose the best of the above splits and make it permanent} } Divisive hierarchical clustering method uses K-means

43
Buckshot Algorithm Combines HAC and K-Means clustering.
Hybrid method 2 Cut where You have k clusters Combines HAC and K-Means clustering. First randomly take a sample of instances of size n Run group-average HAC on this sample, which takes only O(n) time. Use the results of HAC as initial seeds for K-means. Overall algorithm is O(n) and avoids problems of bad seed selection. You can use this either to find the best seeds for K-means given K, or also decide a reasonable K. For the latter, you can decide the level of cluster tightness/similarity you want in each cluster (see x axis in the fig above)
 time. Use the results of HAC as initial seeds for K-means. Overall algorithm is O(n) and avoids problems of bad seed selection. You can use this either to find the best seeds. for K-means given K, or also decide a. reasonable K. For the latter, you can decide. the level of cluster tightness/similarity you. want in each cluster (see x axis in the fig above)")
44
Text Clustering Status
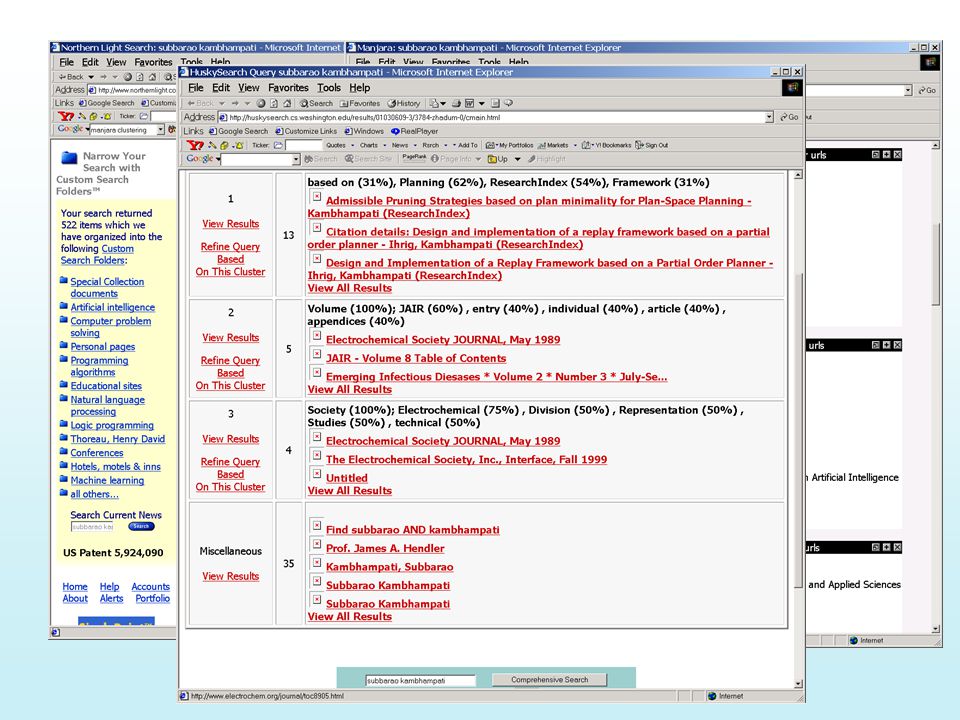
HAC and K-Means have been applied to text in a straightforward way. Typically use normalized, TF/IDF-weighted vectors and cosine similarity. High dimensionality Most vectors in high-D spaces will be orthogonal Do LSI analysis first, project data into the most important m-dimensions, and then do clustering E.g. Manjara Optimize computations for sparse vectors. Applications: During retrieval, add other documents in the same cluster as the initial retrieved documents to improve recall. Clustering of results of retrieval to present more organized results to the user (à la Northernlight folders). Automated production of hierarchical taxonomies of documents for browsing purposes (à la Yahoo & DMOZ).
. Automated production of hierarchical taxonomies of documents for browsing purposes (à la Yahoo & DMOZ).")
45
An idea for getting cluster descriptions
Just as search results need snippets, clusters also need descriptors One idea is to look for most frequently occurring terms in the cluster A better idea is to consider most frequently occurring terms that are least common across clusters. Each cluster is a set of document bags Cluster doc is just the union of these bags Find tf/idf over these cluster bags

46
Didn’t cover after this..

47
Approaches for Outlier Problem
Remove the outliers up-front (in a pre-processing step) “Neighborhood” methods “An outlier is one that has less than d points within e distance” (d, e pre-specified thresholds) Need efficient data structures for keeping track of neighborhood R-trees Use K-Medoid algorithm instead of a K-Means algorithm Median is less sensitive to outliners than mean; but it is costlier to compute than Mean..
 Neighborhood methods. An outlier is one that has less than d points within e distance (d, e pre-specified thresholds) Need efficient data structures for keeping track of neighborhood. R-trees. Use K-Medoid algorithm instead of a K-Means algorithm. Median is less sensitive to outliners than mean; but it is costlier to compute than Mean..")
48
Variations on K-means (contd)
Outlier problem Use K-Medoids Costly! Non-hard clusters Use soft K-means {basically, EM} Let the membership of each data point in a cluster be proportional to its distance from that cluster center Membership weight of elt e in cluster C is set to Exp(-b dist(e; center(C)) Normalize the weight vector Normal K-means takes the max of weights and assigns it to that cluster The cluster center re-computation step is based on the membership We can instead let the cluster center computation be based on the all points, weighted by their membership weight
) Normalize the weight vector. Normal K-means takes the max of weights and assigns it to that cluster. The cluster center re-computation step is based on the membership. We can instead let the cluster center computation be based on the all points, weighted by their membership weight.")
49
K-Means & Expectation Maximization
Added after class discussion; optional K-Means & Expectation Maximization A “model-based” clustering scenario The data points were generated from k Gaussians N(mi,vi) with mean mi and variance vi In this case, clearly the right clustering involves estimating the mi and vi from the data points We can use the following iterative idea: Initialize: guess estimates of mi and vi for all k gaussians Loop (E step): Compute the probability Pij that ith point is generated by jth cluster (which is simply the value of normal distribution N(mj,vj) at the point di ). {Note that after this step, each point will have k probabilities associated with its membership in each of the k clusters) (M step): Revise the estimates of the mean and variance of each of the clusters taking into account the expected membership of each of the points in each of the clusters Repeat It can be proven that the procedure above converges to the true means and variances of the original k Gaussians (Thus recovering the parameters of the generative model) The procedure is a special case of a general schema for probabilistic algorithm schema called “Expectation Maximization” It is easy to see that K-means is a “hard-assignment” Form of EM procedure For recovering the Model parameters
 with mean mi and variance vi. In this case, clearly the right clustering involves estimating the mi and vi from the data points. We can use the following iterative idea: Initialize: guess estimates of mi and vi for all k gaussians. Loop. (E step): Compute the probability Pij that ith point is generated by jth cluster (which is simply the value of normal distribution N(mj,vj) at the point di ). {Note that after this step, each point will have k probabilities associated with its membership in each of the k clusters) (M step): Revise the estimates of the mean and variance of each of the clusters taking into account the expected membership of each of the points in each of the clusters. Repeat. It can be proven that the procedure above converges to the true means and variances of the original k Gaussians (Thus recovering the parameters of the generative model) The procedure is a special case of a general schema for probabilistic algorithm schema called Expectation Maximization It is easy to see that. K-means is a hard-assignment Form of EM procedure. For recovering the. Model parameters.")
50
Semi-supervised variations of K-means
Often we know partial knowledge about the clusters [MODEL] We know the Model that generated the clusters (e.g. the data was generated by a mixture of Gaussians) Clustering here involves just estimating the parameters of the model (e.g. mean and variance of the gaussians, for example) [FEATURES/DISTANCE] We know the “right” similarity metric and/or feature space to describe the points (such that the normal distance norms in that space correspond to real similarity assessments). Almost all approaches assume this. [LOCAL CONSTRAINTS] We may know that the text docs are in two clusters—one related to finance and the other to CS. Moreover, we may know that certain specific docs are CS and certain others are finance Easy to modify K-Means to respect the local constraints (constraints violation can lead to either invalidation of the cluster or just penalize it)
 Clustering here involves just estimating the parameters of the model (e.g. mean and variance of the gaussians, for example) [FEATURES/DISTANCE] We know the right similarity metric and/or feature space to describe the points (such that the normal distance norms in that space correspond to real similarity assessments). Almost all approaches assume this. [LOCAL CONSTRAINTS] We may know that the text docs are in two clusters—one related to finance and the other to CS. Moreover, we may know that certain specific docs are CS and certain others are finance. Easy to modify K-Means to respect the local constraints (constraints violation can lead to either invalidation of the cluster or just penalize it)")
51
Which of these are the best for text?
Bisecting K-means and K-means seem to do better than Agglomerative Clustering techniques for Text document data [Steinbach et al] “Better” is defined in terms of cluster quality Quality measures: Internal: Overall Similarity External: Check how good the clusters are w.r.t. user defined notions of clusters

52
Challenges/Other Ideas
High dimensionality Most vectors in high-D spaces will be orthogonal Do LSI analysis first, project data into the most important m-dimensions, and then do clustering E.g. Manjara Phrase-analysis (a better distance and so a better clustering) Sharing of phrases may be more indicative of similarity than sharing of words (For full WEB, phrasal analysis was too costly, so we went with vector similarity. But for top 100 results of a query, it is possible to do phrasal analysis) Suffix-tree analysis Shingle analysis Using link-structure in clustering A/H analysis based idea of connected components Co-citation analysis Sort of the idea used in Amazon’s collaborative filtering Scalability More important for “global” clustering Can’t do more than one pass; limited memory See the paper Scalable techniques for clustering the web Locality sensitive hashing is used to make similar documents collide to same buckets
 Sharing of phrases may be more indicative of similarity than sharing of words. (For full WEB, phrasal analysis was too costly, so we went with vector similarity. But for top 100 results of a query, it is possible to do phrasal analysis) Suffix-tree analysis. Shingle analysis. Using link-structure in clustering. A/H analysis based idea of connected components. Co-citation analysis. Sort of the idea used in Amazon’s collaborative filtering. Scalability. More important for global clustering. Can’t do more than one pass; limited memory. See the paper. Scalable techniques for clustering the web. Locality sensitive hashing is used to make similar documents collide to same buckets.")
53
Phrase-analysis based similarity
(using suffix trees)
")
Similar presentations


>")


>")


 May 12, 2010>")