Download presentation
Presentation is loading. Please wait.

1
Managing Drought and Water Scarcity in Vulnerable Environments: Creating a Roadmap for Change in the United States

2
Donald A. Wilhite, Director National Drought Mitigation Center Professor, School of Natural Resources University of Nebraska-Lincoln

3
doesn’t get respect! It’s the Rodney Dangerfield of natural hazards! Drought commonly affects >30% of the nation Annual impacts $6-8 billion (FEMA; 1995 $$) Increasing vulnerability $30 billion in drought relief since 1988 Crop insurance payments more than $10 billion from 1996- 2005
 Increasing vulnerability $30 billion in drought relief since 1988 Crop insurance payments more than $10 billion from")
4
National Drought Mitigation Center Mission: To lessen societal vulnerability to drought by promoting planning and the adoption of appropriate risk management techniques.

5
Conference Goals To create an integrated, interactive, future- oriented forum for understanding and improving our management of drought and water scarcity in the U.S. To stimulate national debate through the publication and wide distribution of a science- and policy-based discussion document, i.e. “Roadmap for Change.”

6
Participatory meeting Engaging the broad range of stakeholders Plenary sessions World Café Breakout sessions Poster sessions Discussion/brainstorming sessions

7
Agriculture Livestock Range/pasture Row & specialty crops

13
1930s1950s % Area Affected Drought is a normal part of climate.

16
Drought is a national issue!

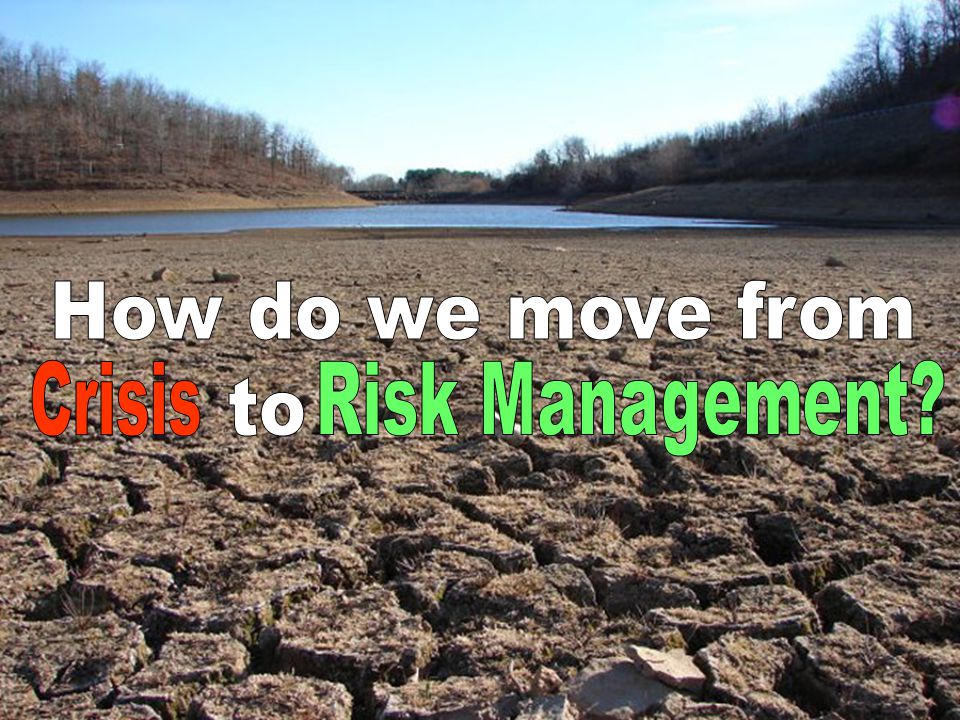
17
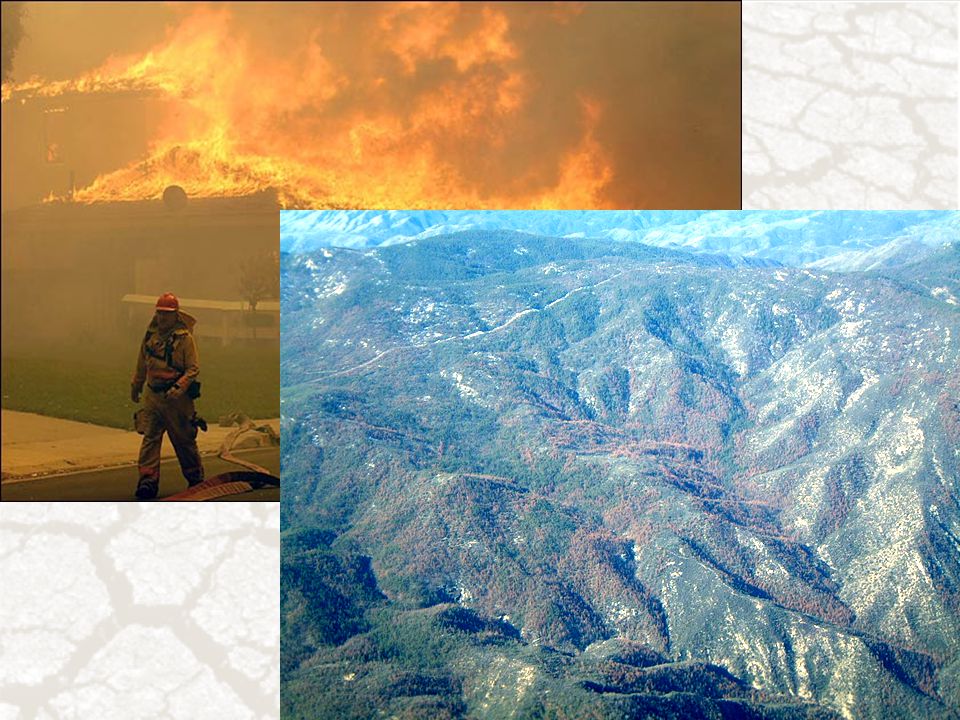
Crisis Management

19
Components of Drought Risk Management (social factors) (natural event) Exposure (Static or Dynamic?) Static or Dynamic?
 (natural event) Exposure (Static or Dynamic ) Static or Dynamic")
20
What are the ‘takeaway’ messages from the conference?

21
‘Takeaway’ message #1 Increase understanding of the ‘drought hazard’ and how it may be changing in frequency, severity, and duration Improve monitoring/early warning and seasonal forecasts NIDIS (HR 5136/S 2751) Increase understanding of the causes of drought Incorporate knowledge of paleoclimates in assessments of risk and planning decisions Incorporate projections of climate change in assessment of risk and planning decisions
 Increase understanding of the causes of drought Incorporate knowledge of paleoclimates in assessments of risk and planning decisions Incorporate projections of climate change in assessment of risk and planning decisions")
22
When duration of continental-scale drought is considered, a number of periods in the past show more persistent, widespread drought conditions. Percentage of grid points with PDSI values < -1 annual and 10-year running average Ranked non-overlapping 10-year periods with largest area under PDSI < -1

23
3.6°F 2.7°F 1.8°F 0.9°F cooler warmer Temperature trends (°F per century) since 1920 PNW warmed +1.5 F during the 20 th century
 since 1920 PNW warmed +1.5 F during the 20 th century")
24
Mote P.W.,Hamlet A.F., Clark M.P., Lettenmaier D.P., 2005, Declining mountain snowpack in western North America, BAMS, 86 (1): 39-49 Trends in April 1 SWE 1950-1997
: Trends in April 1 SWE")
25
Portland, Oregon Portland’s water needs by 2040 will increase by 60 mgd, 40 mgd from regional growth; 20 mgd from climate change impacts.

26
‘Takeaway’ message #2 Improve our understanding of how societal vulnerability to drought is changing. Factors influencing societal vulnerability Population growth/changes/migration Urbanization Land use changes Environmental values/awareness Environmental degradation Government policies Technology

27
DroughtFlooding Probability P (x) X (e.g. precipitation, soil moisture, etc.) Coping range Drought vulnerability is a variable. Adapted from work by Barry Smit, University of Guelph Within every society, there is a certain capacity to cope with drought. Societal changes can increase or decrease this coping range.
 Coping range Drought vulnerability is a variable. Adapted from work by Barry Smit, University of Guelph Within every society, there is a certain capacity to cope with drought. Societal changes can increase or decrease this coping range..")
28
66% 40% 28% 26% 31% 30% 21% 20% 23% 20%

29
‘Takeaway’ message #3 Place more emphasis on managing the risks associated with drought. Improve planning and preparedness (all levels) Shift resources from relief to improved monitoring/early warning, preparedness, and mitigation More than $30 billion provided for drought relief since 1988 Relief rewards the lack of planning Reinforces status quo for resource management Must be a gradual transition to risk-based management
 Shift resources from relief to improved monitoring/early warning, preparedness, and mitigation More than $30 billion provided for drought relief since 1988 Relief rewards the lack of planning Reinforces status quo for resource management Must be a gradual transition to risk-based management.")
30
The Cycle of Disaster Management

31
USDA Drought Expenditures FY 1998

32
‘Takeaway’ message #4 Improve our assessment of the broad range of drought impacts. No systematic assessment of impacts No standardized impact assessment methodology Economic impact assessment largely confined to agriculture; no assessment of social or environmental losses Mitigation vs. relief For every $ invested in mitigation, $4 are saved in reduced impacts Reduced need for government intervention in the form of drought relief

33
‘Takeaway’ message #5 Develop a national drought policy that outlines the principles for reducing societal vulnerability to drought. Monitoring/early warning/prediction Risk assessment Planning and preparedness at all levels Local, state, tribal, national Improve coordination within and between levels of government GAO recommended a national drought plan in 1980

34
Guiding Principles of Drought Policy Favor preparedness over insurance, insurance over relief, and incentives over regulation Set research priorities based on potential to reduce impacts Coordinate delivery of federal services through cooperation and collaboration with non- Federal entities (National Drought Policy Commission, 2000)
")
35
‘Takeaway’ message #6 Create a new ‘National Water Culture’ Underpinned by additional drought research, improved monitoring, mitigation, and preparedness Build awareness/Education Change legal and economic policies and institutions Promote sustainable water management practices

36
Subcommittee on Disaster Reduction

37
Where do we go from here? Transcribe the notes/contributions from participants and speakers Finalize outline the ‘Roadmap for Change’ Prepare document Distribute to Congress, OSTP, federal agencies, governors, state legislatures and stakeholders (Spring, 2007)
.")
38
Visit the NDMC drought.unl.edu dwilhite2@unl.edu Thanks!

39
Drought Impact Sectors Agriculture Crop Livestock/range/pasture Forests Production, fire, pests/diseases Energy Transportation Recreation and tourism Wildlife, fisheries Urban water supply And the list goes on and on....

41
Drought @2050 vs Notorious Recent Historical Droughts 2040-2060

Similar presentations


>")


 Michael Hayes,>")


 GEOSS S+T Stakeholder Workshop.>")


