Download presentation
Presentation is loading. Please wait.

1
Climate Change and Malaysia
Numerical Weather Prediction Division Malaysian Meteorological Department

2
Global Warming

3
Figure 1: Global Averaged Surface Temperature
(IPCC AR4 WG1: Physical Science Basis) Twelve of the thirteen years in the period ( ) rank among the top 12 warmest years in the observation record Global temperatures have risen by about 0.74 ºC since the beginning of the 20th century
 Twelve of the thirteen years in the period ( ) rank among the top 12 warmest years in the observation record. Global temperatures have risen by about 0.74 ºC since the beginning of the 20th century.")
4
What causes weather & climate?
INSOLATION [INcoming SOLAR radiATION Differential heating of the earth’s surface The over-riding force that initiates global atmospheric circulation is due to the unequal amount of INcoming SOLar radiATION or "insolation" that reaches the Earth's surface. The diagram on this slide illustrates how intercepted insolation varies across the Earth's surface, where there is a global surplus over the tropics and a global deficit over the poles. It is important to understand how global wind and ocean circulation patterns are generated in order to understand how these circulation patterns have altered throughout time and therefore have changed global climates.

5
Natural Causes of Climate Variation

6
Milankovitch Cycles Variation in Internal Atmospheric Cycles (El Nino Northern Atlantic Oscillation Indian Ocean dipole etc) Variation in Oceanic Circulations Volcanic Eruptions
 Variation in Oceanic. Circulations. Volcanic Eruptions.")
7
Anthropogenic Causes of Climate Variation

8
Anthropogenic Activities
Emissions of greenhouse gases & aerosols Change in land-use Deforestation

10
Malaysia: Present Climate

11
WEST PENINSULAR MALAYSIA (ANNUALPRECIPITATION)
LANGKAWI PETALING JAYA BUTTERWORTH SUBANG

12
EAST PENINSULAR MALAYSIA (ANNUAL PRECIPITATION)
KOTA BARU KUANTAN MERSING KUALA TRENGGANU

13
EAST MALAYSIA (ANNUAL PRECIPITATION)
KOTA KINABALU KUCHING SANDAKAN MIRI

14
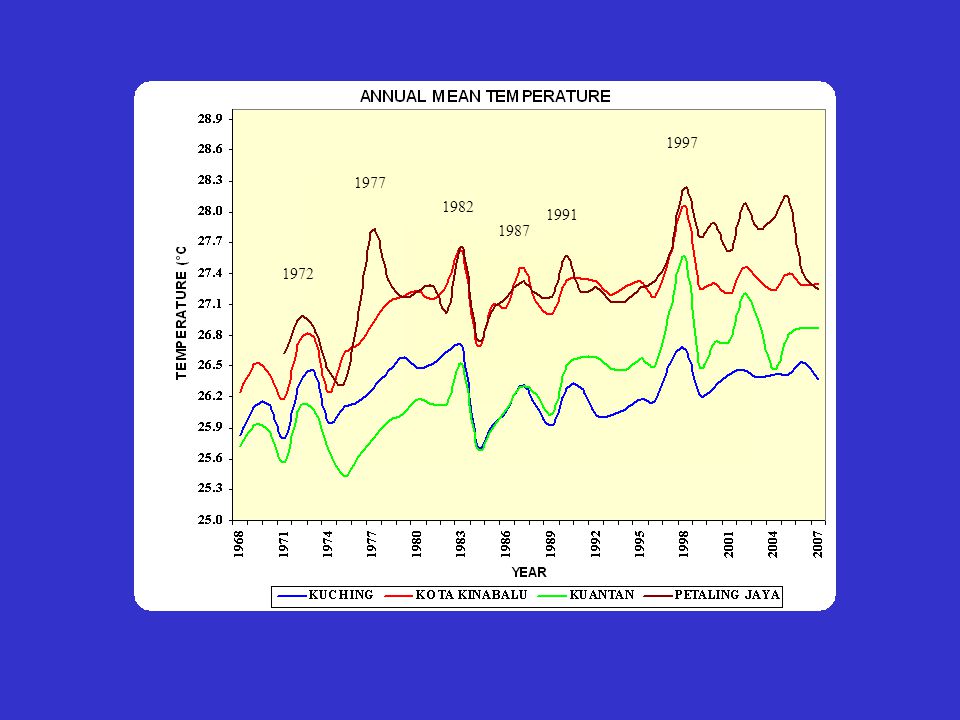
WEST MALAYSIA (MEAN TEMPERATURE)
BUTTERWORTH KOTA BARU PETALING JAYA KUANTAN

15
EAST MALAYSIA (MEAN TEMPERATURE)
KOTA KINABALU KUCHING SANDAKAN MIRI

16
1997 1977 1982 1991 1987 1972
17
Global Climate Simulations

18
Different Emission Scenarios

19
Projected global average temperature changes for the early and late 21st century relative to the period 1980 – 1999, as calculated by multi-model averages for a low (B1), a medium (A1B) and a high SRES scenario for the decades (left) and (right). (IPCC, 2007)
.")
20
Annual Rainfall Changes (%): Nine GCMs Ensemble
Based upon 9 Global Climate Model Ensemble Projection, Temperature Increase for Peninsular Malaysia ~ 2.8°C East Malaysia ~ 2.6 °C Rainfall Variation (%) for Malaysia based upon 9 Global Climate Model Ensemble Projection
 for Malaysia based upon 9 Global Climate Model Ensemble Projection.")
21
Regional Climate Simulations
Global Circulation Models (GCM) lack regional detail that impact assessment on climate change require. A Regional Climate Model (RCM) adds small-scale detailed information of future climate change to the large-scale projections of a GCM. Coarse resolution information from a GCM is used to develop temporally and spatially fine scale information. In the Malaysian Meteorological Department, the PRECIS (Providing Regional Climates for Impacts Studies) is being used.
 lack regional detail that impact assessment on climate change require. A Regional Climate Model (RCM) adds small-scale detailed information of future climate change to the large-scale projections of a GCM. Coarse resolution information from a GCM is used to develop temporally and spatially fine scale information. In the Malaysian Meteorological Department, the PRECIS (Providing Regional Climates for Impacts Studies) is being used.")
22
Orographic Resolution
PRECIS resolution 0.44° x 0.44° HadCM3 resolution 2.5° x 3.75° PRECIS model resolution 50km HadCM3 model resolution 2.5° x 3.75°

23
PRECIS captures important regional information on summer monsoon rainfall missing in its parent GCM simulations

24
PRECIS Simulations of Present Climate (1961-1990)
Mean Annual Cycles of SEA Rainfall and Temperature

25
MEAN ANNUAL TEMPERATURE

26
Simulation of Average Annual Surface Temperature for Malaysia
using PRECIS 5 year running averages used

27
MEAN ANNUAL PRECIPITATION

28
Simulation of Average Annual Rainfall for Malaysia using PRECIS
5 year running averages used

29
Annual Mean Temperature Anomaly Relative to 1990 - 1999
1.3 °C 1.9°C 3.1°C 1.1°C 1.7°C 2.9°C 1.5°C 2.0°C 3.2°C 1.4°C 1.9°C 3.2°C 1.2°C 2.0°C 3.4°C 1.4°C 2.0°C 3.8°C 1.2°C 1.9°C 3.0°C 1.0°C 1.7°C 2.8°C Annual Mean Temperature Anomaly Relative to -9.1 – -8.9 – –12.8 –3.6 Annual Mean Rainfall Anomaly (%) Relative to 1990 – 1999
 Relative to 1990 –")
30
Thank You

Similar presentations

 Project is funded by the Climate Change Action Fund and provides climate change scenarios and related information.>")

:4751-4767 December 13, 2011.>")


 tell us – What are trends in the current observational.>")


 for ocean than atmosphere. ~20 layers atmosphere; ~20 layers.>")
 for ocean than atmosphere. ~20 layers atmosphere; ~20 layers.>")


 February 2014 Damien Lockie.>")


