Download presentation
Presentation is loading. Please wait.

1
Comparison of array detected transcription map with GENCODE/HAVANA annotations in ENCODE regions

2
AFFX Transcriptome Group Computation Molecular Biology S. Bekiranov P. Kapranov S. Brubaker I. Bell J. Cheng J. Drenkow S. Ghosh D. Kampa-Bailey G. Helt J. Long G. Madhavan J. Manak S. Patel V. Sementchenko H. Tammana A. Piccolboni Support: NCI Contract (21XS019C Phases I- III) 2001-2006 NHGRI ENCODE Grant AFFYMETRIX Acknowledgements NCI Harvard Medical School K. Struhl H. Hirsch H. H. Ng E. Sekinger Broad Institute B. Bernstein M. Kamal K. Lindblad-Toh D. J. Huebert S. McMahon E. K. Karlsson E. J. Kulbokas III S. L. Schreiber E. S. Lander
 NHGRI ENCODE Grant AFFYMETRIX Acknowledgements NCI Harvard Medical School K. Struhl H. Hirsch H. H. Ng E. Sekinger Broad Institute B. Bernstein M. Kamal K. Lindblad-Toh D. J. Huebert S. McMahon E. K. Karlsson E. J. Kulbokas III S. L. Schreiber E. S. Lander.")
3
Transcription Map & Modification Site Generation…I 1.Median Scaling: Scale all features on chip such that chip median = M 2.Quantile Normalization(QN): QN Feature intensities within replicates only. QN Treatment and Control separately. 3.Probe Mapping to Genome: Map PM,MM pairs to genome via exact 25-mer alignment of PM. 4.Wilcoxon Signed Rank Test: Perform test on probe-pair signal S = log 2 (PM-MM) Apply a sliding window to estimate intensity of each probe pair as a pseudo-median of all probes in the window. A Sliding window makes use of neighboring probes; this reduces false positive rate and increases sensitivity. Window size varies w/ experiment: RNA~50bp, IP~250bp 5.Map and Site Generation: RNA Join probes w/ intensity > 5%FPR & maxgap, minrun to generate transcribed fragments Chromatin IP Generate Hodges Lehman Estimator to estimate expression level : logDiff = log 2 (min(PM-MM) T,1) – log 2 (PM-MM) C,1) Generate p-Value estimate per probe Join probes w/ p-value 10 -5 & maxgap, minrun to generate modification/transcription factor binding sites CEL file Compute median (M) of all chip medians (if multiple arrays in a set) Median Scaling Quantile Normalization Probe Mapping to Genome Wilcoxon Signed Rank Test RNA or IP RNA: Transfrag Generation Chromation IP: Site Generation
 Apply a sliding window to estimate intensity of each probe pair as a pseudo-median of all probes in the window. A Sliding window makes use of neighboring probes; this reduces false positive rate and increases sensitivity. Window size varies w/ experiment: RNA~50bp, IP~250bp 5.Map and Site Generation: RNA Join probes w/ intensity > 5%FPR & maxgap, minrun to generate transcribed fragments Chromatin IP Generate Hodges Lehman Estimator to estimate expression level : logDiff = log 2 (min(PM-MM) T,1) – log 2 (PM-MM) C,1) Generate p-Value estimate per probe Join probes w/ p-value & maxgap, minrun to generate modification/transcription factor binding sites CEL file Compute median (M) of all chip medians (if multiple arrays in a set) Median Scaling Quantile Normalization Probe Mapping to Genome Wilcoxon Signed Rank Test RNA or IP RNA: Transfrag Generation Chromation IP: Site Generation.")
4
Filtration of 10 Chromosome Data (Cheng, J., et al. Science Express; March 24, 2005) ( see UCSD Browser for 8 cell line data see Version 33) Low Complexity Repeats Processed Pseudogenes BLAT hits more than itself (lose some members of gene families) Use of all filters this reduces the transfrag by ~20% of transfrags, ~30% of which are pseudogenes. With BLAT data reduction is 14%
 ( see UCSD Browser for 8 cell line data see Version 33) Low Complexity Repeats Processed Pseudogenes BLAT hits more than itself (lose some members of gene families) Use of all filters this reduces the transfrag by ~20% of transfrags, ~30% of which are pseudogenes. With BLAT data reduction is 14%.")
5
RACE Model (Need isothermal RT for unannotated transfrags)
")
6
RACE Analysis of Coding Gene DeGeorge Critical Region 14 gene

7
Un-annotated transfrags of PISD are part of at least 9 different, yet overlapping sense-antisense transcripts Sense Strand Anti-sense strand

9
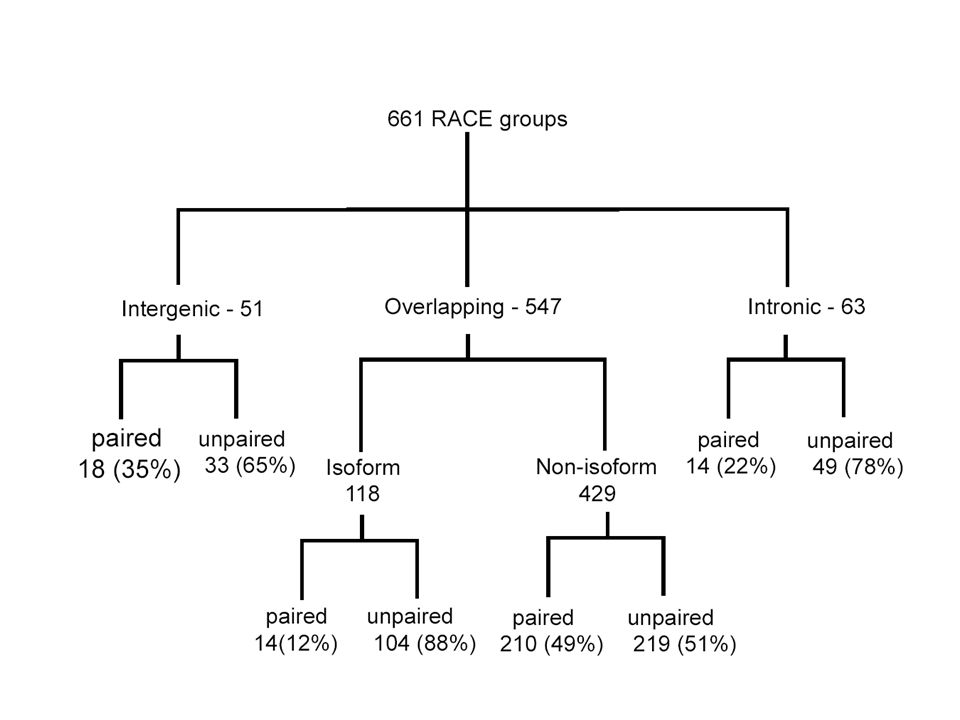
Region Total 5' and 3' + 5' or 3' successful RACE Total successful 5' or 3' RACE Percent total success considering total 256 Intergen 178/257870% Intronic 213/2564883% Exonic 243/2561395% RACE Regions Validated for 768 Loci

10
Data sets analyzed Part 1 : a) Analysis done on v34 of the human genome. Total number of Encode regions analyzed = 12 ( region Enm006 ignored for this analysis since no annotations are available for v34). b) Set of Known/validated exons c) Set of predicted exons (from multiple gene predictions) d) Array detected transcript maps from HL-60 cell lines at 4 time points after RA stimulation. (i.e one cell line at 4 biological states) Part 2 : a) Analysis done on v35 of the human genome. Total number of Encode regions analyzed = 44 b) Set of Known/validated exons. c) Set of Vega putative exons. d) Set of predicted exons outside sets b & c (from multiple gene predictions). d) Array detected transcript maps from HL-60 cell lines at 4 time points after RA stimulation.
. b) Set of Known/validated exons c) Set of predicted exons (from multiple gene predictions) d) Array detected transcript maps from HL-60 cell lines at 4 time points after RA stimulation. (i.e one cell line at 4 biological states) Part 2 : a) Analysis done on v35 of the human genome. Total number of Encode regions analyzed = 44 b) Set of Known/validated exons. c) Set of Vega putative exons. d) Set of predicted exons outside sets b & c (from multiple gene predictions). d) Array detected transcript maps from HL-60 cell lines at 4 time points after RA stimulation..")
11
Genomic sequence 35 bp avg. distance Repeats (RepeatMasker) Coverage of interogated Regions using algorithms used To call Transfrags Probes Exon 1 < 100% Covered Exon 2 is 100% Covered Annotation (e.g. Vega) Analyses done only within interrogated regions How Comparisons are carried out using arrays, Annotations and predicted regions Predicted exons
 Coverage of interogated Regions using algorithms used To call Transfrags Probes Exon 1 < 100% Covered Exon 2 is 100% Covered Annotation (e.g. Vega) Analyses done only within interrogated regions How Comparisons are carried out using arrays, Annotations and predicted regions Predicted exons.")
12
Probes Exon 2 Annotation Genomic sequence Transfrags after minrun/maxgap parameters Positive probes X Predicted exons

13
Coverage of Annotation by array detected transfrags from HL60 cell line in 13 ENCODE regions

14
Analysis results of 12/13 ENCODE Regions Total Number of exons Interrogated Number of exons detected by array generated transfrags ( overlap by at least 1 bp) Number of exons detected by array generated transfrags ( > 75% of exon bp overlapped by a transfrag) 1852 (Known/Validated) 1068 [ 57.7%] (74% avg. bp coverage) 700 (37.7%) 1181 (Predicted) 360 [30.5%] (69.2% avg.bp coverage) 175 (14.8%)
![Analysis results of 12/13 ENCODE Regions Total Number of exons Interrogated Number of exons detected by array generated transfrags ( overlap by at least 1 bp) Number of exons detected by array generated transfrags ( > 75% of exon bp overlapped by a transfrag) 1852 (Known/Validated) 1068 [ 57.7%] (74% avg.](http://images.slideplayer.com/15/4799249/slides/slide_14.jpg "bp coverage) 700 (37.7%) 1181 (Predicted) 360 [30.5%] (69.2% avg.bp coverage) 175 (14.8%).")
15
Mode size of annotated exons is ~120bp Detection of exons is not dependent upon size (bp) of the exon (i.e. small exons are not biased against) If an exon is detected by transfrag, 65% of these are covered at >75%
 If an exon is detected by transfrag, 65% of these are covered at >75%.")
16
Mode size of predicted exons is ~120bp Approximately 30.5 % of predicted exons are covered (i.e. at least 1bp coverage) by transfrags. If an exon is detected by transfrag, 48.6% of these are covered at >75%
 by transfrags. If an exon is detected by transfrag, 48.6% of these are covered at >75%.")
17
Coverage of Annotation by array Detected transfrags from HL60 cell line in all 44 Encode regions

18
Analysis results of 44 ENCODE regions Total number of exons interrogated Number of exons detected by array generated transfrags ( overlap by at least 1 bp) Number of exons detected by array generated transfrags ( > 75% of exon bp overlapped by a transfrag) 6467 (Known/Validated) 3487 [ 53.9%] (70% avg. bp coverage) 2142 (33.1%) 4455 (Predicted) 809 [18.2%] ( 62.23% avg. bp coverage) 361 (8.1%) 185 (Vega Putative) 39 [ 21.1%] (35.71 % avg. bp coverage) 3 (1.6%)
![Analysis results of 44 ENCODE regions Total number of exons interrogated Number of exons detected by array generated transfrags ( overlap by at least 1 bp) Number of exons detected by array generated transfrags ( > 75% of exon bp overlapped by a transfrag) 6467 (Known/Validated) 3487 [ 53.9%] (70% avg.](http://images.slideplayer.com/15/4799249/slides/slide_18.jpg "bp coverage) 2142 (33.1%) 4455 (Predicted) 809 [18.2%] ( 62.23% avg. bp coverage) 361 (8.1%) 185 (Vega Putative) 39 [ 21.1%] (35.71 % avg. bp coverage) 3 (1.6%).")
19
Mode size of annotated exons is ~120bp Detection of exons is not dependent upon size (bp) of the exon (i.e. small exons are not biased against) If an exon is detected by transfrag, 61.4% of these are covered at >75%
 If an exon is detected by transfrag, 61.4% of these are covered at >75%.")
20
Mode size of predicted exons is ~80bp Approximately, 18.2% of predicted exons are detected by transfrags ( ie. by at least 1 bp) If an exon is detected by transfrag, 44.6% of these are covered at >75%
 If an exon is detected by transfrag, 44.6% of these are covered at >75%.")
21
Important Caveats To Recall In Pondering the Prediction vs Array Results Only one cell line used in this evaluation. We have set very conservative thresholds for transfrag prediction. Other thresholds can be used Strand information not deducible from transfrag map. TUFs (transcripts of unknown function) are collection of transfrags shown to be on the same molecule by RACE-RT/PCR-cloning/sequencing. Array interrogation resolution is 20bp on average for non-repeat portion of the genome and probes are 25mers. Thus, the boundaries of transfrags are not as precise as arrays with 5bp interrogation resolution and some small exons will not not be interrogated or detected Have not included other functional features (e.g.TF binding) which would provide additional confidence to transfrag data. These will be added under ENCODE project.
 are collection of transfrags shown to be on the same molecule by RACE-RT/PCR-cloning/sequencing. Array interrogation resolution is 20bp on average for non-repeat portion of the genome and probes are 25mers. Thus, the boundaries of transfrags are not as precise as arrays with 5bp interrogation resolution and some small exons will not not be interrogated or detected Have not included other functional features (e.g.TF binding) which would provide additional confidence to transfrag data. These will be added under ENCODE project..")
22
Conclusions Array based method detects ~53.9% of known/validated exons. Similarly, array based method provides evidence for ~18.2% of predicted exons. These detected exons should be analyzed further to improve the annotation. A combination of array based RNA map generation, followed by RACE experiments can significantly improve the rate of validation of gene predictions. Transfrags that map outside validated and predicted exons can be used to improve gene prediction programs and can form the basis for further experiments.

Similar presentations


 Pseudogenes Amongst Various ENCODE Regions 211 Yale, 178 Vega, Union is 244 More pseudogenes in the manually picked.>")


 Isolate total RNA Isolate mRNA from total RNA (poly.>")


 Where to find TAIR7 release.>")


