Download presentation
Presentation is loading. Please wait.

2
Gross Domestic Product
GDP Defined GDP or gross domestic product is the market value of all final goods and services produced in a country in a given time period. This definition has four parts: Market value Final goods and services Produced within a country In a given time period The main challenge in teaching this topic is generating interest in it. Many teachers are bored by it and not surprisingly, they bore their students. If you are one of the many who lean towards boredom, start by recalling just how vital it is that we measure the value of production with reasonable accuracy. It is vital because we use GDP as the basis of measurement of the standard of living, economic welfare, and making international comparisons. Final goods versus intermediate goods. The distinction between final and intermediate goods is one of the key points in this first section. Use some standard examples to make the key point—tires and autos, chips and computers, and so on. Also, if you want to spend a bit of time on this topic, tell your students about the Bureau of Economic Analysis (BEA) revision in the treatment of business spending on software in the United States. The BEA began a major revision in 1998 and published the first revisions to reclassify software from intermediate to final good status in And, when the 1996 GDP was recalculated to include software, it increased by $115 billion, or 1.5 percent of GDP.
 revision in the treatment of business spending on software in the United States. The BEA began a major revision in 1998 and published the first revisions to reclassify software from intermediate to final good status in And, when the 1996 GDP was recalculated to include software, it increased by $115 billion, or 1.5 percent of GDP.")
3
Gross Domestic Product
Market Value GDP is a market value—goods and services are valued at their market prices. To add apples and oranges, computers and popcorn, we add the market values so we have a total value of output in dollars.

4
Gross Domestic Product
Final Goods and Services GDP is the value of the final goods and services produced. A final good (or service) is an item bought by its final user during a specified time period. A final good contrasts with an intermediate good, which is an item that is produced by one firm, bought by another firm, and used as a component of a final good or service. Excluding intermediate goods and services avoids double counting.
 is an item bought by its final user during a specified time period. A final good contrasts with an intermediate good, which is an item that is produced by one firm, bought by another firm, and used as a component of a final good or service. Excluding intermediate goods and services avoids double counting.")
5
Gross Domestic Product
Produced Within a Country GDP measures production within a country—domestic production. In a Given Time Period GDP measures production during a specific time period, normally a year or a quarter of a year.

6
Gross Domestic Product
GDP and the Circular Flow of Expenditure and Income GDP measures the value of production, which also equals total expenditure on final goods and total income. The equality of income and value of production shows the link between productivity and living standards. The circular flow diagram in Fig illustrates the equality of income and expenditure.

7
Gross Domestic Product
The circular flow diagram shows the transactions among households, firms, governments, and the rest of the world.

9
Gross Domestic Product
Households and Firms Households sell and firms buy the services of labour, capital, and land in factor markets. For these factor services, firms pay income to households: wages for labour services, interest for the use of capital, and rent for the use of land. A fourth factor of production, entrepreneurship, receives profit. In the figure, the blue flow, Y, shows total income paid by firms to households.

10
Gross Domestic Product

11
Gross Domestic Product
Firms sell and households buy consumer goods and services in the goods market. Consumption expenditure is the total payment for consumer goods and services, shown by the red flow labelled C . Firms buy and sell new capital equipment in the goods market and put unsold output into inventory. The purchase of new plant, equipment, and buildings and the additions to inventories are investment, shown by the red flow labelled I.

12
Gross Domestic Product

13
Gross Domestic Product
Governments Governments buy goods and services from firms and their expenditure on goods and services is called government expenditure. Government expenditure is shown as the red flow G. Governments finance their expenditure with taxes and pay financial transfers to households. These financial transfers are not part of the circular flow of expenditure and income. Government transfer payments, such as unemployment benefits and GST rebates, are not part of government expenditures because government expenditures include only funds used by the government to buy goods and services. Transfer payments are not buying a good or service for the government and so are not included in government expenditures.

14
Gross Domestic Product

15
Gross Domestic Product
Rest of the World Firms in Canada sell goods and services to the rest of the world—exports—and buy goods and services from the rest of the world—imports. The value of exports (X ) minus the value of imports (M) is called net exports, the red flow X – M. If net exports are positive, the net flow of goods and services is from Canadian firms to the rest of the world. If net exports are negative, the net flow of goods and services is from the rest of the world to Canadian firms.
 minus the value of imports (M) is called net exports, the red flow X – M. If net exports are positive, the net flow of goods and services is from Canadian firms to the rest of the world. If net exports are negative, the net flow of goods and services is from the rest of the world to Canadian firms.")
16
Gross Domestic Product

17
Gross Domestic Product
The blue and red flows are the circular flow of expenditure and income.

18
Gross Domestic Product
The sum of the red flows equals the blue flow.

19
Gross Domestic Product
That is: Y = C + I + G + X – M

20
Gross Domestic Product
The circular flow shows two ways of measuring GDP. GDP Equals Expenditure Equals Income Total expenditure on final goods and services equals GDP. GDP = C + I + G + X – M. Aggregate income equals the total amount paid for the use of factors of production: wages, interest, rent, and profit. Firms pay out all their receipts from the sale of final goods, so income equals expenditure, Y = C + I + G + (X – M).
.")
21
Gross Domestic Product
Why Is Domestic Product Gross? “Gross” means before deducting the depreciation of capital. The opposite of gross is net. “Net” means after deducting the depreciation of capital.

22
Gross Domestic Product
Depreciation is the decrease in the value of a firm’s capital that results from wear and tear and obsolescence. Gross investment is the total amount spent on purchases of new capital and on replacing depreciated capital. Net investment is the increase in the value of the firm’s capital. Net investment = Gross investment Depreciation.

23
Gross Domestic Product
Gross investment is one of the expenditures included in the expenditure approach to measuring GDP. So total product is a gross measure. Gross profit, which is a firm’s profit before subtracting depreciation, is one of the incomes included in the income approach to measuring GDP.

24
Measuring Canada’s GDP
Statistics Canada uses two approaches to measure GDP: The expenditure approach The income approach Most of the income data used by Statistics Canada comes from Revenue Canada. Expenditure data comes from a variety of sources. You might like to explain how the omission of illegal goods and services also leads to some misleading comparisons. For instance, the day before prohibition ended, the production of (illegal) beer was not counted as part of GDP. But the day after prohibition ended, the production of (now legal) beer counted. Ask your students to suggest two good reasons why illegal goods and services are omitted. First, the data are hard (but not impossible) to obtain. Second, there may be the moral position that illegal activities should not be included in GDP. This latter observation can lead to an interesting discussion. Ask the students if they think that the production of, say, marijuana should be included in GDP. Some, maybe even many, of them will see no problem with this. Then ask about the production of murder-for-hire. The response, we hope, will be significantly different. Does such a good have any value?
 beer was not counted as part of GDP. But the day after prohibition ended, the production of (now legal) beer counted. Ask your students to suggest two good reasons why illegal goods and services are omitted. First, the data are hard (but not impossible) to obtain. Second, there may be the moral position that illegal activities should not be included in GDP. This latter observation can lead to an interesting discussion. Ask the students if they think that the production of, say, marijuana should be included in GDP. Some, maybe even many, of them will see no problem with this. Then ask about the production of murder-for-hire. The response, we hope, will be significantly different. Does such a good have any value")
25
Measuring Canada’s GDP
The Expenditure Approach The expenditure approach measures GDP as the sum of consumption expenditure, investment, government expenditure on goods and services, and net exports. GDP = C + I + G + (X M) Table 20.1 on next slide shows the expenditure approach with data (in billions) for 2008. GDP = $885 + $304 + $ = $1,578 billion
 Table 20.1 on next slide shows the expenditure approach with data (in billions) for GDP = $885 + $304 + $ = $1,578 billion.")
27
Measuring Canada’s GDP
The Income Approach The income approach measures GDP by summing the incomes that firms pay households for the factors of production they hire.

28
Measuring Canada’s GDP
The National Income and Expenditure Accounts divide incomes into five categories: 1. Wages, salaries, and supplementary labour income 2. Corporate profits 3. Interest and miscellaneous investment income 4. Farmers’ income 5. Income from non-farm unincorporated businesses These five income components sum to net domestic income at factor cost.

29
Measuring Canada’s GDP
Two adjustments must be made to get GDP: 1. Indirect taxes minus subsidies are added to get from factor cost to market prices. 2. Depreciation (or capital consumption) is added to get from net domestic product to gross domestic product. Table 20.2 on the next slide shows the income approach with data for 2008.
 is added to get from net domestic product to gross domestic product. Table 20.2 on the next slide shows the income approach with data for")
31
Measuring Canada’s GDP
Nominal GDP and Real GDP Real GDP is the value of final goods and services produced in a given year when valued at valued at the prices of a reference base year. Currently, the reference base year is 2000 and we describe real GDP as measured in 2000 dollars. Nominal GDP is the value of goods and services produced during a given year valued at the prices that prevailed in that same year. Nominal GDP is just a more precise name for GDP.

32
Measuring Canada’s GDP
Calculating Real GDP Table 20.3(a) shows the quantities produced and the prices in 2002 (the base year). Nominal GDP in 2000 is $100 million. Because 2002 is the base year, real GDP and nominal GDP both are $100 million.
 shows the quantities produced and the prices in 2002 (the base year). Nominal GDP in 2000 is $100 million. Because 2002 is the base year, real GDP and nominal GDP both are $100 million.")
33
Measuring Canada’s GDP
Table 20.3(b) shows the quantities produced and the prices in 2009. Nominal GDP in 2009 is $300 million. Nominal GDP in 2009 is three times its value in 2002.
 shows the quantities produced and the prices in Nominal GDP in 2009 is $300 million. Nominal GDP in 2009 is three times its value in")
34
Measuring Canada’s GDP
In Table 20.3(c), we calculate real GDP in 2009. The quantities are those of 2009, as in part (b). The prices are those in the base year (2002) as in part (a). The expenditures sum to real GDP in 2009, which is $160 million.
, we calculate real GDP in The quantities are those of 2009, as in part (b). The prices are those in the base year (2002) as in part (a). The expenditures sum to real GDP in 2009, which is $160 million.")
35
The Uses and Limitations of Real GDP
Economists use estimates of real GDP for two main purposes: To compare the standard of living over time To compare the standard of living across countries

36
The Uses and Limitations of Real GDP
The Standard of Living Over Time Real GDP per person is real GDP divided by the population. Real GDP per person tells us the value of goods and services that the average person can enjoy. By using real GDP, we remove any influence that rising prices and a rising cost of living might have had on our comparison. Omissions from GDP. A discussion of omissions from GDP can arouse students’ interest. For example, you might point out that if one of your students mows her/his own lawn, the value of the student’s production doesn’t show up in GDP. But if you hire the student to mow your lawn (and if your student reports the income earned correctly to CCRA), the value of the student’s production does show up in GDP. Why don’t we measure all lawn mowing as part of GDP? Some reasons are cost of collecting data and the degree of intrusiveness we’d be willing to tolerate. But note how little we spend on collecting the GDP data and how relatively inexpensive it would be to add some questions about domestic production to either the Current Population Survey or the Family Expenditure Survey. The inclusion of the imputed rental of owner-occupied houses, but not owner-used cars and other durables, is a good example. You might like to explain how the omission of illegal goods and services also leads to some misleading comparisons. For instance, the day before prohibition ended, the production of (illegal) beer was not counted as part of GDP. But the day after prohibition ended, the production of (now legal) beer counted. Ask your students to suggest two good reasons why illegal goods and services are omitted. First, the data are hard (but not impossible) to obtain. Second, there may be the moral position that illegal activities should not be included in GDP. This latter observation can lead to an interesting discussion. Ask the students if they think that the production of, say, marijuana should be included in GDP. Some, maybe even many, of them will see no problem with this. Then ask about the production of murder-for-hire. The response, we hope, will be significantly different. Does such a good have any value?
, the value of the student’s production does show up in GDP. Why don’t we measure all lawn mowing as part of GDP Some reasons are cost of collecting data and the degree of intrusiveness we’d be willing to tolerate. But note how little we spend on collecting the GDP data and how relatively inexpensive it would be to add some questions about domestic production to either the Current Population Survey or the Family Expenditure Survey. The inclusion of the imputed rental of owner-occupied houses, but not owner-used cars and other durables, is a good example. You might like to explain how the omission of illegal goods and services also leads to some misleading comparisons. For instance, the day before prohibition ended, the production of (illegal) beer was not counted as part of GDP. But the day after prohibition ended, the production of (now legal) beer counted. Ask your students to suggest two good reasons why illegal goods and services are omitted. First, the data are hard (but not impossible) to obtain. Second, there may be the moral position that illegal activities should not be included in GDP. This latter observation can lead to an interesting discussion. Ask the students if they think that the production of, say, marijuana should be included in GDP. Some, maybe even many, of them will see no problem with this. Then ask about the production of murder-for-hire. The response, we hope, will be significantly different. Does such a good have any value")
37
The Uses and Limitations of Real GDP
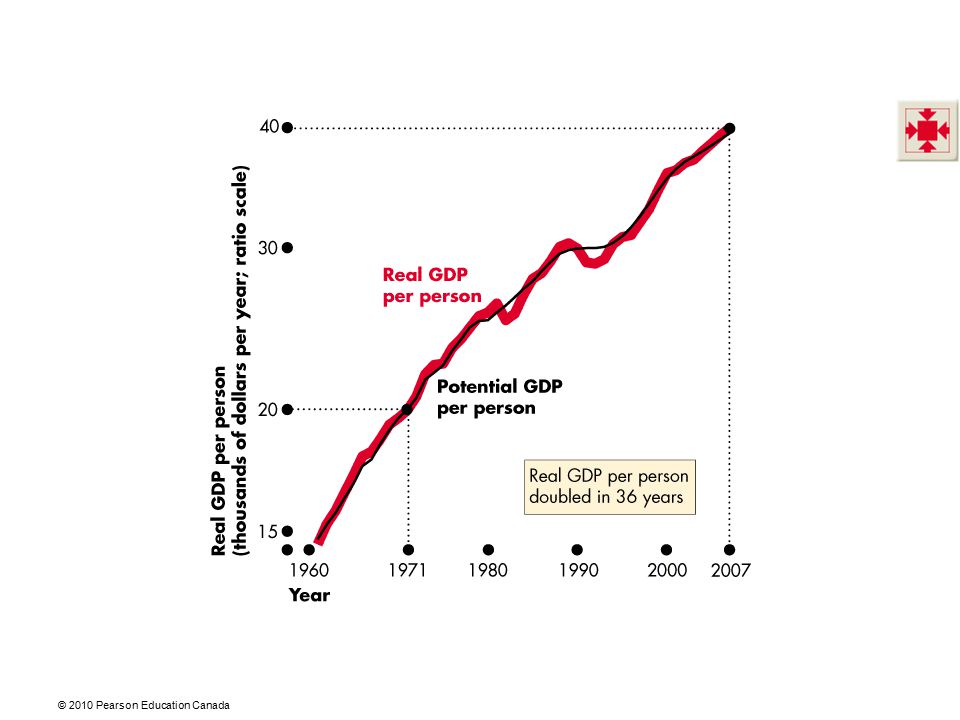
Long-Term Trend A handy way of comparing real GDP per person over time is to express it as a ratio of some reference year. For example, in 1971, real GDP per person was $20,127, and in 2007, it was $40,070 . So real GDP per person in 2007 was approximately double its 1971 level. Measured by real GDP per person, people were twice as well off in 2007 as people had been in 1971.

38
The Uses and Limitations of Real GDP
Two features of our expanding living standard are ■ The growth of potential GDP per person ■ Fluctuations of real GDP around potential GDP The value of real GDP when all the economy’s labour, capital, land, and entrepreneurial ability are fully employed is called potential GDP.

39
The Uses and Limitations of Real GDP
Figure 20.2 shows real GDP per person in Canada. Potential GDP grows at a steady pace because the quantities of the factors of production and their productivity grow at a steady pace. Real GDP fluctuates around potential GDP.

41
The Uses and Limitations of Real GDP
Real GDP per person in the Canada: Doubled in 36 years.

42
The Uses and Limitations of Real GDP
Productivity Growth Slowdown The growth rate of real GDP per person slowed after How costly was that slowdown? The answer is provided by a number that we’ll call the Lucas wedge. Lucas wedge is the dollar value of the accumulated gap between what real GDP per person would have been if the 1960s growth rate had persisted and what real GDP per person turned out to be. The Importance of the Lucas Wedge It is usually straightforward to interest students in the business cycle. But it is perhaps a bit more difficult to motivate interest in economic growth and the Lucas wedge. Yet economic growth and the Lucas wedge should be of immense importance to young students because they help determine the long-run living standard of their lives. One way to make this point clear is to ask the students whether the difference between, say, 3 percent annual growth in income versus 4 percent annual growth is important. This difference probably does not sound important. But, suppose that the initial income was $35,000. After 10 years with growth of 3 percent a year, the income would be $47,037 and with growth of 4 percent a year, the income would be $51,809. This difference of about $4,500 might not seem like much. But point out to the students that this difference is for only ten years and that the annual difference will continue to enlarge: After 30 years with 3 percent growth, the income would be $84,954 and with 4 percent growth the income would be $113,519, a one year difference of about $40,000. And, over a 30-year working career, the total differences in income, which is the analog to the Lucas wedge, is approximately $420,000. Over a 40-year working career, the Lucas wedge difference is over $1,000,000! Viewed from this perspective, the seemingly slight 1 percentage point difference in growth rates makes for an Incredibly major difference in incomes, which should easily capture your students’ attention.

43
The Uses and Limitations of Real GDP
Figure 20.3 illustrates the Lucas wedge. The red line is actual real GDP per person. The thin black line is the trend that real GDP per person would have followed if the 1960s growth rate of potential GDP had persisted. The shaded area is the Lucas wedge.

45
The Uses and Limitations of Real GDP
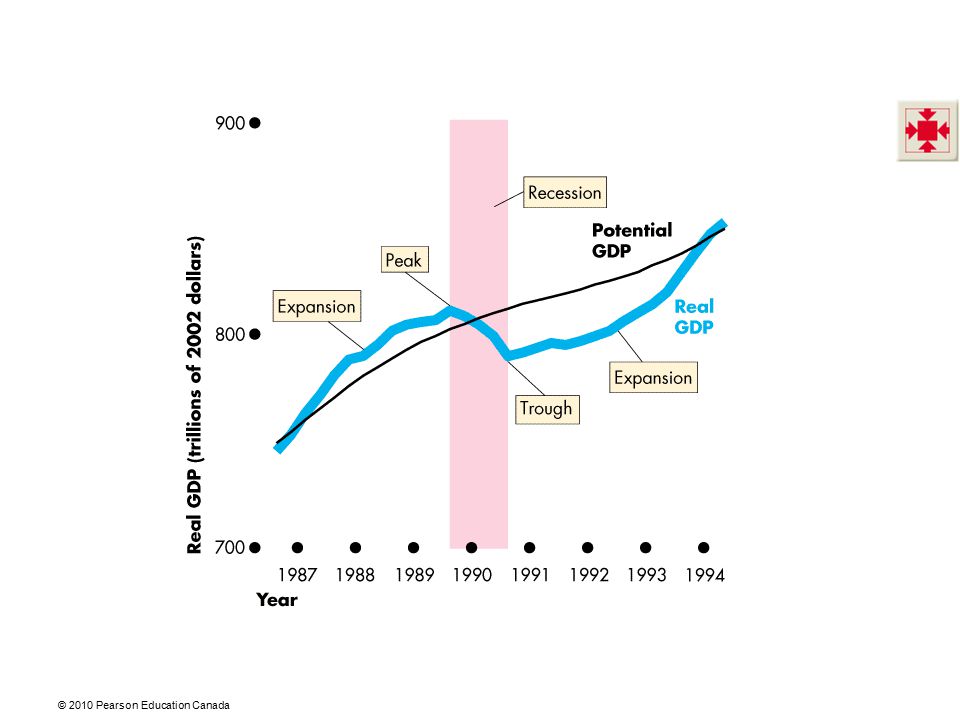
Real GDP Fluctuations A business cycle is a periodic but irregular up-and-down movement of total production and other measures of economic activity. Every cycle has two phases: 1. Expansion 2. Recession and two turning points: 1. Peak 2. Trough The Business Cycle Students generally are interested in the topic of business cycles, particularly if the economy happens to be in a recession when this chapter is covered. Often it is very difficult to tell the future path of the economy. Stress to the students that it is not stupidity on the part of economists that prevents us from knowing where the economy is heading. Rather it is the fact that forecasting is difficult for at least two reasons. First, different sectors of the economy frequently send different signals. For instance, retail sales may be down, signaling a start to a recession, but housing starts may be up, indicating that an expansion will continue for a while. Second, the data that must be used always are at least a bit out-of-date. For example, the preliminary estimate of GDP is not made until approximately six weeks after the end of the quarter, and the final revision of GDP doesn’t appear until years later. Although economists’ forecasts are much better than those of others, forecasting GDP with complete accuracy is unlikely. Conclude by mentioning that this fact is important in later chapters when we discuss implementation of countercyclical policies.

46
The Uses and Limitations of Real GDP
Figure 20.4 illustrates the business cycle. An expansion is a period during which real GDP increases. Recession is a period during which real GDP decreases—its growth rate is negative—for at least two successive quarters.

48
The Uses and Limitations of Real GDP
Standard of Living Across Countries Two problems arise in using real GDP to compare living standards across countries: 1. The real GDP of one country must be converted into the same currency units as the real GDP of the other country. 2. The goods and services in both countries must be valued at the same prices.

49
The Uses and Limitations of Real GDP
Using the exchange rate to compare GDP in one country with GDP in another country is problematic because … prices of particular products in one country may be much less or much more than in the other country. For example, using the market exchange rate to value Chinese GDP in U.S. dollars leads to an estimate that in 2008, U.S. real GDP per person was 19 times Chinese real GDP per person. International comparisons and PPP prices. Students sometimes see estimates of GDP per person in developing nations. Most such estimates are extremely low, and students often ask how people can live on such low incomes. Point out that the estimate is biased downward in two ways. First, in poor nations, more transactions do not go through a market than in rich nations. For example, transportation services in developing nations include a lot of walking, which is not counted as part of GDP. In richer nations, people ride a bus or subway and pay a fare, which is counted as part of GDP. Second, many locally produced and consumed goods and services have extremely low prices in poor nations. For example, a haircut that costs $20 in New York might cost $1 in Calcutta. (You might get a better haircut in New York, but probably not one that is 20 times better!) Converting Indian GDP into U.S. dollars at the market exchange rate leaves this bias in the data. Using purchasing power parity prices to convert India’s GDP into U.S. dollars avoids this bias.
 Converting Indian GDP into U.S. dollars at the market exchange rate leaves this bias in the data. Using purchasing power parity prices to convert India’s GDP into U.S. dollars avoids this bias.")
50
The Uses and Limitations of Real GDP
Figure 20.5 illustrates the problem. Using the market exchange rate and domestic prices leads to an estimate that China is very poor. Real GDP per person in China is 5 percent of U.S. real GDP per person.

52
The Uses and Limitations of Real GDP
Using purchasing power parity prices China’s real GDP per person is 12.5 percent of U.S. real GDP per person. The difference in the two sets of numbers is astonishingly large and makes a dramatic difference to how we view the balance of economic power over the next 25 years. At current growth rates and market exchange rates, by 2020, China will have a GDP around a quarter that of the United States. At current growth rates and PPP exchange rates, by 2020, China’s real GDP will exceed that of the United States. Per person, China in 2020 will still have a long way to go to catch the United States. But China’s economy will be the world’s largest.

53
The Uses and Limitations of Real GDP
Real GDP measures the value of goods and services that are bought in markets. Factors not in GDP that influence the standard of living are Household production Underground economic activity Health and life expectancy Leisure time Environmental quality Political freedom and social justice Omissions from GDP. A discussion of omissions from GDP can arouse students’ interest. For example, you might point out that if one of your students mows her/his own lawn, the value of the student’s production doesn’t show up in GDP. But if you hire the student to mow your lawn (and if your student reports the income earned correctly to Revenue Canada), the value of the student’s production does show up in GDP. Why don’t we measure all lawn mowing as part of GDP? Some reasons are cost of collecting data and the degree of intrusiveness we’d be willing to tolerate. But note how little we spend on collecting the GDP data and how relatively inexpensive it would be to add some questions about domestic production to either the Current Population Survey or the Consumer Expenditure Survey. The inclusion of the imputed rental of owner-occupied houses, but not owner-used cars and other durables, is a good example. You might like to explain how the omission of illegal goods and services also leads to some misleading comparisons. For instance, the day before prohibition ended, the production of (illegal) beer was not counted as part of GDP. But the day after prohibition ended, the production of (now legal) beer counted. Ask your students to suggest two good reasons why illegal goods and services are omitted. First, the data are hard (but not impossible) to obtain. Second, there may be the moral position that illegal activities should not be included in GDP. This latter observation can lead to an interesting discussion. Ask the students if they think that the production of, say, marijuana should be included in GDP. Some, maybe even many, of them will see no problem with this. Then ask about the production of murder-for-hire. The response, we hope, will be significantly different. Does such a good have any value?
, the value of the student’s production does show up in GDP. Why don’t we measure all lawn mowing as part of GDP Some reasons are cost of collecting data and the degree of intrusiveness we’d be willing to tolerate. But note how little we spend on collecting the GDP data and how relatively inexpensive it would be to add some questions about domestic production to either the Current Population Survey or the Consumer Expenditure Survey. The inclusion of the imputed rental of owner-occupied houses, but not owner-used cars and other durables, is a good example. You might like to explain how the omission of illegal goods and services also leads to some misleading comparisons. For instance, the day before prohibition ended, the production of (illegal) beer was not counted as part of GDP. But the day after prohibition ended, the production of (now legal) beer counted. Ask your students to suggest two good reasons why illegal goods and services are omitted. First, the data are hard (but not impossible) to obtain. Second, there may be the moral position that illegal activities should not be included in GDP. This latter observation can lead to an interesting discussion. Ask the students if they think that the production of, say, marijuana should be included in GDP. Some, maybe even many, of them will see no problem with this. Then ask about the production of murder-for-hire. The response, we hope, will be significantly different. Does such a good have any value")
Similar presentations