Download presentation
Presentation is loading. Please wait.

1
Lecture 2: Exporting, Innovation and Productivity H. Vandenbussche Brixen, September 2009

2
Intro Research questions: –Does Innovation drive exporting? –Does Exporting drive innovation? How is Innovation measured? –Input measures: R&D expenditures; R&D department; Training –Output measures: Product innovation, Process Innovation Methodology: Probit models Empirical Evidence: Mixed Hylke Vandenbussche Brixen, September 2009

3
Motivation Motivation - Data - Econometric approach - Results - Conclusion Early Literature Melitz, 2003; Bernard and Jensen, 1999: productivity is a random exogenous draw from a Pareto distribution. Yeaple, 2005; Bustos, 2005; Constantini & Melitz 2007: firms endogenously choose innovation. Link between innovation and firm growth known in IO Empirical evidence on innovation INPUT measures Aw et al (2007): no link between R&D and probability to start exporting for Taiwanese firms. Cassiman & Martinez-Ros(2007): no link between R&D and exporting for Spanish firms. Hylke Vandenbussche Brixen, September 2009
: no link between R&D and probability to start exporting for Taiwanese firms. Cassiman & Martinez-Ros(2007): no link between R&D and exporting for Spanish firms. Hylke Vandenbussche Brixen, September")
4
Motivation Motivation - Data - Econometric approach - Results - Conclusion Empirical literature on innovation OUTPUT measures Cassiman & Martinez-Ros (2007): Product innovation not process innovation affects exporting for Spanish firms Caldera (2009): Product innovation ànd Process innovation affect exporting for Spanish firms Becker and Egger (2007): product innovation matters more than process innovation to exporting for German firms. They do not isolate export starters which may lead to a simultaneity bias Damijan et al. (2008): no link between product nor process innovation and the decision to start exporting for Slovenian firms Hylke Vandenbussche Brixen, September 2009
: no link between product nor process innovation and the decision to start exporting for Slovenian firms Hylke Vandenbussche Brixen, September")
5
Paper 1: Aw, Roberts and Whinston IO approach –Hopenhayn (’92) and Olley and pakes (1986) assume that a firm’s productivity follows a Markov process and does NOT depend on investment: –More general formulation here: with r: spending on R&D and x: participation in export markets Data –Taiwanese electronics industry –Largest industrial sector: 25% of exports; 5% of GDP –Firm surveys 1986, 1991, 1996 Innovation measure –R&D –Training
 and Olley and pakes (1986) assume that a firm’s productivity follows a Markov process and does NOT depend on investment: –More general formulation here: with r: spending on R&D and x: participation in export markets Data –Taiwanese electronics industry –Largest industrial sector: 25% of exports; 5% of GDP –Firm surveys 1986, 1991, 1996 Innovation measure –R&D –Training")
6
Transition Matrix of Investment Activities between Years t and t + 1, 1986–1996 Number of firms (row proportion) Investment Activity Year t Year (t + 1) (number of firms in year t) Start R&D/T Stop R&D/T Start Export Stop Export No R&D/WT & No 24 (12.97) – 50 (27.03) – Export (185) Only R&D/WT (82) – 36 (43.90) 42 (51.22) – Only Exporting (276) 73 (26.45) – – 52 (18.84) R&D/WT & Export(530) – 156 (29.43) – 40 (7.55)
 Investment Activity Year t Year (t + 1) (number of firms in year t) Start R&D/T Stop R&D/T Start Export Stop Export No R&D/WT & No 24 (12.97) – 50 (27.03) – Export (185) Only R&D/WT (82) – 36 (43.90) 42 (51.22) – Only Exporting (276) 73 (26.45) – – 52 (18.84) R&D/WT & Export(530) – 156 (29.43) – 40 (7.55)")
7
Direction of causality not clear Methodology: bivariate Probit model i.e. takes two independent binary probit models and estimates them together but allows a correlation in the error term. This is to recognize that there may be unobserved variables that affect both binary choices. The model is estimated with maximum likelihood Choice 1: R&D and Exporting Choice 2: only Exporting Choice 3: only R&D

8
Discrete Investment Activity Equation Exporting R&D/WT intercept −3.377 (0.647)* −6.749 (0.626)* year dummy 0.137 (0.108) 0.023 (0.096) entrant dummy 0.647 (0.162)* 0.593 (0.199)* log(age) 0.128 (0.070) −0.209 (0.069)* log(kit) 0.383 (0.038)* 0.496 (0.036)* log(pwageit) −0.319 (0.104)* 0.114 (0.100) multiplant dummy 0.067 (0.127) 0.035 (0.111) productivity (ωit) 1.120 (0.356)* 0.524 (0.283) productivity squared ()ωit 2 −0.631 (0.272)* −0.138 (0.215) lagged Choice 1 dummy Exporting and R&D/WT 1.270 (0.297)* 0.711 (0.251)* lagged Choice 2 dummy Exporting but not R&D/WT 0.921 (0.239)* 0.206 (0.263) lagged Choice 3 dummy R&D/WT but not exporting −0.130 (0.423) 0.329 (0.425) (ωit) * lagged Choice 1 dummy −0.036 (0.652) 0.193 (0.416) (ωit) * lagged Choice 2 dummy 0.829 (0.464) −0.045 (0.415) (ωit) * lagged Choice 3 dummy −0.599 (1.049) 0.246 (0.929) Corr(εxit, εrit) 0.287 (0.059)* Notes: * Statistically significant at the α = 0.05 level.
* −6.749 (0.626)* year dummy (0.108) (0.096) entrant dummy (0.162)* (0.199)* log(age) (0.070) −0.209 (0.069)* log(kit) (0.038)* (0.036)* log(pwageit) −0.319 (0.104)* (0.100) multiplant dummy (0.127) (0.111) productivity (ωit) (0.356)* (0.283) productivity squared ()ωit 2 −0.631 (0.272)* −0.138 (0.215) lagged Choice 1 dummy Exporting and R&D/WT (0.297)* (0.251)* lagged Choice 2 dummy Exporting but not R&D/WT (0.239)* (0.263) lagged Choice 3 dummy R&D/WT but not exporting −0.130 (0.423) (0.425) (ωit) * lagged Choice 1 dummy −0.036 (0.652) (0.416) (ωit) * lagged Choice 2 dummy (0.464) −0.045 (0.415) (ωit) * lagged Choice 3 dummy −0.599 (1.049) (0.929) Corr(εxit, εrit) (0.059)* Notes: * Statistically significant at the α = 0.05 level.")
9
Conclusion Aw et al. History of exporting matters R&D does NOT matter for exporting But! R&D and exporting together can put a firm on a higher future productivity path!

10
Paper 2: Cassiman&Martinez-Ros Data –Spanish manufacturing firms –’90-99 –CIS for Spain: output measure of innovation –One way causality from innovation to exporting Theory –Vernon (1966) product life cycle i.e. firms invent new product, first sell it at home and than abroad

11
Table 3a: Past Innovation and Exports t Not Export t Export t Total Not Innovate t-1 2807 (58%) 2070 (42%) 4877 (100%) Innovate t-1 389 (16%) 2033 (84%) 2422 (100%) Total 3196 (44%) 4103 (56%) 7299 (100%) Table 3b: Past Product Innovation and Exports Not Export t Export t Total No Product Innovation t-1 2799 (51%) 2720 (49%) 5519 (100%) Product Innovation t-1 397 (22%) 1383 (78%) 1780 (100%) Total 3196 (44%) 4103 (56%) 7299 (100%) Table 3c: Past Process Innovation and Exports Not Export t Export t Total No Process Innovation t-1 2505 (51%) 2405 (49%) 4910 (100%) Process Innovation t-1 691 (29%) 1698 (71%) 2389 (100%) Total 3196 (44%) 4103 (56%) 7299 (100%)
 2070 (42%) 4877 (100%) Innovate t (16%) 2033 (84%) 2422 (100%) Total 3196 (44%) 4103 (56%) 7299 (100%) Table 3b: Past Product Innovation and Exports Not Export t Export t Total No Product Innovation t (51%) 2720 (49%) 5519 (100%) Product Innovation t (22%) 1383 (78%) 1780 (100%) Total 3196 (44%) 4103 (56%) 7299 (100%) Table 3c: Past Process Innovation and Exports Not Export t Export t Total No Process Innovation t (51%) 2405 (49%) 4910 (100%) Process Innovation t (29%) 1698 (71%) 2389 (100%) Total 3196 (44%) 4103 (56%) 7299 (100%)")
12
Table 7: Decision to Export at time t by Non-Exporters in t-1 Small and Medium Firms ( 200 workers) (1) (2) (3) (4) (5) (6) (7) (8) (9) (10) Prod In (t-1) 0.208** 0.218* 1.112** 1.66** 0.55* 0.696** 0.696** 0.604 0.179 0.059 Proc Inn (t-1) 0.084 0.117 - 0.516 -0.966 -0.107 -0.044 -0.044 0.432 -0.092 -0.2 Size 0.017*** 0.027*** 0.018*** 0.029*** 0.029*** 0.001 0.001 0.001 0.001 0.001 SizeSq -0.100*** -0.163*** -0.104*** -0.173*** -0.172*** -0.001 -0.001 -0.001 -0.0004 -0.0005 Foreign 0.317 0.439 0.250 0.388 0.374 -0.511* -0.511* -0.365 -0.325 -0.325 Cap Int 0.00002 0.00004 0.00003 0.00005 0.00005 0.0001 0.0001 0.0001 0.0001 0.0001 Wage Int -1.248*** -1.478*** -1.210*** -1.522*** -1.467*** 0.1447 0.1447 0.132 0.110 0.138 Low Comp 0.001 0.003 0.001 0.002 0.002 0.010 0.010 0.014 0.011 0.012 Index -0.00003 0.00001 0.00003 0.00002 0.00001 0.00006 0.00006 0.00001 -0.00004 0.00001 Intercept -1.677*** -2.394*** -1.96*** -2.2*** -1.71 -2.50 -2.50 -1.852 -0.76 -1.501 Indy-Time Ds Included Included Included Included Included Included Included Included Included Included Obs 2916 916 2916 2916 2916 140 140 140 140 140
 (1) (2) (3) (4) (5) (6) (7) (8) (9) (10) Prod In (t-1) 0.208** 0.218* 1.112** 1.66** 0.55* 0.696** 0.696** Proc Inn (t-1) Size 0.017*** 0.027*** 0.018*** 0.029*** 0.029*** SizeSq *** *** *** *** *** Foreign * * Cap Int Wage Int *** *** *** *** *** Low Comp Index Intercept *** *** -1.96*** -2.2*** Indy-Time Ds Included Included Included Included Included Included Included Included Included Included Obs")
13
Conclusion Cassiman-Martinez-Ros Product Innovation explains Exporting ! Especially in Small firms Product Innovation suggest firm-specific demand shocks

14
Paper 3: Damijan et al. Data -Slovenian firm-level data -CIS community industry survey ‘96-2002 -output measure of innovation Methodology –Bivariate Probit model on exporting and innovation –Allow for two way causality

15
Bivariate Probit model A test for correlation between exporting to innovation i.e. “learning”: Prob(Inov t = 1) = f(Inovt-2;Exp t-2;X t-2) A test for correlation between innovation to exporting: Prob(Export t = 1) = f(Exp t-2; Innov t-2;X t-2)
 = f(Inovt-2;Exp t-2;X t-2) A test for correlation between innovation to exporting: Prob(Export t = 1) = f(Exp t-2; Innov t-2;X t-2).")
16
Table 4: Results of bivariate probit regressions (no matching, all exporters) Export status (1) (2)(3)(4)(5)(6) Lagged innovation 0.1290.0540.096-0.0930.191-0.041 Lagged exportstatus1.876*** 2.281***2.128***2.443***2.421***2.401*** Lagged productivity0.126*0.145-0.076-0.067-0.108-0.050 Lagged employment0.214***0.166***0.321***0.130*0.177*0.145* Lagged capitalintensity0.144***-0.108**0.067-0.092*-0.029-0.0640 Lagged R&DInvestment 0.0040.0250.0090.0260 FDI penetration in industry 0.1510.114-0.097-0.079 Industry dummies yes no yes no no no Timedummies yes yes yes yes yes yes N 3812 1551 1428 602 623 623 Rho 0.125 0.139 0.118 0.275 0.423 0.197 Prob rho=0 0.058 0.078 0.092 0.063 0.007 0.132 (1)-(4) Both product and process innovation considered, (5)only produc tinnovation is considered and(6)only process innovation considered
 Export status (1) (2)(3)(4)(5)(6) Lagged innovation Lagged exportstatus1.876*** 2.281***2.128***2.443***2.421***2.401*** Lagged productivity0.126* Lagged employment0.214***0.166***0.321***0.130*0.177*0.145* Lagged capitalintensity0.144***-0.108** * Lagged R&DInvestment FDI penetration in industry Industry dummies yes no yes no no no Timedummies yes yes yes yes yes yes N Rho Prob rho= (1)-(4) Both product and process innovation considered, (5)only produc tinnovation is considered and(6)only process innovation considered")
17
Table5: Results of bivariate probit regressions (no matching, all innovators) Innovation status (1)(2)(3)(4)(5)(6) Lagged inn1.226***1.396***0.631***0.891***0.912***0.463*** Lagged exports0.223***0.332***-0.0530.536**0.478**0.254 Lagged productiv0.167***0.171**0.199**0.0720.0920.208* Lagged employm0.224***0.256***0.178***0.130**0.134**0.228*** Lagged capital int0.069*-0.0570.124*0.049-0.0420.053 Lagged R&D Invest 0.077***0.051***0.057***0.049*** FDI penetration in sector 0.793***0.708***0.564**0.651*** Sector dummies yes no yes no no no Time dummies yes yes yes yes yes yes N 3812 1551 1428 602 623 623 (1)-(4) Both product and process innovation considered (5)only product innovation is considered and (6)only process innovation considered
 Innovation status (1)(2)(3)(4)(5)(6) Lagged inn1.226***1.396***0.631***0.891***0.912***0.463*** Lagged exports0.223***0.332*** **0.478**0.254 Lagged productiv0.167***0.171**0.199** * Lagged employm0.224***0.256***0.178***0.130**0.134**0.228*** Lagged capital int0.069* * Lagged R&D Invest 0.077***0.051***0.057***0.049*** FDI penetration in sector 0.793***0.708***0.564**0.651*** Sector dummies yes no yes no no no Time dummies yes yes yes yes yes yes N (1)-(4) Both product and process innovation considered (5)only product innovation is considered and (6)only process innovation considered")
18
Conclusion Damijan et al. No evidence that R&D affects exporting But evidence that Exporting affects innovation (“learning”) for medium and large firms Results are confirmed with matching techniques
 for medium and large firms Results are confirmed with matching techniques.")
19
Innovation, Exports and Productivity: Firm-level evidence for Belgium Ilke Vanbeveren (Lessius, KUL) and Hylke Vandenbussche (CORE-UCL & KUL-LICOS) Brixen, September 2009
 and Hylke Vandenbussche (CORE-UCL & KUL-LICOS) Brixen, September 2009")
20
Intro Main research Q: Does innovation drive exporting? Data: Belgium, Community Innovation Survey, 2 waves, starters on export market vs. control group. Methodology: Probit model. Dependent variable: probability to start exporting. Independent variables: innovation variables and controls. Main findings: –It is the combination of product and process innovation (not either of two in isolation) that increases firms’ probability to start exporting. –Controlling for endogeneity of the innovation decision: no significant impact of innovation on probability to start exporting. Ilke Van Beveren and Hylke Vandenbussche Brixen, September 2009
 that increases firms’ probability to start exporting. –Controlling for endogeneity of the innovation decision: no significant impact of innovation on probability to start exporting. Ilke Van Beveren and Hylke Vandenbussche Brixen, September")
21
Road map 1.Motivation & related literature 2.Data 3.Econometric approach 4.Baseline results 5.Accounting for anticipation effects 6.Conclusion Ilke Van Beveren and Hylke Vandenbussche Brixen, September 2009

22
Motivation Motivation - Data - Econometric approach - Results - Conclusion Three sources of endogeneity: Simultaneity: Innovation and export decisions are taken at the same time. –Possible solution: use lagged values of independent variables. Causality: Past exporting history. –Possible solution: focus on starters versus non-exporters. Anticipation: Future prospect of exports. –Possible solution: use Instrumental Variable techniques. Ilke Van Beveren and Hylke Vandenbussche Brixen, September 2009

23
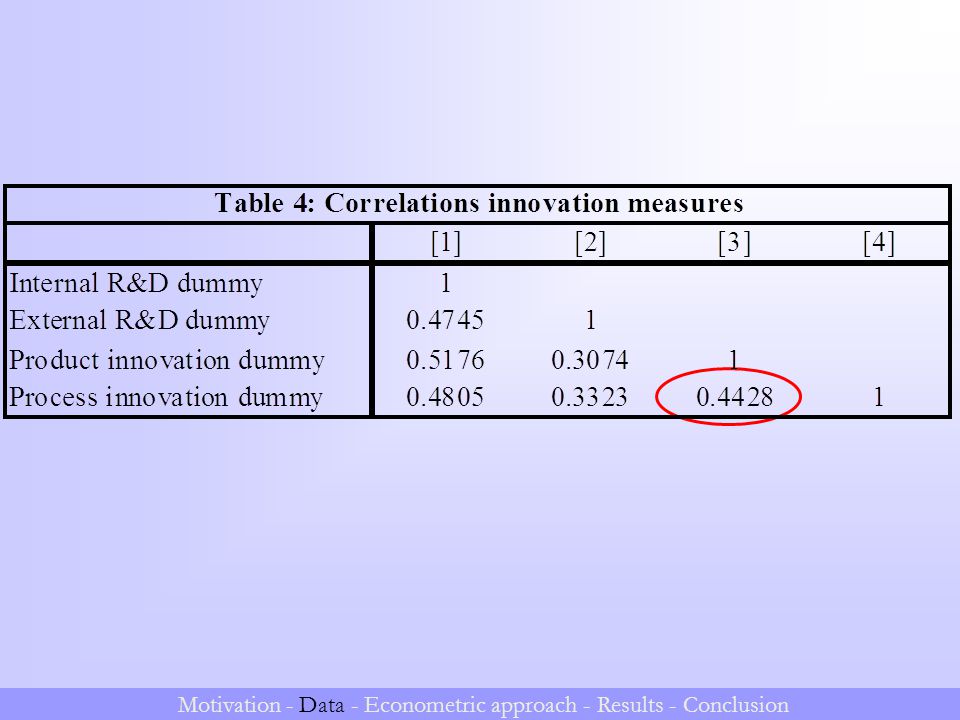
Data Motivation - Data - Econometric approach - Results - Conclusion Community Innovation Survey data Belgium. 2 waves: 2000 (CIS3) and 2004 (CIS4). Sampling is random in each period: 600 firms have answered both questionnaires. Information about: –Firm-level innovation –Firm-level exports All sectors of the economy. Accounting information of firms: Belfirst (2006). Ilke Van Beveren and Hylke Vandenbussche Brixen, September 2009
 and 2004 (CIS4). Sampling is random in each period: 600 firms have answered both questionnaires. Information about: –Firm-level innovation –Firm-level exports All sectors of the economy. Accounting information of firms: Belfirst (2006). Ilke Van Beveren and Hylke Vandenbussche Brixen, September")
24
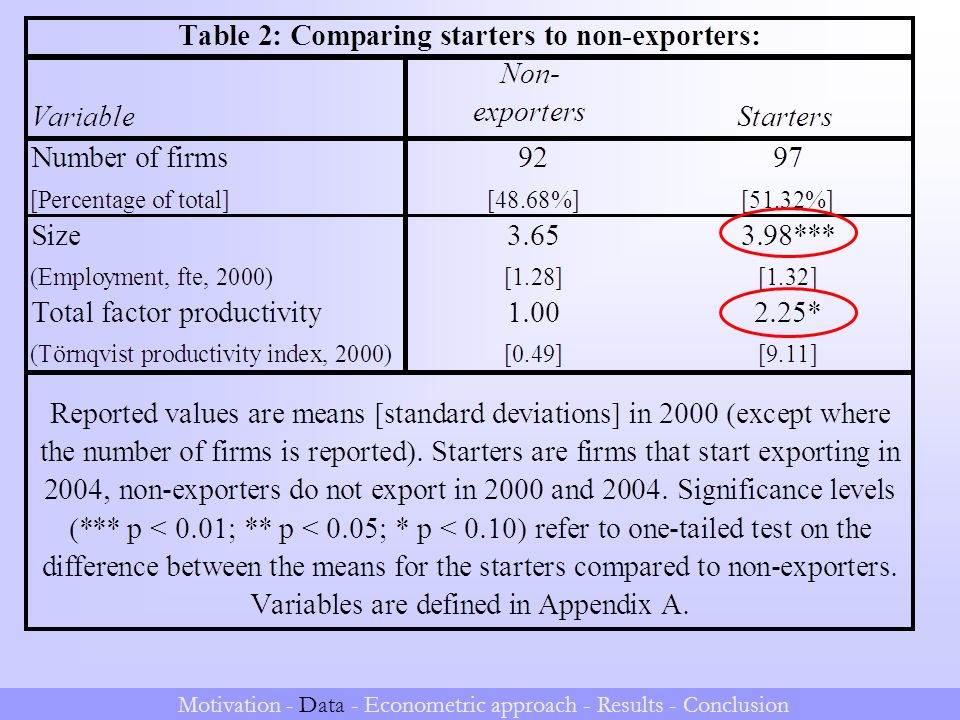
Data Motivation - Data - Econometric approach - Results - Conclusion Sample selection: 2 restrictions: –Simultaneity bias: we use (four-year) lagged firm-level characteristics in the empirical analysis: we can only include firms that have answered both questionnaires (600 firms). –Causality bias: To rule out the influence of past exporting history: we focus only on starters on the export market and compare these a group of non- exporters (189 firms). Innovation variables: dummy variables indicating whether firm engaged in a particular innovation activity. Ilke Van Beveren and Hylke Vandenbussche Brixen, September 2009
. Innovation variables: dummy variables indicating whether firm engaged in a particular innovation activity. Ilke Van Beveren and Hylke Vandenbussche Brixen, September")
25
Motivation - Data - Econometric approach - Results - Conclusion

29
Econometric approach Motivation - Data - Econometric approach - Results - Conclusion Estimation method: probit model. Dependent variable: probability to start exporting. Independent variables: –Innovation dummies, –Sector dummies, –Firm-level control variables: Size and productivity. Ilke Van Beveren and Hylke Vandenbussche Brixen, September 2009

30
Motivation - Data - Econometric approach - Results - Conclusion

32
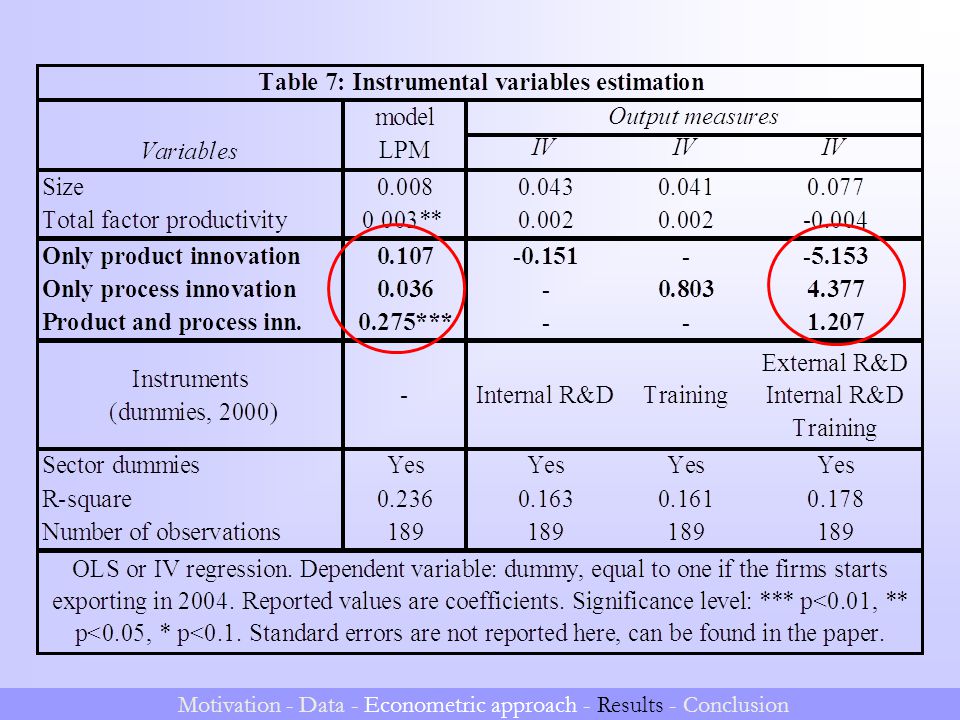
Accounting for anticipation effect Motivation - Data - Econometric approach - Results - Conclusion How? IV estimation techniques. Problem: IV probit is not possible when endogenous variable is dummy. Solution: Linear Probability Model (IV). Requirements for good instruments: –No direct impact on probability to start exporting. –Significant determinant of endogenous variable, conditional on all other independent variables. Ilke Van Beveren and Hylke Vandenbussche Brixen, September 2009
. Requirements for good instruments: –No direct impact on probability to start exporting. –Significant determinant of endogenous variable, conditional on all other independent variables. Ilke Van Beveren and Hylke Vandenbussche Brixen, September")
33
Motivation - Data - Econometric approach - Results - Conclusion

35
Conclusion Motivation- Data - Econometric approach - Results - Conclusion It is not so much product or process innovation in isolation, but rather the combination of the two, that increases firms’ propensity to start exporting. After accounting for the potential endogeneity of the innovation decision in firms’ export decision: results suggest that firms self-select into innovation, i.e. they only invest in innovative activities if their future export prospects are good. Ilke Van Beveren and Hylke Vandenbussche Brixen, September 2009

Similar presentations


>")


 Organisation for Economic.>")


 December 2008 Vienna.>")

 presented by Yunrong Li.>")


