Download presentation
Presentation is loading. Please wait.

1
Why are color patterns in red- tailed hawks so polymorphic? Ferruginous Hawk

2
Heterozygous advantage in European buzzards (Example 8.2)
")
4
Paper Outline

5
Today Chapter 9: Population subdivision Estimating gene flow Questions??? Chapter 10 Multiple loci: Gametic disequilibrium Concept Causes Linkage Small population size Hybridization

6
Describing gene flow in natural populations (1) Indirect: Measure F ST and estimate mN with island model. 2. Direct: Assign individuals into populations based on their genotype. “Assignment tests” approach.

7
(1) Indirect: Long-toed salamander Tallmon et al. 2000. Genetic differentiation among long-toed salamander (Ambystoma macrodactylum) populations. Copeia 27-35.
 populations. Copeia")
9
Overall F ST

10
mN ≈ 1

12
N e = 123 ± 79 mN ≈ 1m ≈ 1%

13
mN ≈ 1m ≈ 1% Under- or over-estimate?

14
(2) Direct approach Genotypes can be used as “genetic tags” to identify the population of origin of individuals and to detect migrants.
 Direct approach Genotypes can be used as genetic tags to identify the population of origin of individuals and to detect migrants.")
15
Waters, J. M., L. H. Dijkstra, and G. P. Wallis. 2000. Molec. Ecol. 9:1815-1821.

16
Adult 100 – 150 mm (matures at 1- 3 years; spawns in estuaries) Inanga (Galaxias maculatus) Whitebait 50 mm (21-23 weeks)
 Inanga (Galaxias maculatus) Whitebait 50 mm (21-23 weeks)")
17
mtDNA sequence divergence 1% Migrant haplotype found in NZ

18
Genetic marking Genotypes can be used as “genetic tags” to identify the population of origin of individuals and to detect migrants. “Assignment tests” approach. Assign individuals into populations based on their genotype at many nuclear loci. (See Sections 9.8.4 & 16.4.2).
..")
19
See Section 16.4.2 The multiple locus genotype of an individual can be used to “assign” the individual to its most likely population of origin.

20
Potential source populations A B C D E Indiv

21
Which source population is Indiv most likely from? A, B, C, D, E Potential source populations A B C D E Indiv

22
Northwest Science 83:154-162 Genotyped at 16 microsatellite loci to determine if a native or migrant genotype.

23
Northwest Science 83:154-162 Genotyped at 16 microsatellite loci to determine if a native or migrant genotype.

24
Mountain lion killed by car in Connecticut Genotyped at 18 microsatellite loci

26
Use of assignment tests in analysis of mixed stock harvest

27
Chulitna Lodge Beach 99 Idavain Ck 00 Nuyakuk L. 00 Koktuli R. 00 Lower Talarik 00 Margo Ck 01 American Ck 01 Nick-N-Ck 00 Dennis Ck 00 Fuel Island 00 Gibraltar L. 00 Brooks L. 00 Kijik L. 00 Haplotypes T C Chinkelyes Ck 00 Triangle Island 00 Headwaters Ck. 01 Finger Beach 00 Tommy R 00 Iliamna R 99 Copper R 00 Southeast Ck 00 Tazimina R 01 American Ck 00 Knutsen Bay 00 Cytochrome b SNP

28
Bristol Bay Port Moller test fishery (7 day advance warning)
")
29
Contract vessel used to test fish Port Moller transect

30
Bristol Bay Port Moller test fishery (7 day advance warning) Day 1
 Day 1")
31
Fin clips taken from fish at each station

32
Bristol Bay Port Moller test fishery (7 day advance warning) Day 3 – Samples to Anchorage
 Day 3 – Samples to Anchorage")
33
Day 4 – Samples analyzed in Anchorage

35
6,000,000 fish surplus Day 5 – Analyses reported

36
Day 6-7 – Directed Harvest

37
Chapter 9 Subdivision: Questions??? Which population structure is most likely to lead to long-term persistence?

38
Summary of Chapter 9 (1)Gene flow decreases divergence among populations and increases genetic variation within populations. (2) In the absence of selection, divergence is a function of the number of migrants: (3) Natural selection can ‘swamp’ the effects of gene flow in large populations (e.g., outlier loci).
 In the absence of selection, divergence is a function of the number of migrants: (3) Natural selection can ‘swamp’ the effects of gene flow in large populations (e.g., outlier loci)..")
40
r = 0.5 for unlinked loci on different chromosomes. Loci are linked if r < 0.5 r = recombination rate

41
Gametic (linkage) disequilibrium D will be zero if genotypes at the two loci are randomly associated (multiplication rule)
 disequilibrium D will be zero if genotypes at the two loci are randomly associated (multiplication rule)")
42
A locus: p 1 = 0.4; q 1 = 0.6 B locus: p 2 = 0.7; q 2 = 0.3 D = (0.40) – (0.4)(0.7) = 0.12
 – (0.4)(0.7) = 0.12")
43
NOTE: Each locus is in H-W proportions. D=0 [D=0.12]
![NOTE: Each locus is in H-W proportions. D=0 [D=0.12]](http://images.slideplayer.com/15/4757159/slides/slide_43.jpg "NOTE: Each locus is in H-W proportions. D=0 [D=0.12]")
44
When should we be concerned about possible gametic disequilibrium? (1) Closely linked markers. (2) Small effective population size (3) Hybridization
 Closely linked markers. (2) Small effective population size (3) Hybridization.")
45
When should we be concerned about possible gametic disequilibrium? (1) Closely linked markers. A neutral marker (e.g., microsatellite locus) can appear to be under selection because it is in gametic disequilibrium with a selected locus.
 Closely linked markers. A neutral marker (e.g., microsatellite locus) can appear to be under selection because it is in gametic disequilibrium with a selected locus..")
47
Hitchhiking during a selective sweep of advantageous mutatiion Selected locus

48
0.033 CPA112 11 allozyme loci 8 microsatellite loci Outlier Locus Expected distributions in absence of selection

49
When should we be concerned about possible gametic disequilibrium? (1) Closely linked markers. (2) Small effective population size (3) Hybridization
 Closely linked markers. (2) Small effective population size (3) Hybridization.")
50
N = 5

51
N = 2 AB/ab Ab/aB p 1 =0.5 p 2 =0.5 D=0 AB ab Ab aB ab Ab AB Random sample of 4 gametes from the gamete pool N = 2 p 1 = p 2 = D=

52
Example 10.5 Siberian jay 103 microsatellite loci

53
83% loci on different chromosomes show significant gametic disequilibrium. Even distant loci on the same chromosome are in gametic disequilibrium

54
Guest Box 10: Phillip Island foxes

55
When should we be concerned about possible gametic disequilibrium? (1) Closely linked markers. (2) Small effective population size (3) Hybridization
 Closely linked markers. (2) Small effective population size (3) Hybridization.")
56
Gryllus firmus (F)G. pennsylvanicus (P) Example 10.3: Hybrid zone of field crickets
G. pennsylvanicus (P) Example 10.3: Hybrid zone of field crickets")
57
Yellowstone cutthroat trout (YCT) O. c. bouvieri Rainbow trout (RT) O. mykiss (Illustrations by Joseph R. Tomelleri ) Westslope cutthroat trout (WCT) Oncorhynchus clarki lewisi
 Westslope cutthroat trout (WCT) Oncorhynchus clarki lewisi.")
59
D = coefficient of gametic disequilibrium (measure of nonrandom association of two loci)
")
60
Genotypes at eight diagnostic allozyme loci and mtDNA from Forest Lake, Montana. W = homozygous WCT WY = heterozygous Y = homozygous YCT

61
Hybrid swarm: a population of individuals that all are hybrids by varying numbers of generations of backcrossing with parental types and mating among hybrids.

62
Decay of gametic disequilibrium

63
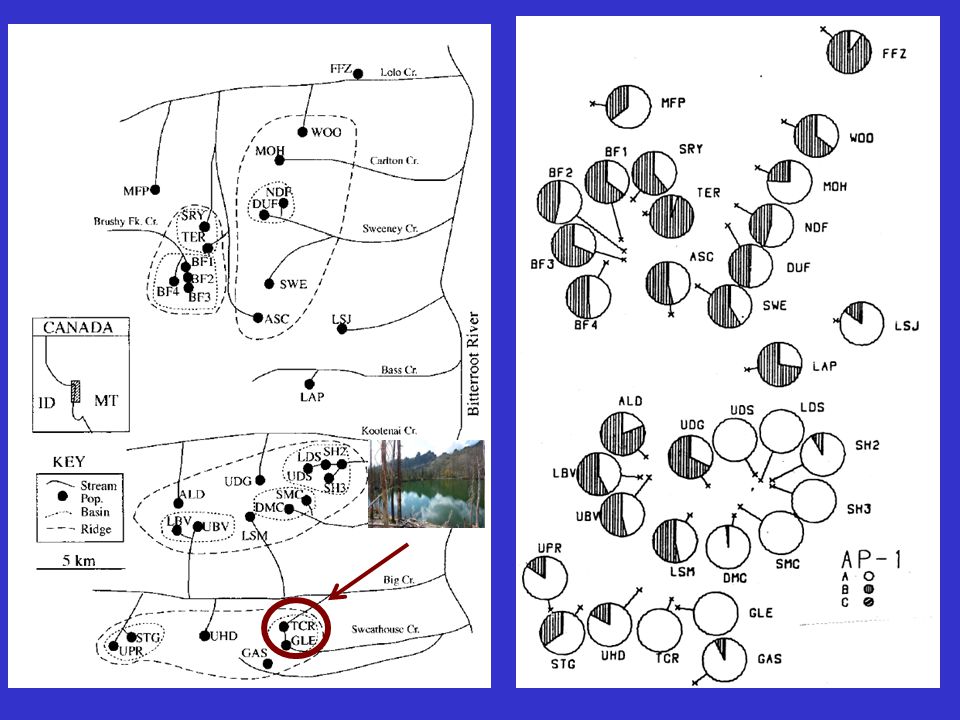
Which of these two hybrid swarms is older? Note: A, B, and C are linked pairs of loci.

66
Bull trout = BL (L= homozygous) Brook trout = BR (R = homozygous)
 Brook trout = BR (R = homozygous)")
Similar presentations


 from China Wang et al. PNAS Feb. 11, 2008.>")


 Linkage means A) Alleles at different loci are independent B) Alleles at different loci are physically close to each other and on the same chromosome.>")
 Inbreeding & pedigree analysis Discuss outlines.>")


, an ongoing question John R. Hyde Southwest Fisheries Science Center, La Jolla.>")
