Download presentation
Presentation is loading. Please wait.

1
Contour lines are lines drawn on a map connecting points of equal elevation, meaning if you physically followed a contour line, elevation would remain constant. Contour lines show elevation and the shape of the terrain. Topographic maps show lines for certain elevations only. These lines are evenly spaced apart. We call this spacing the contour interval. For example, if your map uses a 10-foot contour interval, you will see contour lines for every 10 feet of elevation -- lines at 0, 10, 20, 30, 40, and so on. Different maps use different intervals, depending on the topography.

2
COMPASS-ROSE - a symbol used on maps to show North-South-East-West orientation

3
MAP LEGENDS

4
Maps aren't life-sized. Otherwise we'd never be able to fit them in our backpacks. Instead, cartographers plot maps on a ratio scale, where one measurement on the map equals another larger amount in the real world.

5
THE SCALE OF A MAP IS THE RELATIONSHIP BETWEEN THE DISTANCE SHOWN ON THE MAP AND THE ACTUAL DISTANCE.

6
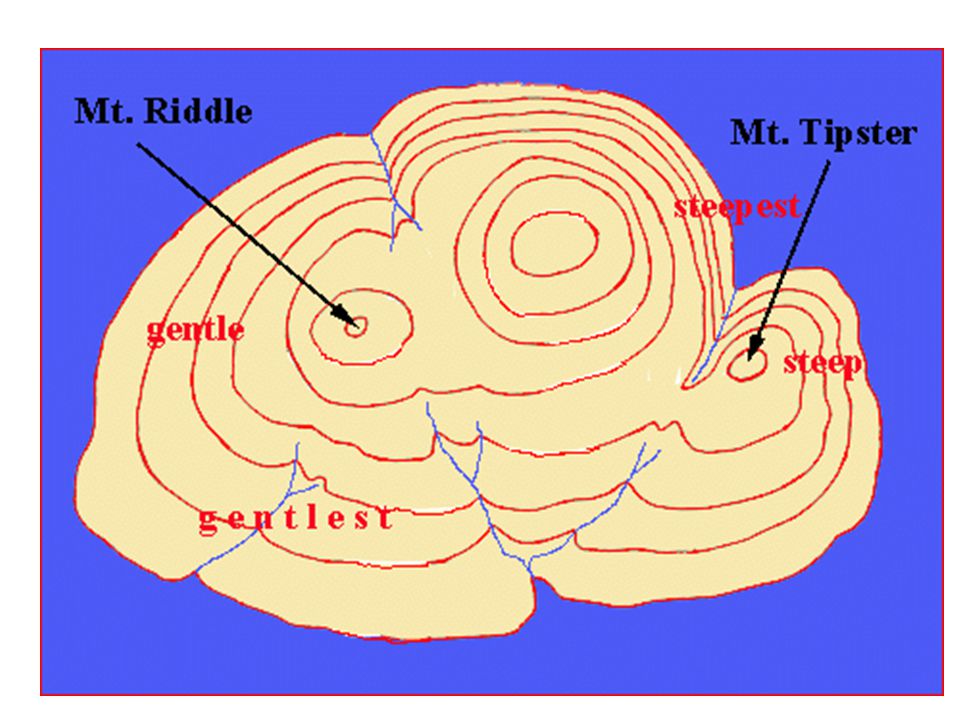
If the contours are close together, you're looking at a steep slope
If the contours are close together, you're looking at a steep slope. If the contours have wide spaces in between -- or aren't there at all -- the terrain is relatively flat. Lines are close together. This area has a steep slope The lines are spread apart. This area has a gentle slope. This area has no contour lines. It is flat land.

9
The land represented by contour lines
What the land looks like

10
HATCHURED CONTOURS DENOTE DEPRESSIONS.

11
THE V INDICATES A VALLEY WITH A STREAM RUNNING THROUGH IT.
WHEN CONTOUR LINES CROSS STREAMS, THEY “V” OR POINT UPSTREAM. IN WHICH DIRECTION IS PREY STREAM RUNNING?

12
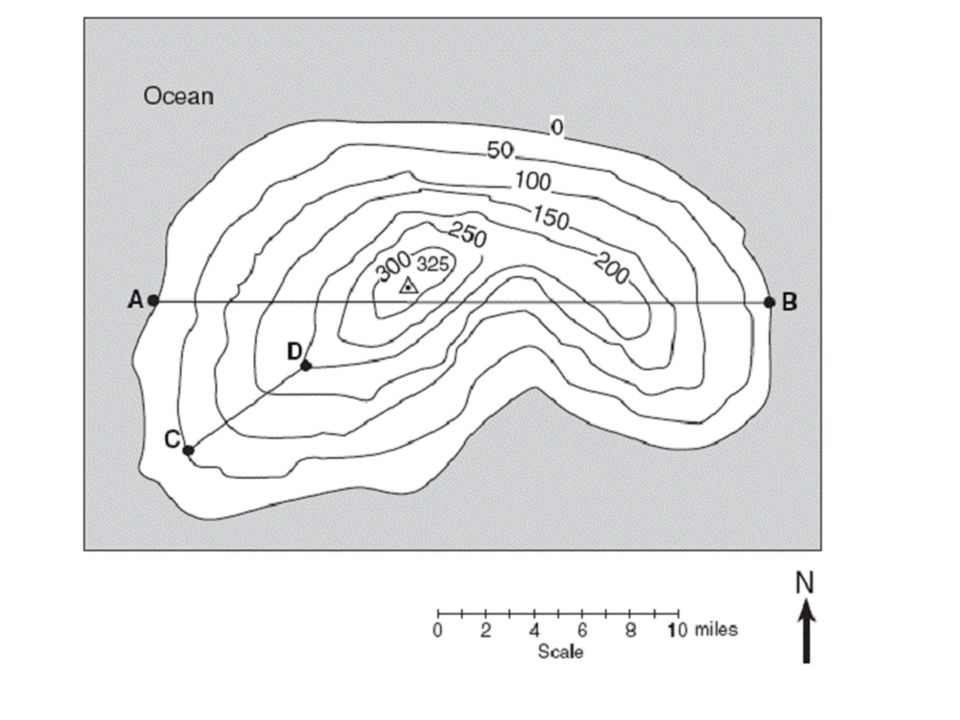
Labeling Contour Lines use the marked lines to figure out what the contour interval is.

13
GRADIENT IS THE CHANGE IN ELEVATION BETWEEN TWO POINTS OVER THE DISTANCE BETWEEN THE TWO POINTS.
Calculate the gradient between points X and Y.

14
What is a possible elevation for point X?

15
DRAWING CONTOUR LINES

16
DRAWING A PROFILE

18
1. What is the contour interval of this map? __________ 2. What is the highest elevation? __________ Lowest elevation? __________ 3. Measure the distance, in centimeters, from Point A to Point B. __________ Determine the elevation at Point C: __________ and Point D: __________ Difference (D-C): __________ 7. Calculate the elevation gradient between Point C and Point D: __________ * gradient = difference in field values ÷ distance between points Draw a profile that describes the elevation across line A-B.
: __________. 7. Calculate the elevation gradient between Point C and Point D: __________. * gradient = difference in field values ÷ distance between points. Draw a profile that describes the elevation across line A-B.")
Similar presentations


 of the Earth’s surface.>")


>")


