Download presentation
Presentation is loading. Please wait.

1
Validation of Tropospheric Emission Spectrometer (TES) nadir stare ozone profiles using ozonesonde measurements during Arctic Research on the Composition of the Troposphere from Aircraft and Satellites (ARCTAS) Boxe et al., in preparation (JGR)
 nadir stare ozone profiles using ozonesonde measurements during Arctic Research on the Composition of the Troposphere from Aircraft and Satellites (ARCTAS) Boxe et al., in preparation (JGR)")
2
NASA-JPL TES Team ARC-IONS Network Acknowledgements

3
Objectives 1)Validate TES V003 and V004 stare ozone retrievals with ozonesonde measurements. 2)To Show that TES ozone stare retrieval’s theoretical and empirical errors, and biases are small and consistent with previous validation investigations (Worden et al., 2007; Nassar et al., 2008). 3)To show that TES is sensitive to lower tropospheric ozone.
To Show that TES ozone stare retrieval’s theoretical and empirical errors, and biases are small and consistent with previous validation investigations (Worden et al., 2007; Nassar et al., 2008). 3)To show that TES is sensitive to lower tropospheric ozone..")
4
TES Stare Mode Stare: In nadir mode, point at specific locations over sites for validation and other scientific interest for up to about 4 minutes. Such observations are made for as long as the target is in within ±45° of the nadir direction (up to 210 seconds).
..")
5
TES Stare Mode – Bratt’s Lake, April 18 th, 2008

6
Ozonesondes are Vital for Validating TES Retrieval In Situ Vertical Profiling of Ozone Coincident with TES retrievals. Precision of ±(3–5)% and an accuracy of ~ ±(5–10)% up to 30 km altitude (Smit et al., 2007).
% and an accuracy of ~ ±(5–10)% up to 30 km altitude (Smit et al., 2007)..")
7
1)Electrochemical Concentration Cell (ECC) sondes (platinum- platinum, silver-platinum, and platinum-carbon electrodes). How do sondes work?

8
Error Analysis random instrument spectral errors f.s vector errors forward model errors f.s vector errors uncertainty due to unresolved fine structure

9
TES operator applied to sonde data a priori constraint vector TES averaging kernel Sonde Data accounts for TES sensitivity and vertical resolution

10
Arctic Intensive Ozonesonde Network Study (ARCIONS)
")
11
Spring and Summer TES ozone and ozonesonde comparisons Bratt’s Lake (April 2 nd, 2008), 50 o N, 105 o W Barrow (April 10 th, 2008), 71 o N, 157 o W Barrow (April 12th, 2008), 71 o N, 157 o W Barrow (April 14th, 2008), 71 o N, 157 o W Bratt’s Lake (April 18 th, 2008), 50 o N, 105 o W Egbert (July 5 th, 2008), 44 o N, 80 o W Yellowknife (July 5 th,2008), 62 o N, 114 o W Egbert (July 7 th, 2008), 44 o N, 80 o W Yellowknife (July 7 th,2008), 62 o N, 114 o W
, 50 o N, 105 o W Barrow (April 10 th, 2008), 71 o N, 157 o W Barrow (April 12th, 2008), 71 o N, 157 o W Barrow (April 14th, 2008), 71 o N, 157 o W Bratt’s Lake (April 18 th, 2008), 50 o N, 105 o W Egbert (July 5 th, 2008), 44 o N, 80 o W Yellowknife (July 5 th,2008), 62 o N, 114 o W Egbert (July 7 th, 2008), 44 o N, 80 o W Yellowknife (July 7 th,2008), 62 o N, 114 o W")
12
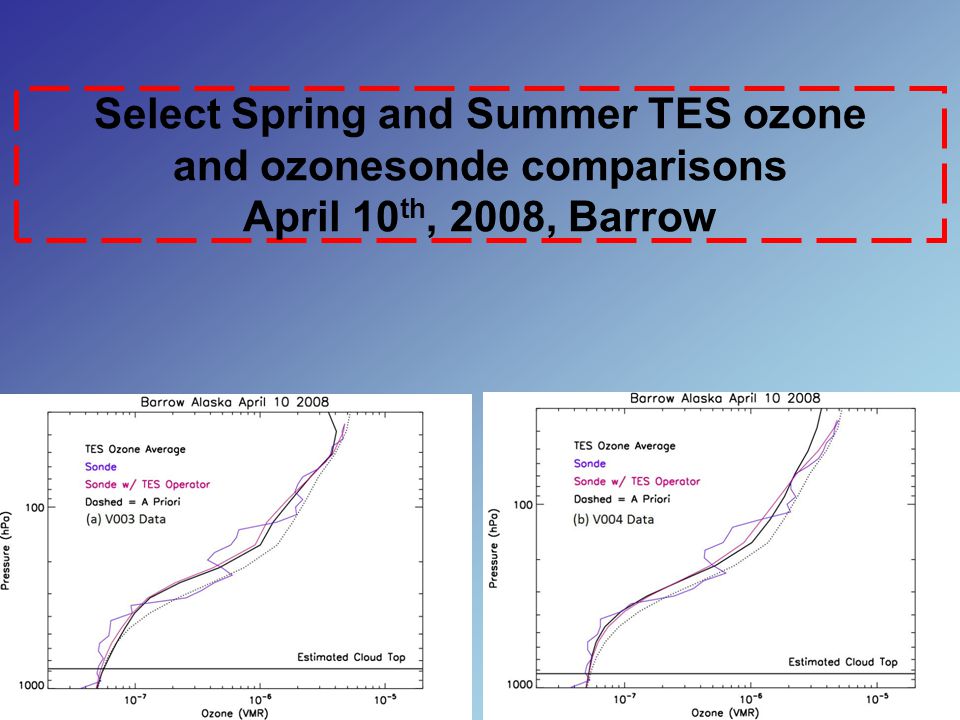
Select Spring and Summer TES ozone and ozonesonde comparisons April 10 th, 2008, Barrow

15
Select Spring and Summer TES ozone and ozonesonde comparisons April 10 t\h, 2008, Barrow

16
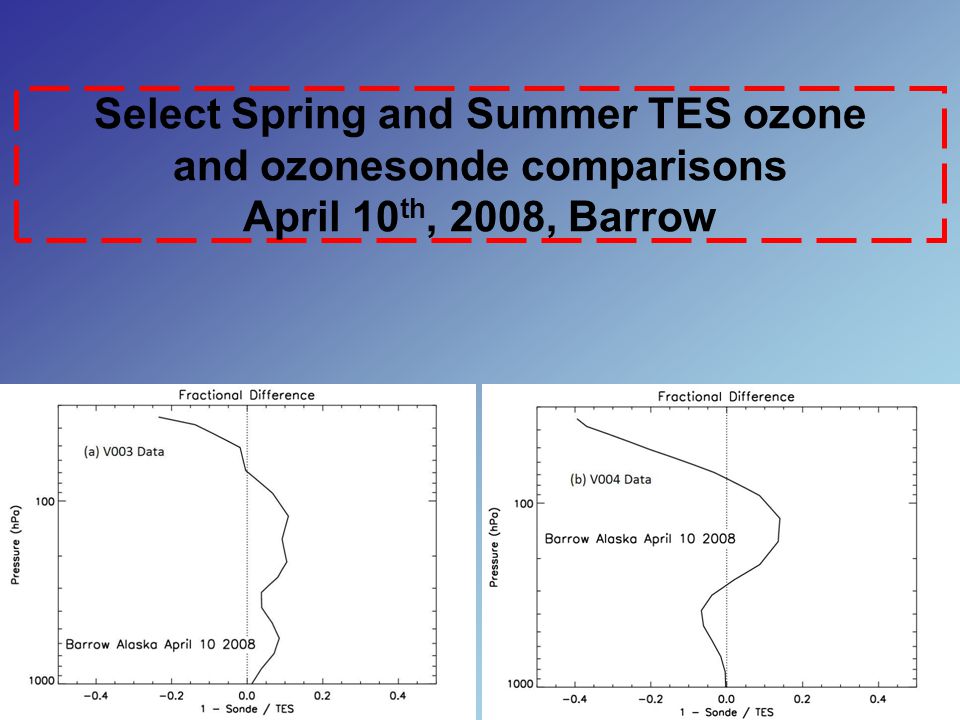
Select Spring and Summer TES ozone and ozonesonde comparisons April 10 th, 2008, Barrow

17
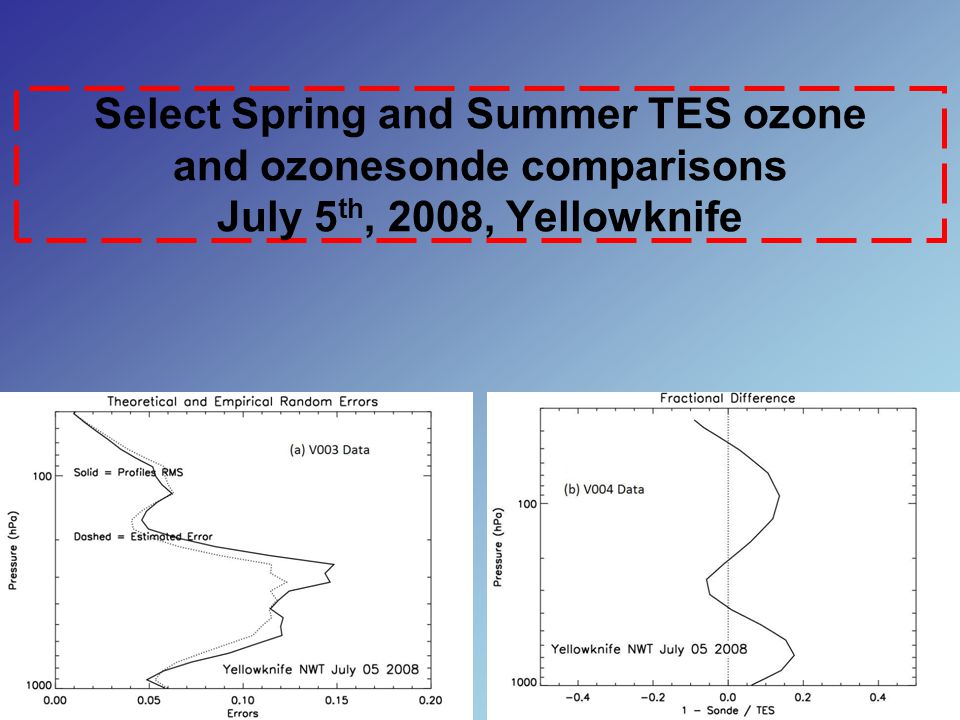
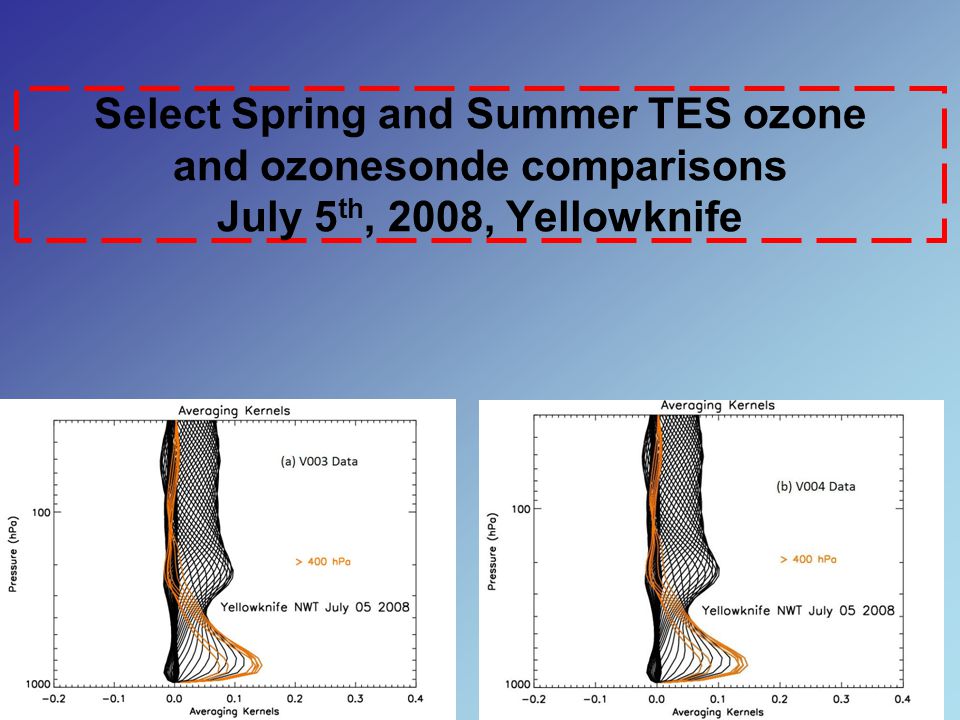
Select Spring and Summer TES ozone and ozonesonde comparisons July 5 th, 2008, Yellowknife

22
Conclusions 1.TES ozone profiles are usually positively biased (i.e., by no more than 15%) in the troposphere-to-mid-stratosphere and negatively biased in the upper stratosphere (i.e., by no more than 20%) when compared to ozondesonde data. Bias is consistent with prior sonde comparisons (H. Worden et al. 2007, 2006, 2004, and Nassar et al. 2008). 2.Theoretical and empirical errors are generally consistent, both showing analogous vertical distribution (~ 5 to 20% for V003 data and ~ 5 to 15% for V004 data). 3.TES is sensitive to lower tropospheric ozone, even very close to the surface.
. 2.Theoretical and empirical errors are generally consistent, both showing analogous vertical distribution (~ 5 to 20% for V003 data and ~ 5 to 15% for V004 data). 3.TES is sensitive to lower tropospheric ozone, even very close to the surface..")
Similar presentations


 nadir stare ozone profiles using ozonesonde measurements during Arctic Research on the Composition.>")


