Download presentation
Presentation is loading. Please wait.

1
Understanding Cost Structures at Child Care Centers Workshop Presented by Good Work Network Funded by Louisiana Department of Social Services Child Care and Early Childhood Education Division

2
TODAY’S AGENDA Breakeven Analysis Pricing Your Services Budgeting Cash Flow Projections Benchmarking Costs Trend Analysis Ratios Method Expense Analysis Quality Rating System Cost Impacts

3
Excel 101 What is a spreadsheet (worksheet)? What is a column What is a row? What is a cell? Entering data Formulas Practice

4
Spreadsheets A spreadsheet is a computerized equivalent of a paper ledger, used in businesses to create budgets and to perform financial analyses. Spreadsheets are made up of columns, rows, and cells.

5
Columns In a spreadsheet the COLUMN is defined as the vertical space that is going up and down the window. Letters are used to designate each COLUMN'S location. In the above picture column C is highlighted.

6
Rows In a spreadsheet a ROW is the horizontal space that goes across the worksheet. Numbers are used to designate each ROW'S location. In the above picture row 4 is highlighted.

7
Cells In a spreadsheet the CELL is defined as the space where a specified row and column intersect. Each CELL is assigned a name according to its COLUMN letter and ROW number. In the above picture cell B6 is highlighted. NOTE* When referencing a cell, always put the column letter first and the row number second.

8
Entering Data Three kinds of data can be entered into cells: 1) labels – text with no numerical value, used to explain the numbers 2) constants – just numbers, do not change 3) formulas – mathematical equations used to calculate values, can change depending on inputs
 labels – text with no numerical value, used to explain the numbers 2) constants – just numbers, do not change 3) formulas – mathematical equations used to calculate values, can change depending on inputs")
9
Formulas Formulas are entries that have an equation that calculates the value to display. Instead of typing in the numbers we are looking for; we type in the equation. This value will be updated upon the change or entry of any data that is referenced in the equation. This image shows a basic multiplication formula – C3 = C1*C2 or 6 = 2*3 Symbols: Addition: + Subtraction: - Multiplication: * Division: / Sum: ∑

10
Basic Definitions Revenue: The amount you receive from all sources for the services you provide. Expenses (Costs): The amount you expend for operating your business. Profit or Loss: Revenues minus expenses, profit if revenues exceed expenses; loss if expenses exceed revenues.
: The amount you expend for operating your business. Profit or Loss: Revenues minus expenses, profit if revenues exceed expenses; loss if expenses exceed revenues..")
11
Breakeven Analysis Breakeven Analysis is a tool that lets us determine that level of activity (number of paying customers or dollars of revenue) that will cover all of our expenses. The breakeven point is that point where the business has no profit and no loss.

12
Types of Costs Fixed Costs are those that do not change in total regardless of the number of children enrolled. Examples are rent, insurance, telephone. Variable Costs are those costs that vary directly with the number of children enrolled. An example is food costs. Step-Variable Costs those that vary with the number of children served but in increments larger than a per child amount. An example is teacher salaries.

13
Contribution Margin Contribution Margin is the amount of each dollar of Revenue that is available to cover Fixed Costs. The formula is: Revenue per Child - Variable Cost per Child Contribution Margin per Child

14
Breakeven Methodology Determine Average Revenue per Child Divide Costs into Variable and Fixed Determine Fixed Cost for the Period Determine Variable Costs per Child Subtract Variable Cost per Child from Average Revenue per Child to get Contribution Margin per Child Divide Contribution Margin per Child into Fixed Costs to get Breakeven Point

15
BREAKEVEN ANALYSIS EXERCISE

16
Pricing Your Services Pricing is an art not a science Have to be competitive Have to cover costs Important to understand how costs work

17
Law of Supply and Demand Generally the lower the price for an item the more demand there will be for it. Lowering your prices COULD (but certainly not always) increase your profitability.
 increase your profitability..")
18
Pricing Exercise Assume the following Fixed Costs: $20,000 per month Variable Cost per Child per Month: $120 What should the average price per child per month be?

19
PRICING EXAMPLES

20
Developing a Budget Establish a time period the budget will cover (usually a month or year) Determine fixed costs and fill in Determine variable costs per child Determine revenue per child Determine number of children to be served
 Determine fixed costs and fill in Determine variable costs per child Determine revenue per child Determine number of children to be served")
21
Budgeting Tips Start with last years actual numbers and adjust as necessary Include amounts for contingencies in many items Be conservative when preparing budget for internal use Be optimistic but realistic when preparing projections for lenders Compare actual to budget regularly Make adjustment quickly when profits or cash flows turn negative

22
BUDGETING TEMPLATE

23
CASH FLOWS vs. PROFITS Not all revenues are received in the month in which the services are provided (state subsidies) Not all expenses are disbursed in the month in which they are incurred (payroll taxes) Some expenses do not result in cash disbursements (depreciation) Some cash disbursements are not expenses (purchase of equipment or repayment of loans) Some cash receipts are not revenues (loans or investments by owners)
 Not all expenses are disbursed in the month in which they are incurred (payroll taxes) Some expenses do not result in cash disbursements (depreciation) Some cash disbursements are not expenses (purchase of equipment or repayment of loans) Some cash receipts are not revenues (loans or investments by owners).")
24
Importance of Projecting Cash Flows Overdrawing your checking account is not a good thing Not having the cash to pay your employees is not a good thing Not paying your payroll taxes when they are due is not a good thing Having to go out of business when you are profitable but run out of cash is heartbreaking

25
Moving from Budget to Cash Flows Projections Subtract from Profit or Loss Increases in Receivables Decreases in Payables Repayment of Loans Dividends to Owners Purchases of Equipment or Fixed Assets Add to Profit or Loss Depreciation Decreases in Receivables Increases in Payables Money Borrowed from Bank Money Invested by Owners

26
Keeping Track of Actual Revenue and Expenses Deposit all revenues to business checking account (do not pay cash expenses with cash receipts) Pay for all expenses out of business checking account Don’t pay personal expenses from business checking account If possible use accounting software (for example QuickBooks) to record all business financial transactions. Produce Income (Profit and Loss) Statements monthly and review.
 Statements monthly and review..")
27
Sample Income Statement

28
Sample Budget vs. Actual Income Statement

29
Benchmarking Costs Ratios, trends and expense analysis

30
Trend Analysis Trend analyses track cost percentages over time and can give us a better picture of what is happening with our business.

31
Trend Analysis Exercise

32
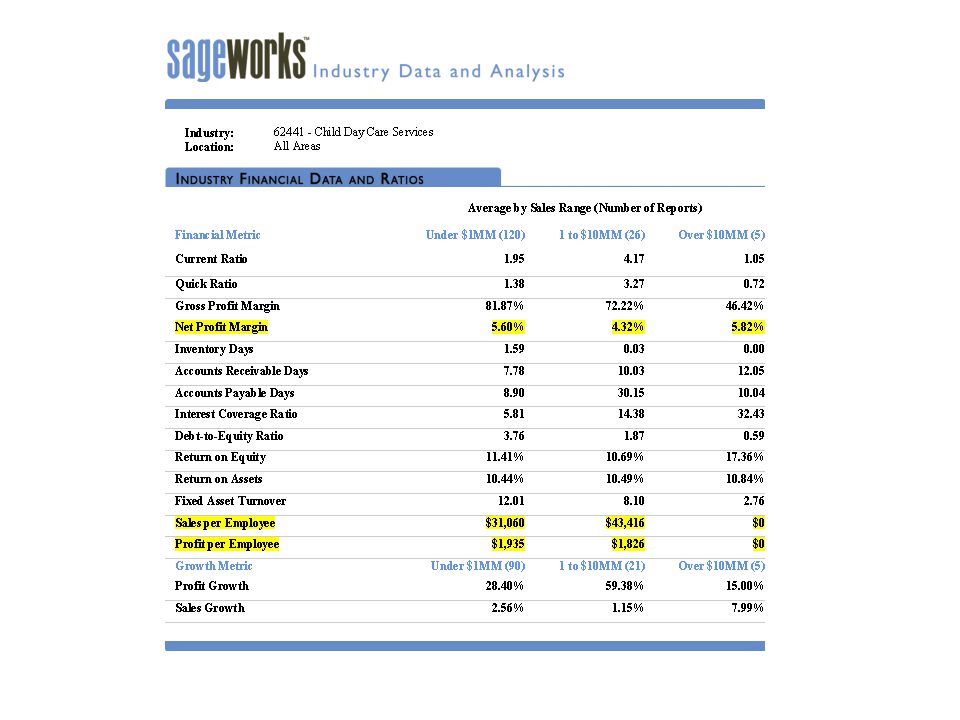
Ratio Analysis Ratios can measure certain aspects of the business and can be compared to industry averages to gage how well we are doing in relation to other childcare providers.

34
Quality Rating System Improving staff-child ratios by the age of the child and the setting of care Improved minimum credential requirements for child care providers Increased average salary and benefit levels of providers Improved professional development opportunities Improved monitoring or evaluation requirements Improved ERS ratings

35
North Carolina Quality Rating System Cost Structures

36
Quality Rating System/School Readiness Tax Credit Incentives For Providers (based on star level): 2-star = $750 per child, 5-star = $1500 per child For Parents (based on star level of center): Increase to existing credit of 50% for 2-star center, 200% for 5-stars For Teachers (based on teachers education): Up to 15% income increase For Businesses (based on star level of center): 2-star=5% of expenses, 5-star = 20% of expenses
: 2-star = $750 per child, 5-star = $1500 per child For Parents (based on star level of center): Increase to existing credit of 50% for 2-star center, 200% for 5-stars For Teachers (based on teachers education): Up to 15% income increase For Businesses (based on star level of center): 2-star=5% of expenses, 5-star = 20% of expenses")
37
Quality Rating System/School Readiness Tax Credit Incentives Eventually will show up as added revenue Will create wage supplements for teachers -centers will be able to retain quality teachers without taking on additional payroll costs

38
Thanks for being here.

Similar presentations