Download presentation
Presentation is loading. Please wait.

1
2014 Accountability System 2014 Accountability System Jana Schreiner Senior Consultant Accountability State Assessment 972-348-1480 Jana.Schreiner@Region10.org Jana.Schreiner@Region10.org

2
Resources http://ritter.tea.state.tx.us/perfreport/account/ 2014/index.html www.lead4ward.com www.region10.org/accountability

3
Reading Percent Meeting Phase In Standard Level II: Satisfactory Percent Meeting Recommended Standard Level II: Satisfactory Region 2013Region 2014Region 2013Region 2014 Grade 5 79% 79% NC 44% 46% +2 Grade 8 86% 85% -1 51% 50% -1 Math Percent Meeting Phase In Standard Level II: Satisfactory Percent Meeting Recommended Standard Level II: Satisfactory Region 2013Region 2014Region 2013Region 2014 Grade 5 75% 80% +5 42% 45% +3 Grade 8 77% 80% +3 35% 39% +4

4
5 th and 8 th Reading and Math

5
Agenda Overview Accountability System Ratings Safeguards Distinctions

6
2014 Ratings Labels Rating based on 4 Indexes

7
Performance Index Framework Index 1Index 2Index 3Index 4 Student Achievement Student ProgressClosing Performance Gaps Postsecondary Readiness Rating based on 4 Performance Indexes

10
Performance Standards on STAAR 1 st Phase-in Level II 2 nd Phase-in Level II Final Level II Performance Unknown Dec. 2014 Could Change

12
Index 1: Student Achievement Index 1: Student Achievement provides an overview of student performance based on satisfactory student achievement across all subjects for all students. 2013 Combined over All Subjects: Reading, Mathematics, Writing, Science, and Social Studies. Student Groups: All Students. Performance Standards: Phase-in 1 Level II (Satisfactory). STAAR End-of-Course (EOC) Assessments (15 total): Reading I; Reading II; Reading III Writing I; Writing II; Writing III Algebra l; Geometry; Algebra ll Biology; Chemistry; Physics World Geography; World History; US History English Language Learners (English and Spanish tests): ELLs in US schools Years 1-3 excluded ELLs in US schools Year 4 or more included 2014 Combined over All Subjects: Reading, Mathematics, Writing, Science, and Social Studies. Student Groups: All Students. Performance Standards: Phase-in 1 Level II (Satisfactory). STAAR End-of-Course (EOC) Assessments (5 total): English l; English ll Algebra l Biology US History English Language Learners (English and Spanish tests): ELLs in US schools Year 1 excluded ELLs in US schools Year 2 and beyond included
. STAAR End-of-Course (EOC) Assessments (15 total): Reading I; Reading II; Reading III Writing I; Writing II; Writing III Algebra l; Geometry; Algebra ll Biology; Chemistry; Physics World Geography; World History; US History English Language Learners (English and Spanish tests): ELLs in US schools Years 1-3 excluded ELLs in US schools Year 4 or more included 2014 Combined over All Subjects: Reading, Mathematics, Writing, Science, and Social Studies. Student Groups: All Students. Performance Standards: Phase-in 1 Level II (Satisfactory). STAAR End-of-Course (EOC) Assessments (5 total): English l; English ll Algebra l Biology US History English Language Learners (English and Spanish tests): ELLs in US schools Year 1 excluded ELLs in US schools Year 2 and beyond included.")
13
Index 1: Student Achievement English I and II from Spring 2014 + Include Reading I and II from July 2013 and December 2013 Substitute Assessments EOCs (PSAT, PLAN, SAT, ACT, AP) Standard at Meeting Final Level II (CCR Standard) Counted as PASSER for Index I Counted as Meeting CCR Standard for Index IV Not used in Index 2 and 3
 Standard at Meeting Final Level II (CCR Standard) Counted as PASSER for Index I Counted as Meeting CCR Standard for Index IV Not used in Index 2 and 3")
17
Index 2: Student Progress Progress Measures by Subject Area and School Type 2013 Elem. SchoolMiddle SchoolHigh School READING Gr. 4 ReadingGr. 6 ReadingEnglish l Reading Gr. 5 ReadingGr. 7 ReadingEnglish ll Reading _Gr. 8 Reading_ _English l Reading_ MATHEMATICS Gr. 4 MathematicsGr. 6 MathematicsAlgebra l Gr. 5 MathematicsGr. 7 Mathematics_ _Gr. 8 Mathematics_ _Algebra l_ WRITING __English ll Writing Proposed 2014 Elem. SchoolMiddle SchoolHigh School READING Gr. 4 ReadingGr. 6 Reading_ Gr. 5 ReadingGr. 7 Reading_ _Gr. 8 Reading_ ___ MATHEMATICS Gr. 4 MathematicsGr. 6 MathematicsAlgebra l Gr. 5 MathematicsGr. 7 Mathematics_ _Gr. 8 Mathematics_ _Algebra l_ WRITING ___

18
STAAR Weighted Progress Rate All Student s African Amer. Amer. Indian Asian Hispani c Pacific Islande r White Two or More Races ELL Special Ed. Total Points Max. Points Example Calculation for Reading Progress Number of Tests 100504030 Performance Results: Met or Exceeded Progress Number Percent 80 80% 40 80% 40 100 % 20 67% Exceeded Progress Number Percent 20 20% 20 40% 30 75% 5 17% Reading Weighted Progress Rate 10012017584479800 18 Index 2: Student Progress Index 2: 2013 Construction – Table 1

19
STAAR Weighted Progress Rate All Students Africa n Amer. Amer. Indian Asian Hispani c Pacific Islande r White Two or More Races ELL Special Ed. Total Points Max. Points Reading Weighted Progress 10012017584479800 Mathematics Weighted Progress 8598150160493800 Writing Weighted Progress 140170310400 Total12822000 Index 2 Score (total points divided by maximum points)64 Index 2: 2013 Construction – Table 2 Index 2: Student Progress
64 Index 2: 2013 Construction – Table 2 Index 2: Student Progress.")
20
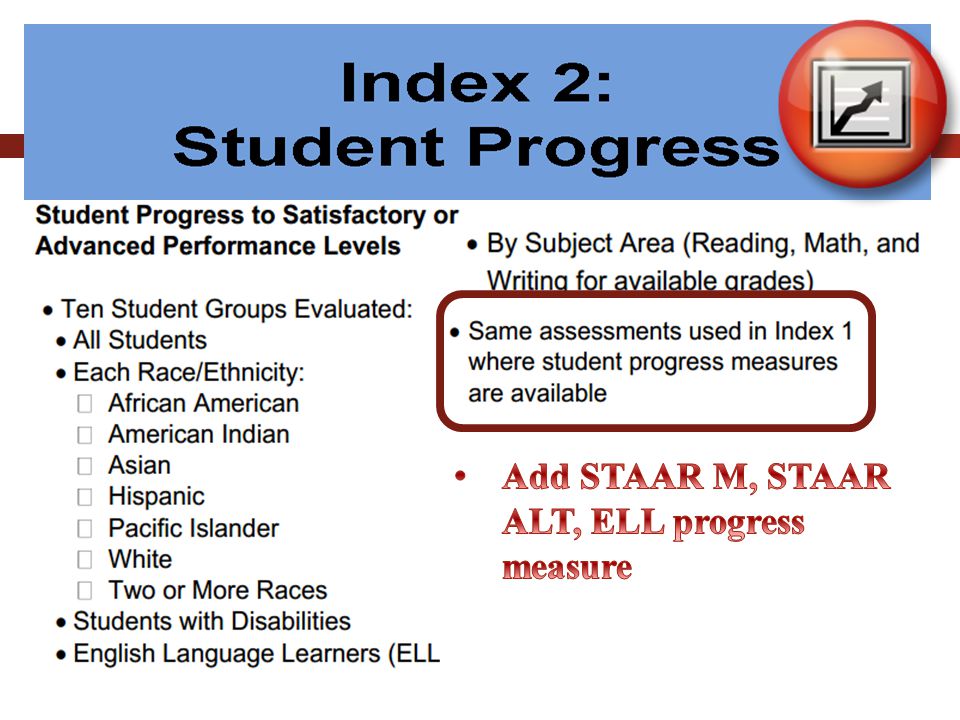
Index 2: Student Progress focuses on actual student growth independent of overall achievement levels for each race/ethnicity student group, students with disabilities, and English language learners. By Subject Area: Reading, Mathematics One point for Met progress level Two points for Exceeded progress level Progress Measures by Subject Area and School Type New for 2014: No Index 2 for High Schools (9-12 campuses) or AEA Inclusion STAAR-Modified, STAAR-Alt Inclusion of ELL Students Index 2: Student Progress
 or AEA Inclusion STAAR-Modified, STAAR-Alt Inclusion of ELL Students Index 2: Student Progress.")
21
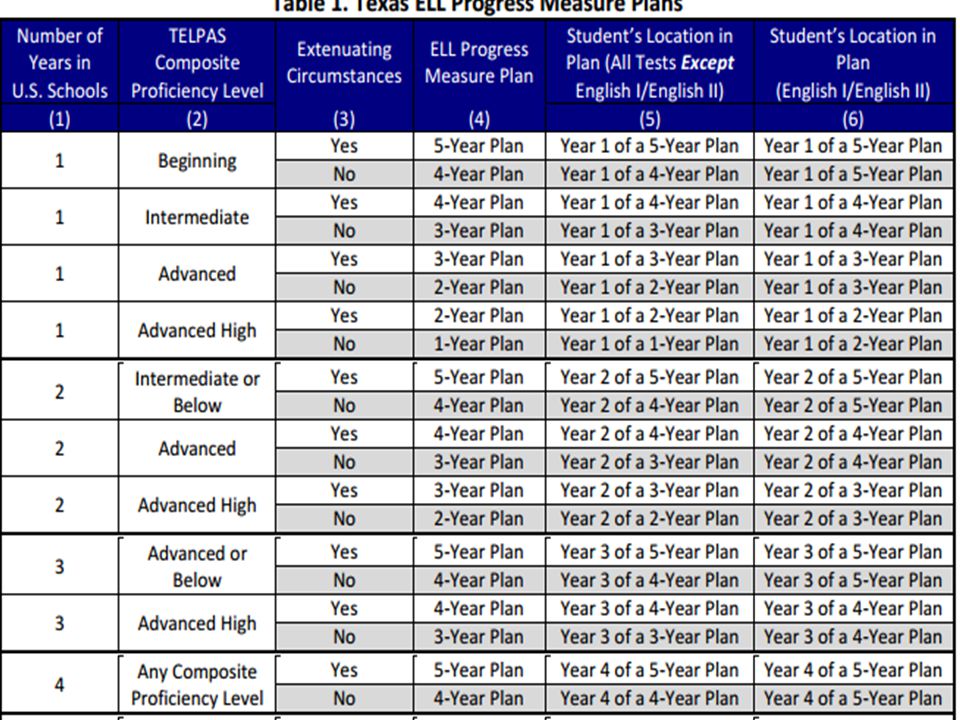
Index 2: Student Progress focuses on actual student growth independent of overall achievement levels for each race/ethnicity student group, students with disabilities, and English language learners. New for 2014: Students who skip grades included Students who transition from Spanish to English in mathematics included 3 rd grade student who receive ELL progress measure will count ELL Denials: Students whose parent(s) have denied ELL services included Considered as Non-ELL student for Index 2 Index 2: Student Progress
 have denied ELL services included Considered as Non-ELL student for Index 2 Index 2: Student Progress.")
22
Where can I find info? Campus rosters Student have either STAAR Progress or ELL Progress

24
2013 Points based on STAAR performance: Phase-in 1 Level II satisfactory performance: One point for each percent of tests MET Phase-in 1 Level II By Subject Area: Reading, Mathematics, Writing, Science, and Social Studies. Student Groups: Economically Disadvantaged Lowest Performing Race/Ethnicity from 2012 Index 3: Closing Performance Gaps Index 3: Closing Performance Gaps emphasizes advanced academic achievement of economically disadvantaged students and the two lowest performing race/ethnicity student groups. 2014 Points based on STAAR performance: Phase-in 1 Level II satisfactory performance: One point for each percent of tests MET Phase-in 1 Level II Level III advanced performance: Two points for each percent of tests at the Level III advanced performance standard. By Subject Area: Reading, Mathematics, Writing, Science, and Social Studies. Student Groups: Economically Disadvantaged Lowest Performing Race/Ethnicity from 2013…groups must have 25 tests in reading AND math Inclusion of ELL Students

26
Index 3: Closing Performance Gaps Index 3: 2014 Construction – Table 1 (based on 2014 STAAR performance) STAAR Weighted Performance Rate Economically Disadvantaged Lowest Performing Race/Ethnic Group - 1 Lowest Performing Race/Ethnic Group - 2 Total Points Maximum Points Example Calculation for Reading Weighted Performance Number of Tests 804025 Performance Results: Phase-in 1 Level II Satisfactory and above Number Percent 80 100% 20 50% 25 100% Level III Advanced Number Percent 40 50% 0 0% 25 100% Reading Weighted Performance Rate 15050200400600
 STAAR Weighted Performance Rate Economically Disadvantaged Lowest Performing Race/Ethnic Group - 1 Lowest Performing Race/Ethnic Group - 2 Total Points Maximum Points Example Calculation for Reading Weighted Performance Number of Tests Performance Results: Phase-in 1 Level II Satisfactory and above Number Percent % 20 50% % Level III Advanced Number Percent 40 50% 0 0% % Reading Weighted Performance Rate")
27
STAAR Weighted Performance Rate Economically Disadvantaged Lowest Performing Race/Ethnic Group - 1 Lowest Performing Race/Ethnic Group - 2 Total Points Maximum Points Reading Weighted Performance 15050200400600 Mathematics Weighted Performance 12510090315600 Writing Weighted Performance 8090125295600 Science Weighted Performance 1204090250600 Social Studies Weighted Performance 504080170600 Total14303000 Index 3 Score (total points divided by maximum points)48 Index 3: 2014 Construction – Table 2 (based on 2014 assessment results by subject area) Index 3: Closing Performance Gaps
48 Index 3: 2014 Construction – Table 2 (based on 2014 assessment results by subject area) Index 3: Closing Performance Gaps")
28
For Discussion…… ELL http://ritter.tea.state.tx.us/perfreport/account/2014/index.html

29
Index 4: Postsecondary Readiness 2013 Graduation Score: Combined performance across the graduation and dropout rates for: Grade 9-12 Four-Year Graduation Rate for All Students and all student groups; or Grade 9-12 Five-Year Graduation Rate for All Students and all student groups, whichever contributes the higher number of points to the index. RHSP/DAP Graduates: All Students and race/ethnicity student groups. Index 4: Postsecondary Readiness emphasizes the importance of earning a high school diploma that provides students with the foundation necessary for success in college, the workforce, job training programs, or the military; and the role of elementary and middle schools in preparing students for high school. 2014 Graduation Score: Combined performance across the graduation and dropout rates for: Grade 9-12 Four-Year Graduation Rate for All Students and all student groups; or Grade 9-12 Five-Year Graduation Rate for All Students and all student groups, whichever contributes the higher number of points to the index. RHSP/DAP Graduates: All Students and race/ethnicity student groups. STAAR Score: STAAR Percent Met Final Level ll for All Students and race/ethnicity student groups. Additional Indicators Required by House Bill 5 (83rd Texas Legislature, 2013) College Ready Graduates.
 College Ready Graduates..")
31
Index 4: Postsecondary Readiness Indicator All Students African Amer. Amer. Indian AsianHispanic Pacific Islander White Two or More Races ELL Special Ed. Total Points Max. Points STAAR Score STAAR % Met Final Level ll on Two or More Tests 29%16%40%23%38%36%182600 STAAR Score (STAAR total points divided by maximum points)30 Graduation Score (Gr. 9-12) 4-yr. graduation rate84.3%78.8% 91.6%86.0%44.2%69.8%533.5700 5-yr. graduation rate85.1%78.8%80.0%92.1%84.0%48.9%77.5%546.4700 Highest Graduation Total546.4700 Graduation Score (best of total graduation points divided by maximum points)78.0 RHSP/DAP Score 4-yr. graduation Percent RHSP/DAP 82.7%76.4%83.6%83.0%325.7400 RHSP/DAP Score (best of total RHSP/DAP points divided by maximum points)81.4 Postsecondary/College-Ready Graduates Score College-Ready Graduates subject (ELA & Math) 82.0%72.0%78.0%89.0%321.0400 College-Ready Score (total points divided by maximum points)80.2 Overall Index Score STAAR Score30.0 Multiply by Weight Graduation Score78.0 RHSP/DAP Score81.4 College-Ready Score80.2 Index Score (sum of weighted index scores)
30 Graduation Score (Gr. 9-12) 4-yr. graduation rate84.3%78.8% 91.6%86.0%44.2%69.8% yr. graduation rate85.1%78.8%80.0%92.1%84.0%48.9%77.5% Highest Graduation Total Graduation Score (best of total graduation points divided by maximum points)78.0 RHSP/DAP Score 4-yr. graduation Percent RHSP/DAP 82.7%76.4%83.6%83.0% RHSP/DAP Score (best of total RHSP/DAP points divided by maximum points)81.4 Postsecondary/College-Ready Graduates Score College-Ready Graduates subject (ELA & Math) 82.0%72.0%78.0%89.0% College-Ready Score (total points divided by maximum points)80.2 Overall Index Score STAAR Score30.0 Multiply by Weight Graduation Score78.0 RHSP/DAP Score81.4 College-Ready Score80.2 Index Score (sum of weighted index scores).")
32
Index 4: Postsecondary Readiness STAAR Level II Final Performance Percent Met Final Level II on Two or More Assessments Weighting of Indicators: ALL FOUR components Post-Secondary Indicator: Percent Met Criteria on ELA AND MATH IndicatorWeight STAAR Component25% Graduation25% Graduation Plan25% Post-Secondary Indicators25% 32

33
Index 4 Targets Elementary-12 Middle School-13 High School- 18 21(changed as of April 25 th posting)* District--13 Districts, high schools, and multi- grade campuses-56 57 (changed as of April 25 th posting)* STAAR ComponentAll four components
* District--13 Districts, high schools, and multi- grade campuses (changed as of April 25 th posting)* STAAR ComponentAll four components")
35
Rating Labels: AEA 2014 System Standard accountability labels: Met Alternative Standard Improvement Required

36
Distinction Designations 2013 Distinction Designation Campus Top Twenty-Five Percent: Campuses in the top quartile of their campus comparison group earn a distinction designation. Student Progress based on Index 2 Academic Achievement in: Reading/ELA Mathematics 2014 Distinction Designation Campus Top Twenty-Five Percent: Campuses in the top quartile of their campus comparison group Student Progress (based on Index 2) Closing Performance Gaps (based on Index 3) Academic Achievement in: Reading/English Language Arts Mathematics Science Social Studies Districts and Campuses Postsecondary Readiness: House Bill 5 (83 rd Texas Legislature, 2013) expanded distinctions for districts and campuses for attainment of postsecondary readiness Criteria must include indicators based on percentages of students who: Achieve college-readiness standards on STAAR; Earn nationally/internationally recognized business/industry certification; Complete a coherent sequence of CTE courses; Complete dual credit or a postsecondary course for local credit; Achieve college readiness standards on SAT, ACT, PSAT, or ACT-PLAN; Earn college credit based on AP/IB performance.
 Closing Performance Gaps (based on Index 3) Academic Achievement in: Reading/English Language Arts Mathematics Science Social Studies Districts and Campuses Postsecondary Readiness: House Bill 5 (83 rd Texas Legislature, 2013) expanded distinctions for districts and campuses for attainment of postsecondary readiness Criteria must include indicators based on percentages of students who: Achieve college-readiness standards on STAAR; Earn nationally/internationally recognized business/industry certification; Complete a coherent sequence of CTE courses; Complete dual credit or a postsecondary course for local credit; Achieve college readiness standards on SAT, ACT, PSAT, or ACT-PLAN; Earn college credit based on AP/IB performance..")
38
Accountability Ratings and Distinction Designations 2013 and 2014 Accountability Rating (Districts and Campuses) 2013 Distinction Designations2014 Distinction Designations Met Standard Campuses Only Student Progress Academic Achievement: Reading/ELA Mathematics Districts and Campuses Postsecondary Readiness Campuses Only Student Progress Closing Performance Gaps Academic Achievement: Reading/ELA Mathematics Science Social Studies Improvement RequiredN/A
 2013 Distinction Designations2014 Distinction Designations Met Standard Campuses Only Student Progress Academic Achievement: Reading/ELA Mathematics Districts and Campuses Postsecondary Readiness Campuses Only Student Progress Closing Performance Gaps Academic Achievement: Reading/ELA Mathematics Science Social Studies Improvement RequiredN/A")
39
System Safeguards Safeguard Measures and Targets: Reporting system disaggregates performance by student group, performance level, and subject area. Performance rates are calculated from the assessment results used to calculate Index 1: Student Achievement. 2013 targets for the disaggregated system-safeguard results: STAAR performance target corresponds to Index 1 (50%); STAAR participation target required by federal accountability (95%); Federal graduation rate targets and improvement calculations for 4-year rate (78%) and 5-year rate (83%); and Federal limit on use of alternate assessments (1% and 2%).
; STAAR participation target required by federal accountability (95%); Federal graduation rate targets and improvement calculations for 4-year rate (78%) and 5-year rate (83%); and Federal limit on use of alternate assessments (1% and 2%)..")
40
40 IndicatorEntity All Students African Amer. Amer. Indian AsianHispanic Pacific Islander White Two or More Races Eco. Disadv. ELLSpecial Ed. Performance Rates* Reading State55% Federal79% n/a 79%n/a79%n/a79% Mathematics State55% Federal79% n/a 79%n/a79%n/a79% Writing55% Science55% Social Studies55% Participation Rates Reading95% Mathematics95% Federal Graduation Rates (including improvement targets) 4-year80% 5-year85% District Limits on Use of Alternative Assessment Results Reading Modified2%Not Applicable Alternate1%Not Applicable Mathematics Modified2%Not Applicable Alternate1%Not Applicable Texas Education Agency | Office of Assessment and Accountability | Division of Performance Reporting 2014 Accountability System Safeguard Measures and Targets * Targets for 2014 correspond to the performance target for Index 1: Student Achievement.
 4-year80% 5-year85% District Limits on Use of Alternative Assessment Results Reading Modified2%Not Applicable Alternate1%Not Applicable Mathematics Modified2%Not Applicable Alternate1%Not Applicable Texas Education Agency | Office of Assessment and Accountability | Division of Performance Reporting 2014 Accountability System Safeguard Measures and Targets * Targets for 2014 correspond to the performance target for Index 1: Student Achievement..")
Similar presentations


 Needs Assessment (Why ) Improvement Plan (How) Implement and Monitor.>")

 Ervin Knezek John Fessenden>")


