Download presentation
Presentation is loading. Please wait.

1
Graphing Using Slope - Intercept STEPS : 1. Equation must be in y = mx + b form 2. Plot your y – intercept ( 0, y ) 3. Using your y – intercept as a starting point, count your slope and plot another point. 4. Connect the points
 3. Using your y – intercept as a starting point, count your slope and plot another point. 4. Connect the points.")
2
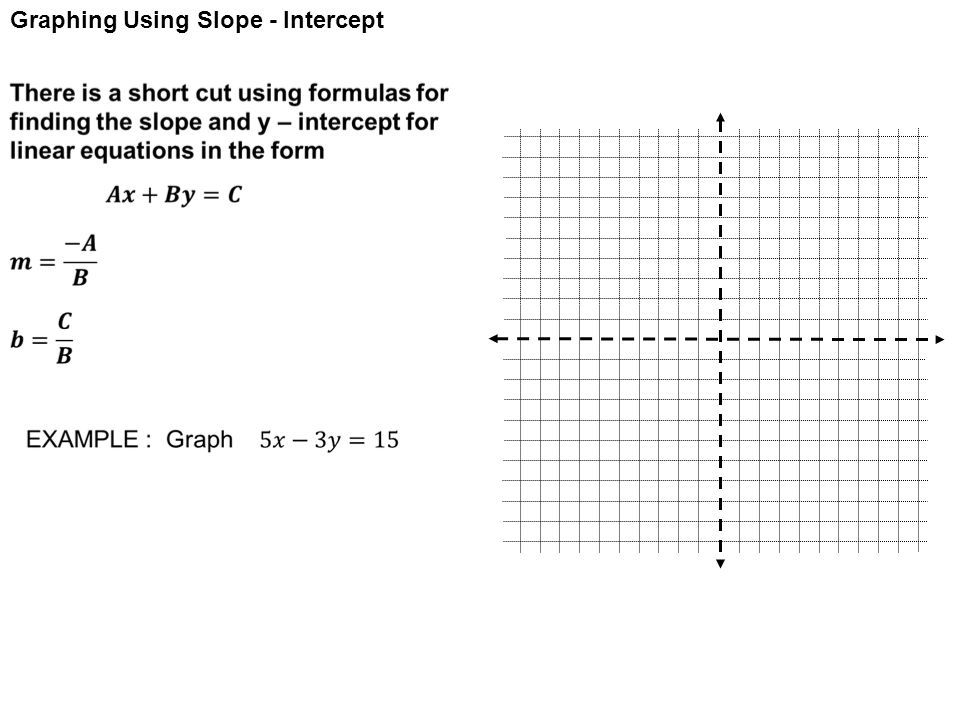
Graphing Using Slope - Intercept STEPS : 1. Equation must be in y = mx + b form 2. Plot your y – intercept ( 0, y ) 3. Using your y – intercept as a starting point, count your slope and plot another point. 4. Connect the points EXAMPLE : Graph
 3. Using your y – intercept as a starting point, count your slope and plot another point. 4. Connect the points EXAMPLE : Graph.")
3
Graphing Using Slope - Intercept STEPS : 1. Equation must be in y = mx + b form 2. Plot your y – intercept ( 0, y ) 3. Using your y – intercept as a starting point, count your slope and plot another point. 4. Connect the points EXAMPLE : Graph Equation is already in y = mx +b form
 3. Using your y – intercept as a starting point, count your slope and plot another point. 4. Connect the points EXAMPLE : Graph Equation is already in y = mx +b form.")
4
Graphing Using Slope - Intercept STEPS : 1. Equation must be in y = mx + b form 2. Plot your y – intercept ( 0, y ) 3. Using your y – intercept as a starting point, count your slope and plot another point. 4. Connect the points EXAMPLE : Graph Here is our intercept, so graph ( 0, 5 )
 3. Using your y – intercept as a starting point, count your slope and plot another point. 4. Connect the points EXAMPLE : Graph Here is our intercept, so graph ( 0, 5 ).")
5
Graphing Using Slope - Intercept STEPS : 1. Equation must be in y = mx + b form 2. Plot your y – intercept ( 0, y ) 3. Using your y – intercept as a starting point, count your slope and plot another point. 4. Connect the points EXAMPLE : Graph Here is our slope, so go up 2, right 1 2 1
 3. Using your y – intercept as a starting point, count your slope and plot another point. 4. Connect the points EXAMPLE : Graph Here is our slope, so go up 2, right")
6
Graphing Using Slope - Intercept STEPS : 1. Equation must be in y = mx + b form 2. Plot your y – intercept ( 0, y ) 3. Using your y – intercept as a starting point, count your slope and plot another point. 4. Connect the points EXAMPLE : Graph
 3. Using your y – intercept as a starting point, count your slope and plot another point. 4. Connect the points EXAMPLE : Graph.")
7
Graphing Using Slope - Intercept STEPS : 1. Equation must be in y = mx + b form 2. Plot your y – intercept ( 0, y ) 3. Using your y – intercept as a starting point, count your slope and plot another point. 4. Connect the points EXAMPLE : Graph
 3. Using your y – intercept as a starting point, count your slope and plot another point. 4. Connect the points EXAMPLE : Graph.")
8
Graphing Using Slope - Intercept STEPS : 1. Equation must be in y = mx + b form 2. Plot your y – intercept ( 0, y ) 3. Using your y – intercept as a starting point, count your slope and plot another point. 4. Connect the points EXAMPLE : Graph Solve for “y”
 3. Using your y – intercept as a starting point, count your slope and plot another point. 4. Connect the points EXAMPLE : Graph Solve for y .")
9
Graphing Using Slope - Intercept STEPS : 1. Equation must be in y = mx + b form 2. Plot your y – intercept ( 0, y ) 3. Using your y – intercept as a starting point, count your slope and plot another point. 4. Connect the points EXAMPLE : Graph Graph ( 0, - 3 )
 3. Using your y – intercept as a starting point, count your slope and plot another point. 4. Connect the points EXAMPLE : Graph Graph ( 0, - 3 ).")
10
Graphing Using Slope - Intercept STEPS : 1. Equation must be in y = mx + b form 2. Plot your y – intercept ( 0, y ) 3. Using your y – intercept as a starting point, count your slope and plot another point. 4. Connect the points EXAMPLE : Graph Up 1, right 4 1 4
 3. Using your y – intercept as a starting point, count your slope and plot another point. 4. Connect the points EXAMPLE : Graph Up 1, right")
11
Graphing Using Slope - Intercept STEPS : 1. Equation must be in y = mx + b form 2. Plot your y – intercept ( 0, y ) 3. Using your y – intercept as a starting point, count your slope and plot another point. 4. Connect the points EXAMPLE : Graph Up 1, right 4 1 4
 3. Using your y – intercept as a starting point, count your slope and plot another point. 4. Connect the points EXAMPLE : Graph Up 1, right")
12
Graphing Using Slope - Intercept

17
5 3

Similar presentations


 3. The y - intercept.>")


 3. The y - intercept.>")


 and (3, -4) m = y₂ - y₁ x₂ - x₁ -4 ->")
 = 16 1.>")


