Download presentation
Presentation is loading. Please wait.

1
Statistics [0,I/2] The Essential Mathematics
![Statistics [0,I/2] The Essential Mathematics](http://images.slideplayer.com/15/4666276/slides/slide_1.jpg "Statistics [0,I/2] The Essential Mathematics")
2
Two Forms of Statistics Descriptive Statistics What is physically happening within the data? Inferential Statistics What can I glean from a sample that is pertinent to the population?

3
Descriptive Statistics Measures of Center mean, median, mode Measures of Spread variance, standard deviation, range, IQR, outliers Measures of Shape kurtosis, skewness

4
Descriptive Statistics Measures of Center mean, median, mode Measures of Spread variance, standard deviation, range, IQR, outliers Measures of Shape kurtosis, skewness Exploratory Analysis

5
Measures of Center The expectation of what should happen in a given situation at random Traditionally, we see that as the mean, but that can also be the median or the mode in certain contexts

6
Situation You are interested in the body mass of full grown adults from one gender. If you were to find one person from that gender at random, what would you expect that person to weigh?

8
Mean Four types of means Arithmetic mean (typical interpretation) Geometric mean Harmonic mean (most conservative) Quadratic mean (pooling operation)
 Geometric mean Harmonic mean (most conservative) Quadratic mean (pooling operation)")
9
Arithmetic Mean Unbiased estimator for the population mean When should I be concerned with the mean? Data should be symmetric equally likely to see something relatively large as I am relatively small Typically, the first thing to look at

10
Arithmetic Mean Add them up, divide by the number of them

11
Symmetric without a picture? Line the data up from worst to first (maximum to minimum) Find the one in the middle Subtract the minimum from the middle and subtract the middle from the maximum Are those two values equal? Skewness (we’ll see that later)
 Find the one in the middle Subtract the minimum from the middle and subtract the middle from the maximum Are those two values equal. Skewness (we’ll see that later).")
12
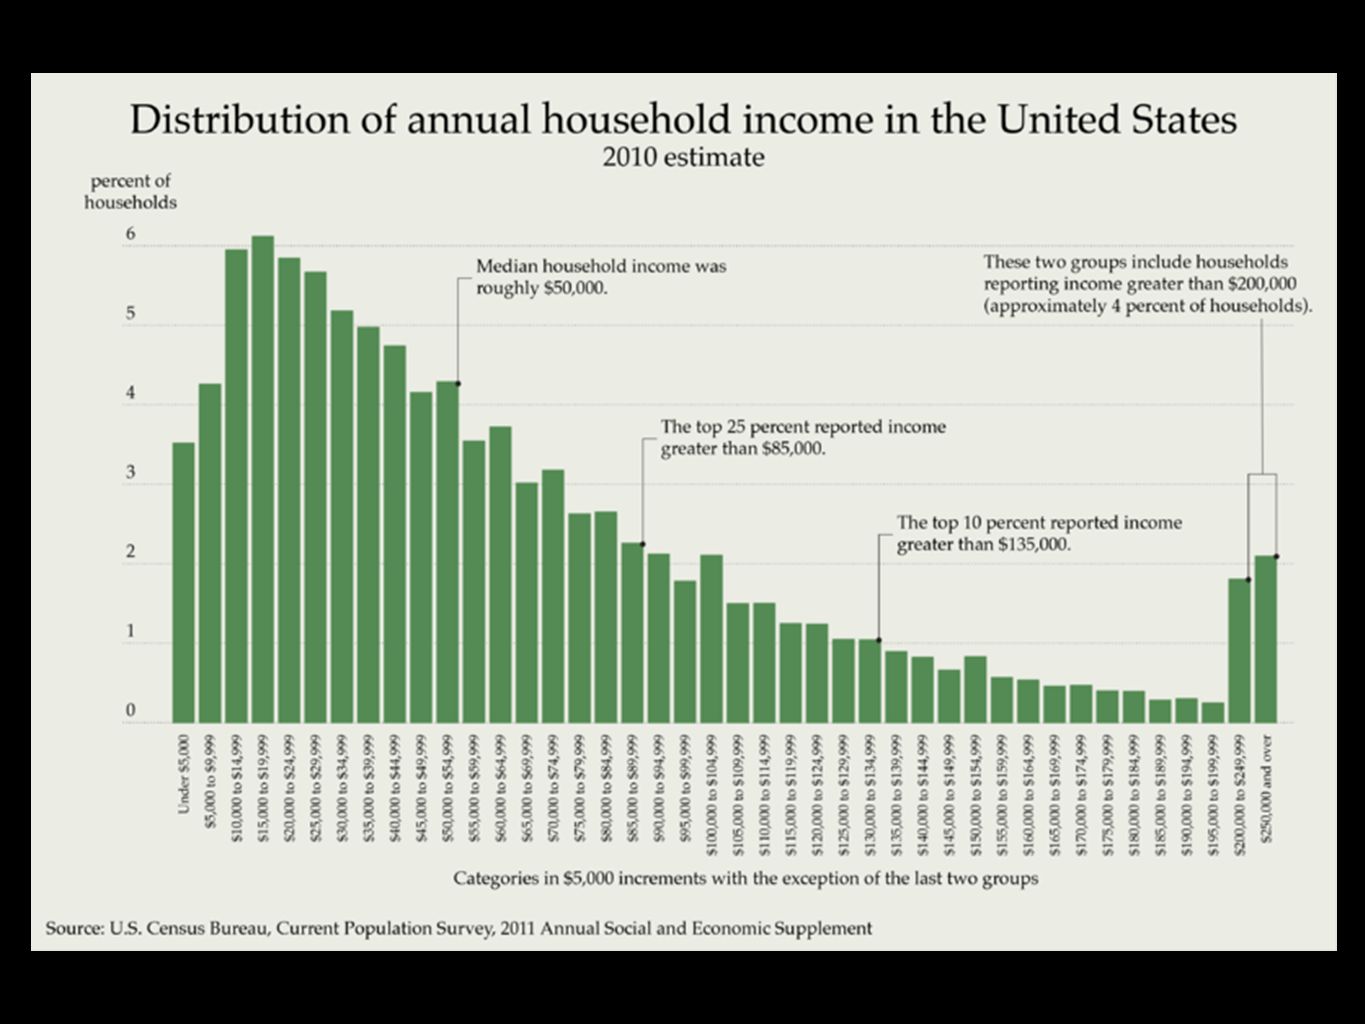
Situation You are interested in the economic conditions of a country (say the United States). If you were to select a household at random from the United States, how much money do you expect that household makes?

14
Median The exact middle observation of a set of data This is the mean when a set is symmetric When a set is asymmetric, these are different Not responsive to questionable influences The stoic of statistics

15
Median or Mean? Find the mean and the median How close are they? If they are “close”, use the mean If they are not close, typically use the median (this indicates skew)
.")
16
Situation You are an artificial intelligence programmer and are interested in how to assign algorithms for random occurrences in a football game that result in scores. What is the expected score that happens on that play?

17
Weird Scenario... Football has a few ways of scoring, but we know what the set is going to be composed of: Touchdown (typical): 7 Touchdown (2 pt. conversion): 8 Touchdown (failed conversion): 6 Field Goal: 3 Safety: 2 The “average score” on a play in football is probably somewhere between 4.5 and 5 We should, however, expect the score to be either 3 or 7
: 7 Touchdown (2 pt. conversion): 8 Touchdown (failed conversion): 6 Field Goal: 3 Safety: 2 The average score on a play in football is probably somewhere between 4.5 and 5 We should, however, expect the score to be either 3 or 7.")
18
Mode The mode is the most common observation in a dataset Sparingly used, but can be important If observations recur, why is that happening?

19
Questions: Which of the three makes sense based on my understanding of what should happen? Should this data be inherently symmetric? Should this data be pulled one way or the other? Should this data be predisposed to particular values? Answer these questions before you see it!

20
Measures of Spread What is the variation found within my data? Many different ways of looking at this (based on your choice of mean or median): Standard deviation/variance for mean Range/IQR for median
: Standard deviation/variance for mean Range/IQR for median.")
21
Variance Otherwise known as “residual error” Find the mean Take each observation and subtract the mean from it Square each value Add them up Divide by n-1

22
Variance If a set is “tight” to its mean, its variance will be low (we will call this leptokurtic later) If a set is “broad” to its mean, its variance will be higher (we will call this platykurtic later) Remember: the larger a residual, the higher the impact of squaring it is 5 2 = 25; 10 2 = 100, a factor of 4 when the residual doubled
 If a set is broad to its mean, its variance will be higher (we will call this platykurtic later) Remember: the larger a residual, the higher the impact of squaring it is 5 2 = 25; 10 2 = 100, a factor of 4 when the residual doubled")
23
Why square it? If we didn’t, variance would always be 0, rendering the statistic meaningless! Why? Variance allows us to see spread by making negative values positive and then adding more weight to something more distant (both effects of squaring)
.")
24
Why n-1? Degrees of freedom Makes us more conservative Dividing by larger numbers reduces values; dividing by smaller numbers assumes wider We don’t have everything, so tend to conservative

25
Standard Deviation Undoes the squaring procedure Gives us the “average” distance between an observation and the mean If variance is high, standard deviation will be high; if low, standard deviation will be low Great metric for “how far” questions as it normalizes observations

26
Range and IQR In the case of the median, percentile observations are the focus Minimum, maximum 25%, 75% Range = maximum - minimum IQR = 75% - 25% IQR defines outliers

27
Skewness Is a distribution symmetric or biased? The signum of skewness is the relationship between the mean and the median Mean > median --> positive skew Mean negative skew

29
Reasons for left skew A test or task were too easy Ever taken an exam where nearly everyone got a great grade, but someone struggled? That’s left skew...

30
Reasons for right skew A variable naturally has a left bound Time-based data Economics

32
Right tail transform Right tail skews are typically transformed using logarithms or square roots Why?

33
Kurtosis Is data predisposed to a particular central occurrence? Can’t be less than 1 (-2 excess) Positive values of kurtosis reflect high peaks (predisposition) Negative values of kurtosis reflect flatter peaks
 Positive values of kurtosis reflect high peaks (predisposition) Negative values of kurtosis reflect flatter peaks.")
36
Assignment You will be provided a dataset that comes from a questionnaire about ecological values (New Ecological Paradigm). You will be shown all of the values mentioned in this slide set and a bar graph of the responses Determine the appropriate measure of central tendency. Determine whether or not you feel there are effects such as biasing or predisposition occurring. Remember: gut instincts...do not do any tests!

37
NEP For your reference: High values on odd questions favor human endeavors High values on even questions favor the environment

Similar presentations


 MODULE 2 NUMERICAL DATA REPRESENTATION.>")
