Download presentation
Presentation is loading. Please wait.

5
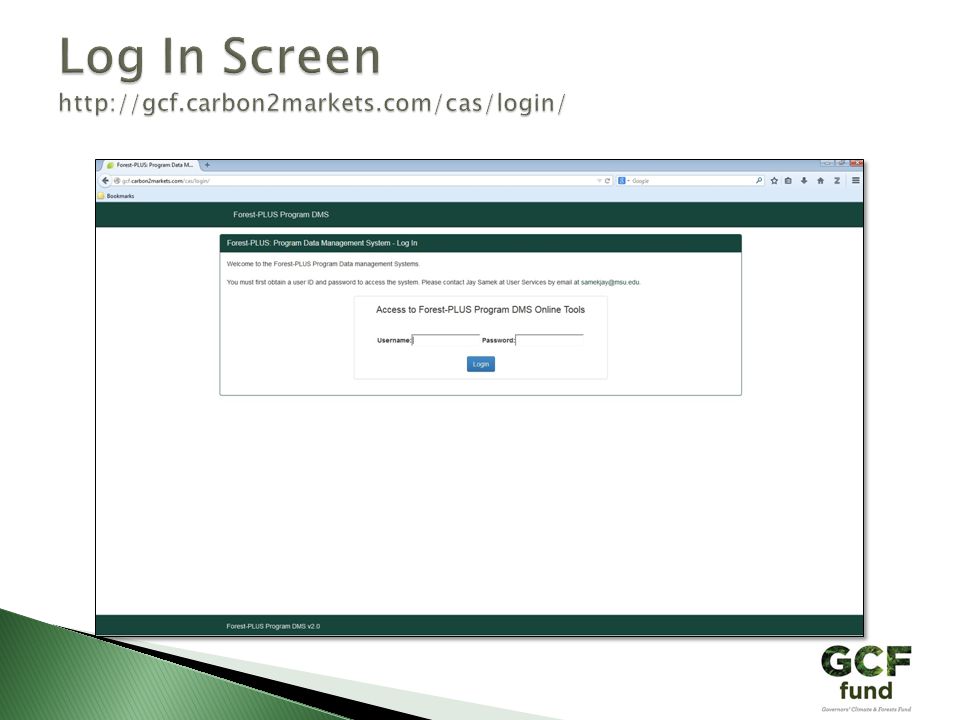
The main tools and functions of the system can be accessed via this side bar Allometric equations editor can be accessed under utilities, and user can access account info and sign out under username Different projects can be accessed here if they are available, or create new project can be accessed here as well

11
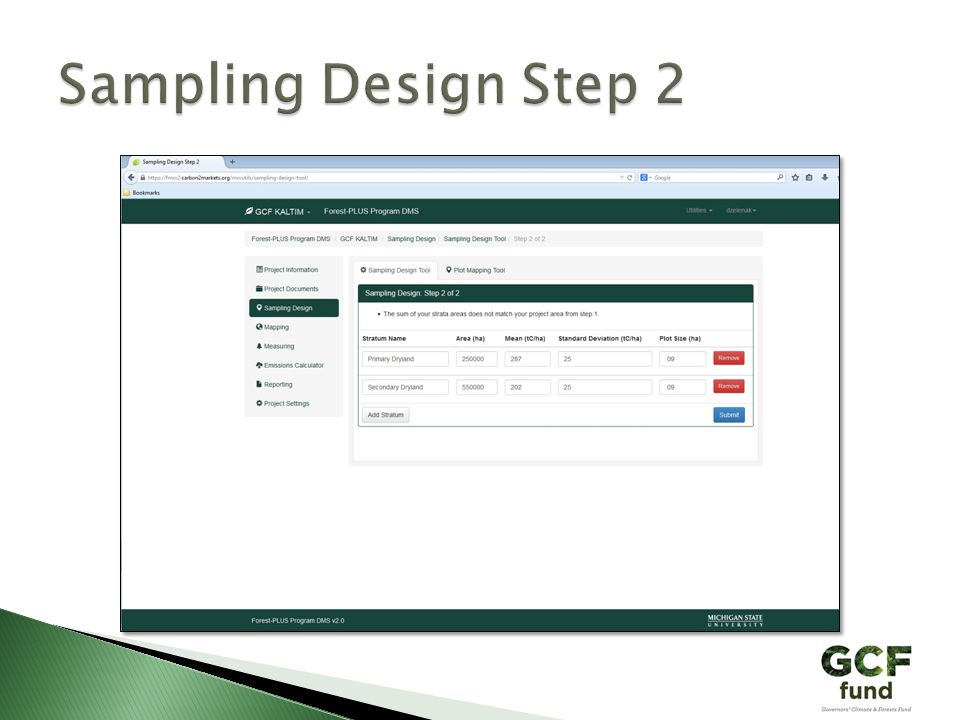
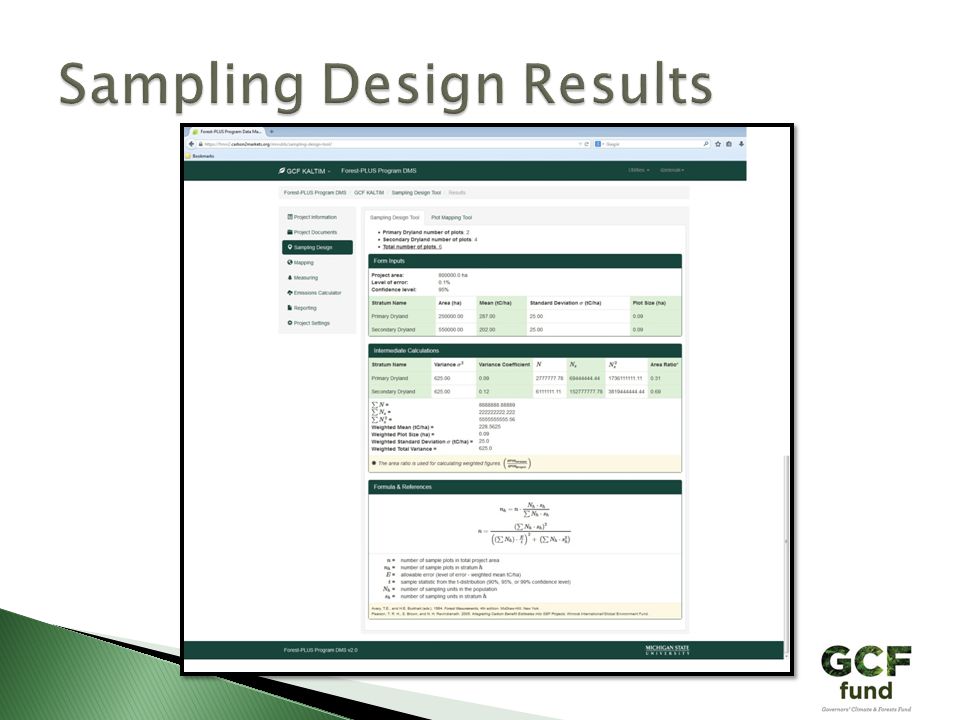
Completed in two steps First enter confidence level and level of error Second enter strata information (area, plot size, mean, standard deviation) Results are displayed showing ideal number of plots and other pertinent statistics
 Results are displayed showing ideal number of plots and other pertinent statistics")
15
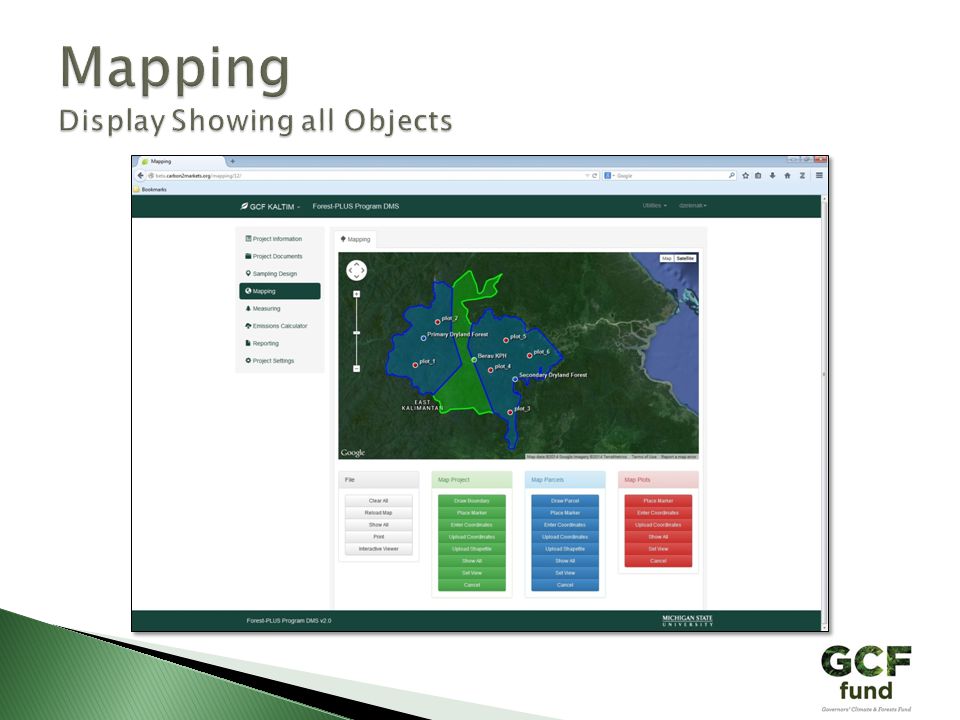
Displays parcels from the Mapping page Using the Sampling Design results, generate the desired number of plots in each parcel These plots can then be observed on the Mapping page

20
Can upload shapefiles for project boundary, parcel boundaries ◦ Must be in zipped file containing.shp.dbf and.shx files ◦ Must also include.prj file if using coordinate system other than WGS 84 Mapped area is automatically calculated, must enter Reported areas manually for project, parcels, and plot dimensions Uploaded shapefiles are automatically drawn on map Can manually draw boundaries or place plot markers as well

24
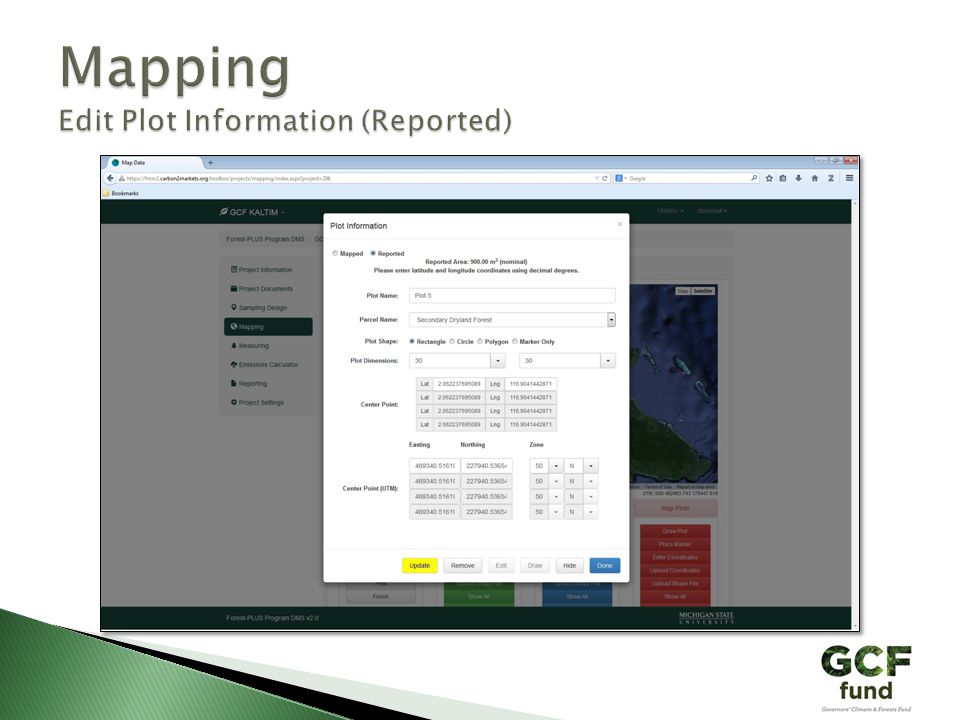
Access the edit information box by left- clicking the object’s ID point on the map Can select mapped or reported area Reported area will be used for carbon calculations and is entered on the Measuring page for the project and parcel areas Must click “Update” to save information in the database before clicking “Done” Map is saved automatically when an object is added, removed, or updated

26
Must associate the plot with one of the mapped parcels Reported measurements are required for calculating tier 3 carbon Access reported attributes by clicking “Reported” radio button Must click “Update” to save changes for that plot Map is saved automatically when a plot is added, removed, or updated

29
Select from parcels in the drop down menu, then plots associated with that parcel are available in the plot information drop down menu Plot dimensions will be displayed if they were entered as reported values on the mapping page, otherwise these can be entered here Root/shoot ratio must be entered to calculate BGB Project and Parcel reported areas are entered on this page as well Tier 1 and Tier 2 values are entered here if known

31
Select allometric equation for Project ◦ Parcels can either inherit equation from project or be assigned their own ◦ Plots can either inherit parcel equation or be assigned their own Can reassign plots to different parcels If any data from an upload sheet is associated with the plot it will be marked here (Biomass, soil, litter, deadwood) Can delete plots and/or parcels by selecting individually or all at once Click “Save” at the bottom to save any other changes made
 Can delete plots and/or parcels by selecting individually or all at once Click Save at the bottom to save any other changes made")
34
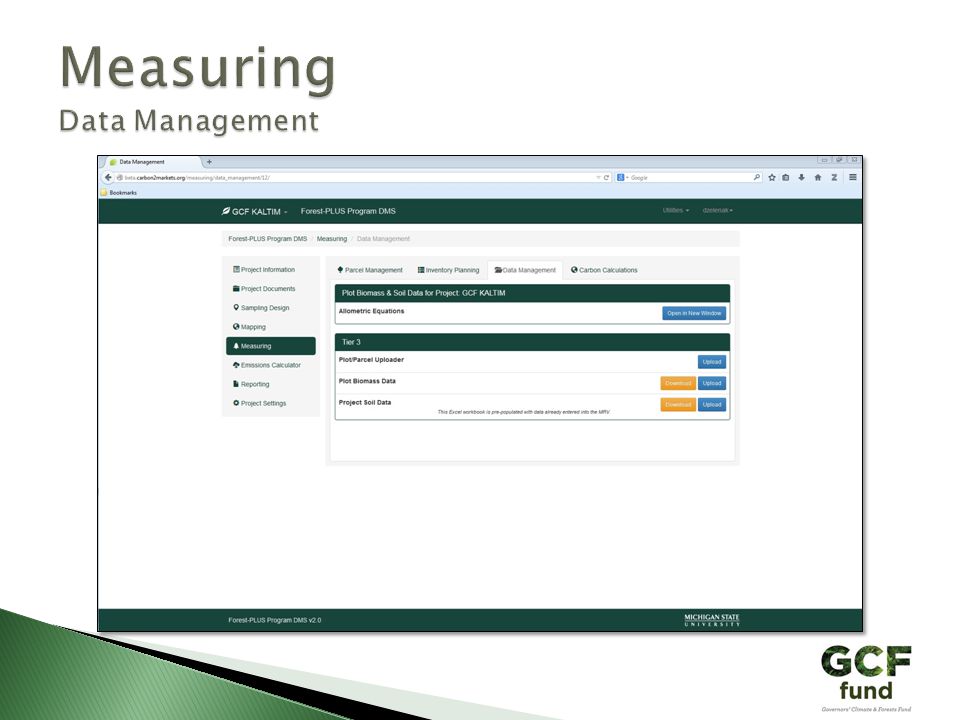
Download plot biomass data excel sheets Enter necessary information into biomass data excel sheet and upload Project name, parcel names, and plot names must match those previously mapped if they are to be associated with the mapped objects Parcels and plots that haven’t been previously mapped will be added to the database as reported values

36
Can specify optional carbon pool amounts Possible to include nested sub-plots ◦ Can specify lower/upper bound for DBH ◦ Sub-plot dimensions ◦ Table auto-updates to reflect trees in sub-plots Excel file must be saved as.xls to upload correctly

38
Can specify root/shoot ratio if haven’t already Run allometric equation at plot level (default), by region, or by species Select an allometric equation that will be run in the case of one not being listed for the region or species Browse to the file, then click save to complete the process One sheet required for each individual plot
, by region, or by species Select an allometric equation that will be run in the case of one not being listed for the region or species Browse to the file, then click save to complete the process One sheet required for each individual plot")
40
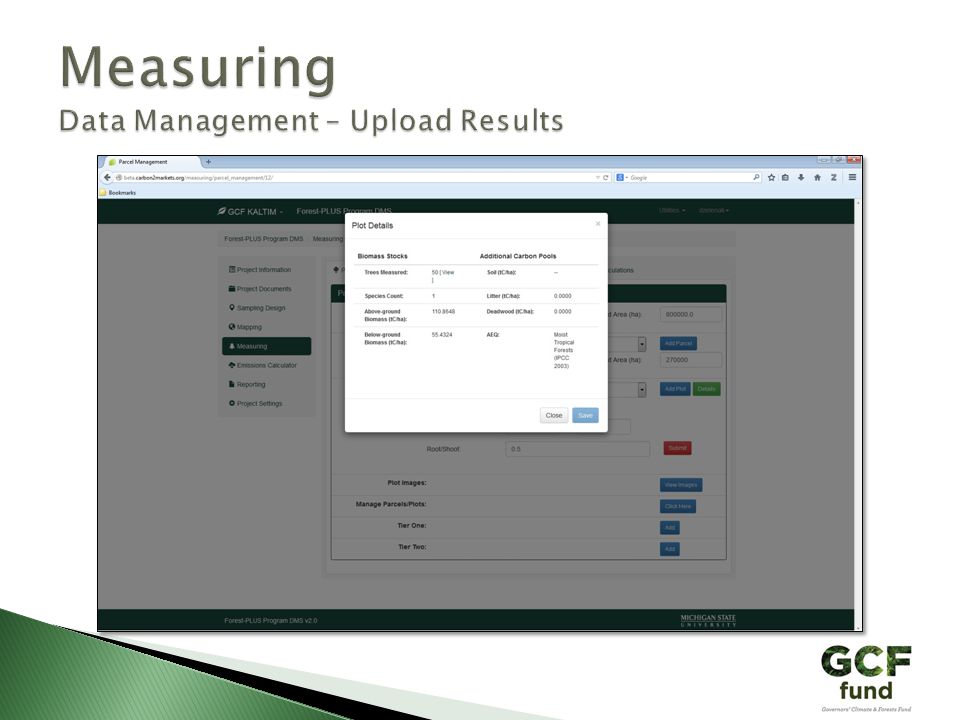
After the upload a page will open displaying the plot data along with individual tree data Going back to Parcel Management tab, can now view details for that plot (see next slide)
")
42
First select a parcel from the drop down menu Tier 1 and Tier 2 Data can be viewed if they were previously entered Tier 3 Data can be viewed as plot summaries or parcel summaries, along with a carbon summary for the project and calculation uncertainty

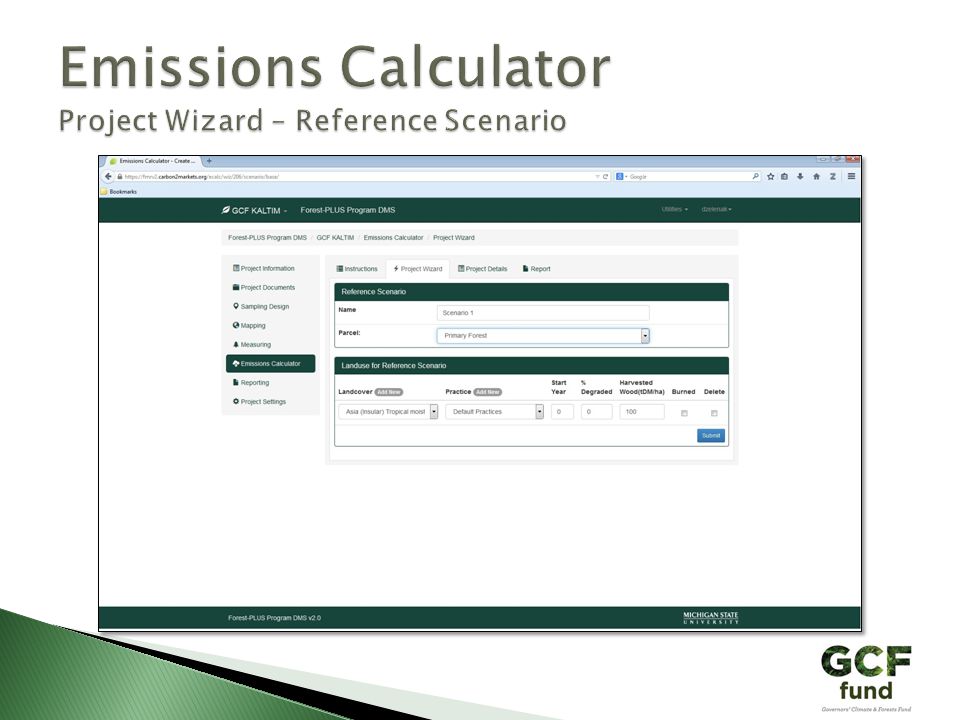
49
Allows user to follow a wizard for creating parcels and scenarios for the project (Project Wizard tab) Users can also manually enter information by going directly to Project Details tab Users can create custom landcover classes and practices
 Users can also manually enter information by going directly to Project Details tab Users can create custom landcover classes and practices")
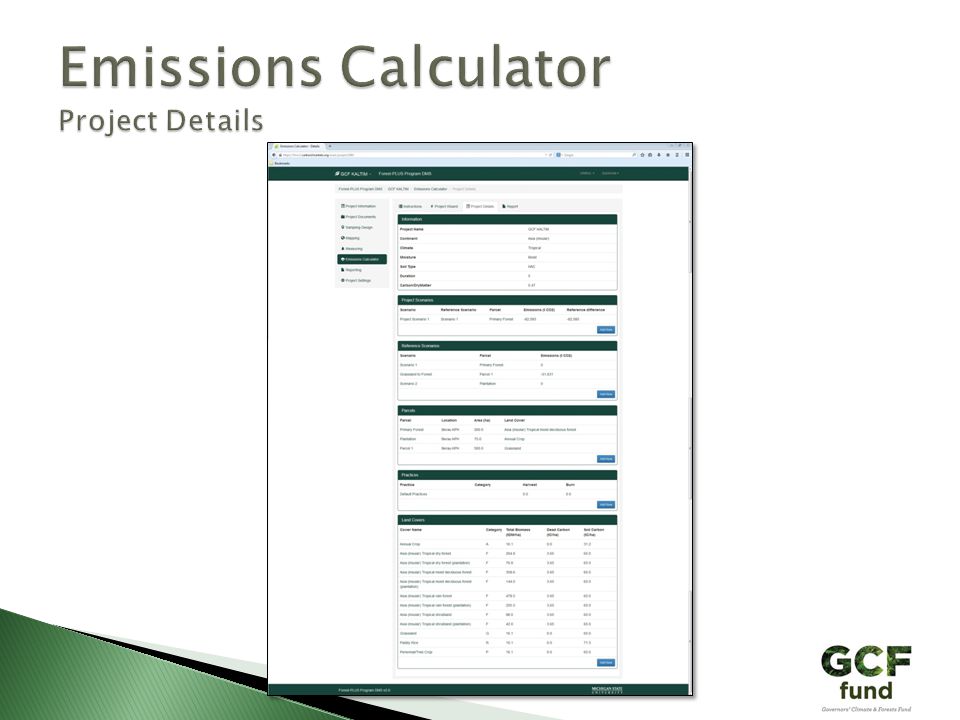
55
Display project information, project scenarios, reference scenarios, parcels, practices, and land covers Also includes user created items Clicking emissions values on the project details page gives yearly emissions separated by source for a given scenario

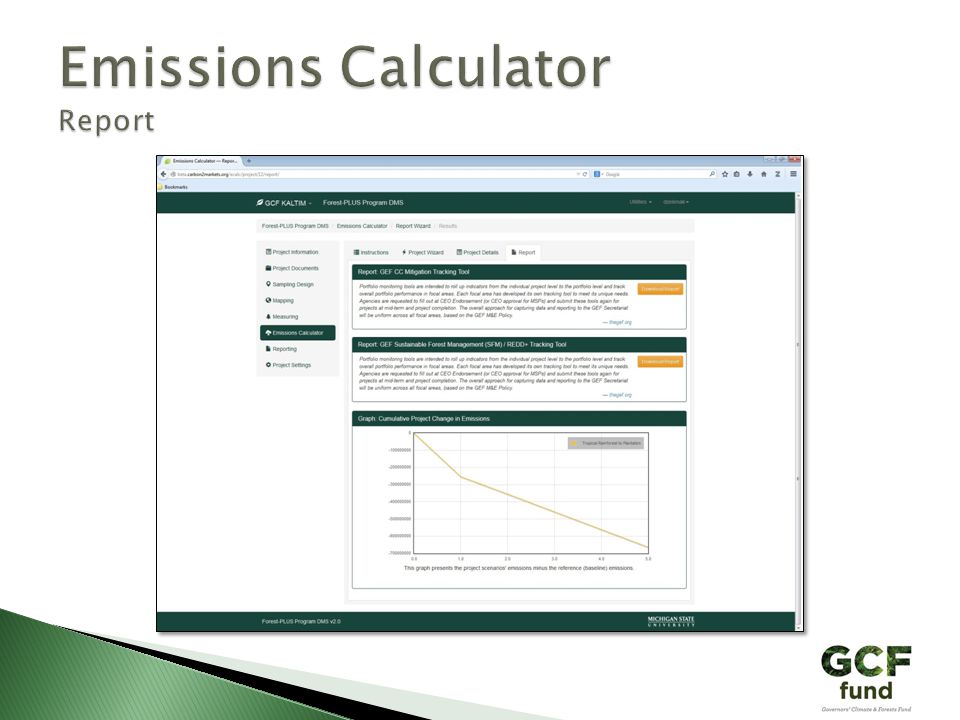
58
Select user-defined project scenarios, and a graph will display change from baseline emissions Can also download Global Environment Facility Reports for submittal at project mid-term and project completion

61
Can generate an information report giving basic project information Map report which gives spatial information for the project area, parcels, and plots Produces a visual output of any mapped data Carbon Stocks Report provides carbon stocks by plot along with parcel and project total values

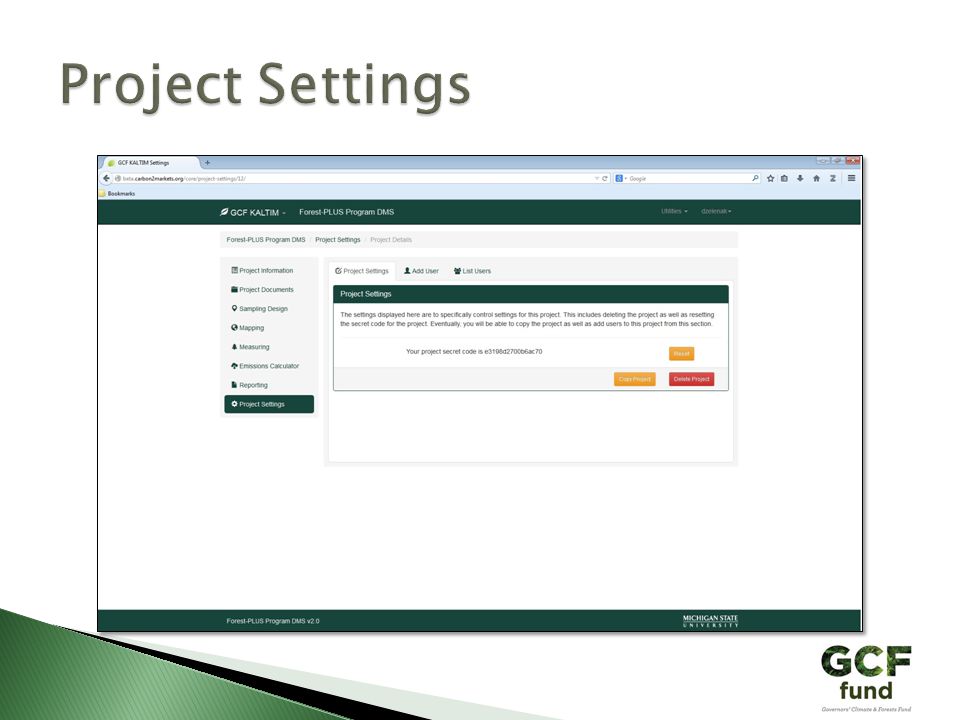
63
Ability to copy the project, and establish a code that can be used to share the project Can add users Display a list of current users on the project Delete the project

65
Here are all of the AEQs currently in the system and available to the project, listed by geography User can create custom AEQ or upload a previously created AEQ Equations can also be listed by species

Similar presentations


 change your FORM STATUS by clicking once on the white box. A dropdown menu will appear.>")


 Macro Walkthrough Guide for Excel Version 2003.>")
 Letter of Interest Submittal (LoIS)>")
 TAKING A QUIZ (SLIDE 8) REVIEWING A QUIZ (SLIDE 17) GROUP MEMBERSHIP (SLIDE 26) CREATING QUIZZES (SLIDE 31)>")

 Search Invoice Manage.>")

 course Section 5: Statement and Dispute Navigation This presentation is compliant.>")


 Tutorial 1 DCG- Revision C 7/25/2014.>")