Download presentation
Presentation is loading. Please wait.

1
From Data to Best Available Knowledge New Developments in FishBase Rainer Froese, GEOMAR, rfroese@geomar.de 12 th FishBase Symposium Big Old Data and Shiny New Insights: Using FishBase for Research Beaty Museum of Biodiversity, UBC, Vancouver, 09.09.2014

2
Overview Data in FishBase as of August 2014 From Data to Insights Example of Qualifying, Summarizing and Spreading Existing Knowledge The Most Important Number Ongoing Research Towards that Number Discussion

4
Data in FishBase

6
Available Data

7
Available Data for Growth

8
Data in FishBase

9
From Data to Insights FishBase has compiled thousands of studies on growth, maturity, reproduction, diet, etc How can the information be summarized? How good is a single study? How can new studies be informed? How can best estimates for species without studies be derived?

10
From Data to Insights Assemble all relevant facts, with probability distributions Establish their correlations, with probability distributions Select suitable models to explain data and predict key parameters Let the computer test all possible combinations and select those with highest overall probability

12
Bayesian Inference in a Nutshell Prior: express existing knowledge (textbook, common sense, logic, best guess, previous studies) with a central value (such as a mean) and a distribution around it (such as a normal distribution and a standard deviation). Likelihood function: analyze new data, get the mean and distribution Posterior: Combine prior and likelihood into a new, intermediate mean and distribution

13
Accumulation of LWR and species with LWR 3,600 species have LWR; 28,400 do not 284 families do not have a single LWR Search for refs showed this as a knowledge gap

14
Length Weight Relationships

15
LWR Across All Studies Weighted distribution of parameters b and log10(a) in 5150 studies for 1821 species. ___ from mean and standard deviation of the data ___ from overall priors derived from the literature ___ predictive posterior distribution

16
Body shape priors - Eel-like (1,700 species) - Elongated (7,300 species) - Fusiform (7,100 species) - Short and /or deep (2,600 species) - Other (700 species; e.g., seahorses)
 - Elongated (7,300 species) - Fusiform (7,100 species) - Short and /or deep (2,600 species) - Other (700 species; e.g., seahorses)")
17
LWR Priors Weighted means and standard deviations of parameters a and b from 5150 studies for 1821 species of fishes, by body shape. Geom. mean = geometric mean and 95% range includes about 95% of observations.

18
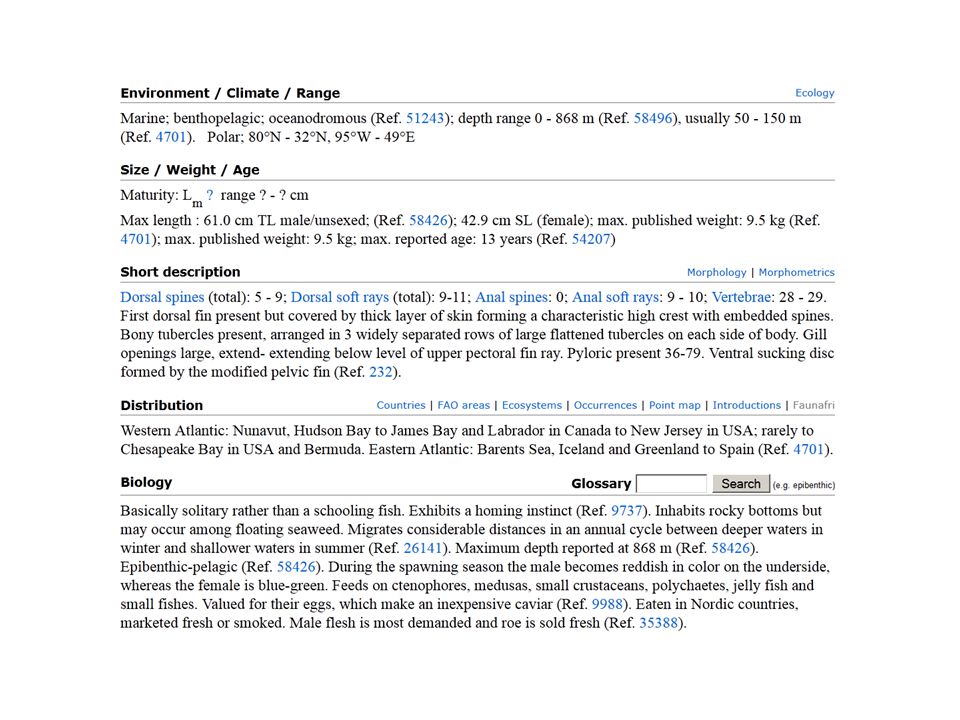
LWR for all species Example: Cyclopterus lumpus

19
Self-Learning Database When Daniel and Rainer first discussed about FishBase, they envisioned an artificial intelligence system Some years (decades) later, we are getting there: the addition of LWRs for 16 species improved LWR quality for over 400 species
 later, we are getting there: the addition of LWRs for 16 species improved LWR quality for over 400 species")
20
The Most Important Number r max maximum intrinsic rate of population increase Determines: - productivity (F msy ) - population recovery time - resilience - vulnerability
 - population recovery time - resilience - vulnerability")
21
The Most Important Number Estimating viable r-k pairs from catch and resilience

22
The Most Important Number r max is highly correlated with age at maturity / generation time body size natural mortality somatic growth rate metabolism/temperature life style / activity

23
Ongoing Research Growth parameter K plotted over asymptotic length, based on 7,275 growth studies for 1,863 species, with the bold line representing the mean for demersal subtropical species and with dashed lines indicating the 95% high density interval. Note that these lines would shift upward for tropical species and downward for temperate and cold species, with the same slope.

24
Ongoing Research Box plots of growth parameter K for different environmental temperatures, based on 7,275 growth studies for 1,863 species. The width of the boxes is proportional to the square root of the number of observations.

25
Ongoing Research Box plots of growth parameter K for different habitat uses, based on 7,275 growth studies for 1,863 species. The width of the boxes is proportional to the square root of the number of observations.

26
Ongoing Research for all Species Growth: K, Linf, Winf Length-Weight: a, b √ Phylogeny: Genus, Subfamily, Family √ Natural mortality: MMaturity: Lm, tm Production: r, k Climate / Habitat: √ Longevity: t max Resilience / Productivity: r max

27
Resilience for all species, to be replaced by rmax with confidence limits

28
Thank You Questions?

Similar presentations


>")


