Download presentation
Presentation is loading. Please wait.

1
Gene Linkage and Genetic Mapping
4 Gene Linkage and Genetic Mapping

2
If two genes are on different chromosomes…

3
If two genes are on different chromosomes…
Half look like they got a set of the parents chromosomes… And half look like they got a mix of both parents chromosomes…

4
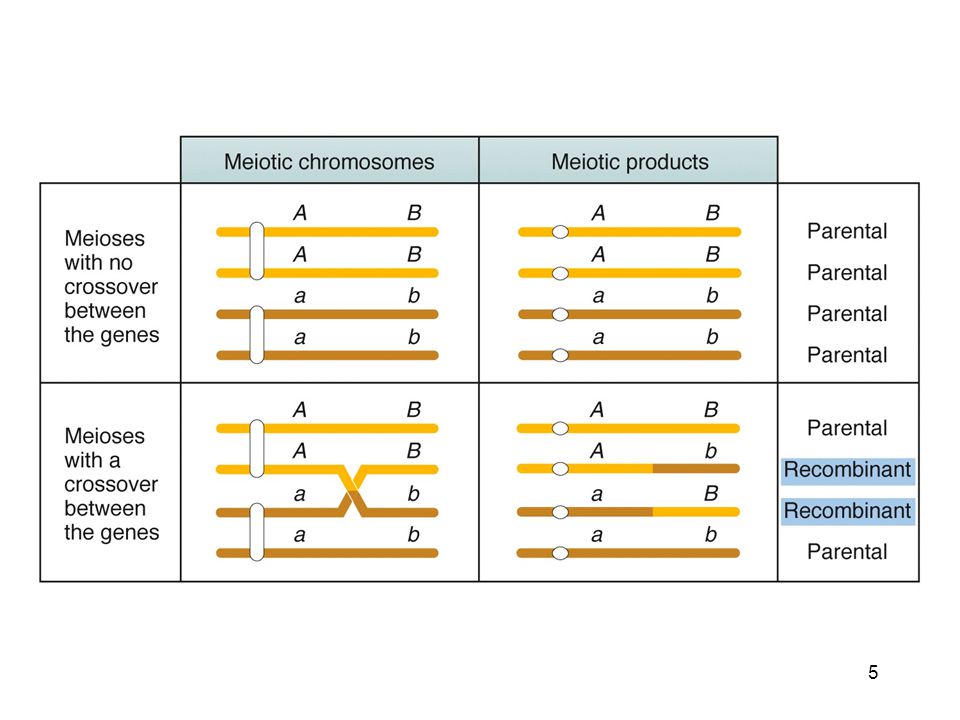
Now suppose both gene A and B were next to each other on the same chromosome.
What happens to the ratios in this diagram?

7
Gene Mapping Gene mapping determines the order of genes and the relative distances between them in map units 1 map unit = 1 cM (centimorgan) Gene mapping methods use recombination frequencies between alleles in order to determine the relative distances between them Recombination frequencies between genes are inversely proportional to their distance apart Distance measurement: 1 map unit = 1 percent recombination (true for short distances)
 Gene mapping methods use recombination. frequencies between alleles in order to determine the relative distances between them. Recombination frequencies between genes are inversely proportional to their distance apart. Distance measurement: 1 map unit = 1 percent recombination (true for short distances)")
8
Fig. 4.6

9
Gene Mapping Genes with recombination frequencies less than 50 percent are on the same chromosome = linked) Linkage group = all known genes on a chromosome Two genes that undergo independent assortment have recombination frequency of 50 percent and are located on nonhomologous chromosomes or far apart on the same chromosome = unlinked

10
Mapping the distance between two genes
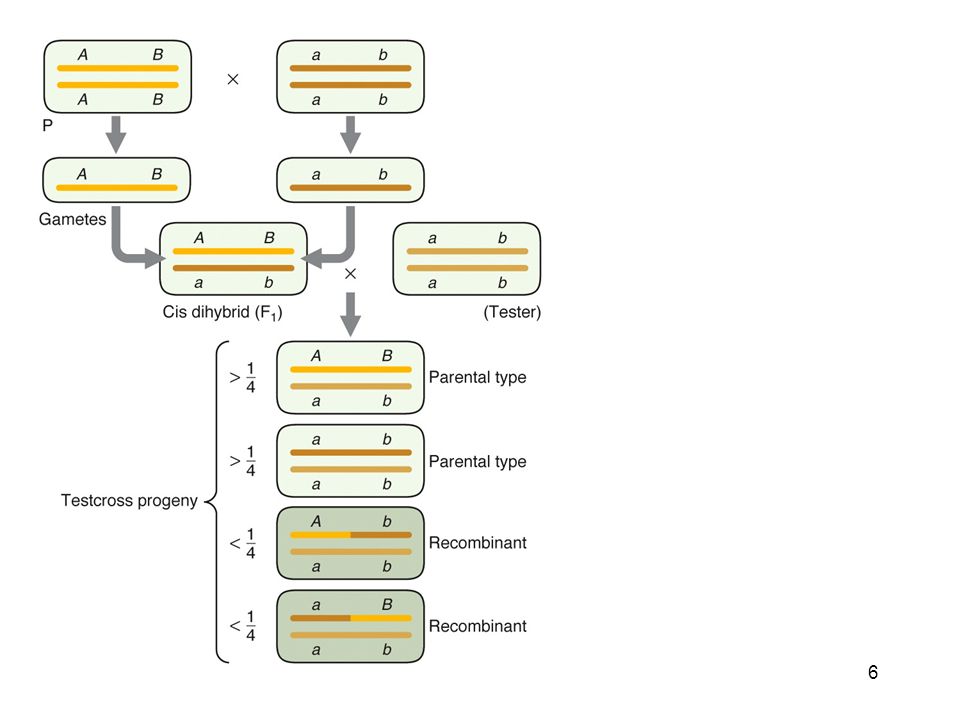
Starting with pure breeding lines, Cross Parent 1(AA BB) with Parent 2(aa bb) So Parental chromosomes in the F1 have to be AB and ab Now cross (AB ab) F1 progeny with (ab ab) tester to look for recombination on these chromosomes. Suppose you Get…… AB ab 583 <parental ab ab 597 <parental Ab ab 134 <recombinant aB ab 134 <recombinant total= 1448 so…. 268 recombinants /1448 progeny = 0.185 recombinants/progeny= 18.5% recombinants= 18.5 mu
 with Parent 2(aa bb) So Parental chromosomes in the F1 have to be AB and ab. Now cross (AB ab) F1 progeny with (ab ab) tester to look for recombination on these chromosomes. Suppose you Get…… AB ab 583 <parental. ab ab 597 <parental. Ab ab 134 <recombinant. aB ab 134 <recombinant total= so…. 268 recombinants /1448 progeny = recombinants/progeny= 18.5% recombinants= 18.5 mu.")
11
Mapping (and ordering) three genes
Starting with pure breeding lines, Cross Parent 1(AA BB DD) with Parent 2(aa bb dd) So you know the Parental chromosomes in the F1 have to be ABD and abc Cross (ABD abd) F1 progeny with (abd abd) tester Suppose you Get…… ABD abd 580 <parental ABd abd 3 abD abd 5 <parental abd abd 592 AbD abd 45 <recombinant Abd abd 89 aBD abd 94 aBd abd 40 <recombinant total= 1448 Ab + aB = (45+89)+(94+40) recom 268 recom/1448 total =0.185 A-B =18.5mu Bd + bD = (3+40)+(5+45) 93 recom/1448 total= 0.064 B-D =6.4mu Ad + aD = (3+89)+(5+94) 191 recom/1448 total= 0.132 A-D =13.2mu so the order must be A-----D---B
 with Parent 2(aa bb dd) So you know the Parental chromosomes in the F1 have to be ABD and abc. Cross (ABD abd) F1 progeny with (abd abd) tester. Suppose you Get…… ABD abd 580 <parental. ABd abd 3. abD abd 5 <parental. abd abd 592. AbD abd 45 <recombinant. Abd abd 89. aBD abd 94. aBd abd 40 <recombinant total= Ab + aB = (45+89)+(94+40) recom. 268 recom/1448 total = A-B =18.5mu. Bd + bD = (3+40)+(5+45) 93 recom/1448 total= B-D =6.4mu. Ad + aD = (3+89)+(5+94) 191 recom/1448 total= A-D =13.2mu. so the order must be A-----D---B")
12
So How come 13.2 + 6.4 does not equal 18.5?
We missed the double recombinants on the first pass… longer the distance, more potential to underestimate recomb freq. (45+89)+(94+40)+2(3+5) recom 284recom/1448 total = 0.196 A-B =19.6mu Cross (ABD abd) F1 progeny with (abd abd) tester Suppose you Get…… ABD abd 580 <parental ABd abd 3 abD abd 5 <parental abd abd 592 AbD abd 45 <recombinant Abd abd 89 aBD abd 94 aBd abd 40 <recombinant total= 1448 Ab + aB = (45+89)+(94+40) recom 268 recom/1448 total =0.185 A-B =18.5mu A-----D---B
+(94+40)+2(3+5) recom. 284recom/1448 total = A-B =19.6mu. Cross (ABD abd) F1 progeny with (abd abd) tester. Suppose you Get…… ABD abd 580 <parental. ABd abd 3. abD abd 5 <parental. abd abd 592. AbD abd 45 <recombinant. Abd abd 89. aBD abd 94. aBd abd 40 <recombinant total= Ab + aB = (45+89)+(94+40) recom. 268 recom/1448 total = A-B =18.5mu. A-----D---B")
13
Interference = 1-Coefficient of coincidence
Chromosome interference: crossovers in one region decrease the probability of a second crossover close by Coefficient of coincidence = observed number of double recombinants divided by the expected number \ Interference = 1-Coefficient of coincidence If the two crossovers were independent, we would expect that the probability of seeing two recombination events occur would be between A-D AND between D-B 0.132 X = 0.008 For every 1448 progeny, this would be (1448x0.008)=12.23 double recombinants We actually observed only (5+3)= 8 double recombinants So the Coefficient of coincidence = observed / expected = 8/12.23 =0.65 Interference = 1-Coefficient of coincidence = = 0.35
=12.23 double recombinants. We actually observed only (5+3)= 8 double recombinants. So the Coefficient of coincidence = observed / expected = 8/12.23 =0.65. Interference = 1-Coefficient of coincidence. = =")
14
Mapping Genes in Human Pedigrees
Methods of recombinant DNA technology are used to map human chromosomes and locate genes Genes can then be cloned to determine structure and function Human pedigrees and DNA mapping are used to identify dominant and recessive disease genes Polymorphic DNA sequences are used in human genetic mapping.

15
Genetic Polymorphisms
The presence in a population of two or more relatively common forms of a gene or a chromosome is called polymorphism Changes in DNA fragment length produced by presence or absence of the cleavage sites in DNA molecules are known as restriction fragment length polymorphism (RFLP) A prevalent type of polymorphism is a single base pair difference, simple-nucleotide polymorphism (SNP) A genetic polymorphism resulting from a tandemly repeated short DNA sequence is called a simple sequence repeat (SSR)
 A prevalent type of polymorphism is a single base pair difference, simple-nucleotide polymorphism (SNP) A genetic polymorphism resulting from a tandemly repeated short DNA sequence is called a simple sequence repeat (SSR)")
16
RFLPs Restriction endonucleases are used to map genes as they produce a unique set of fragments for a gene There are more than 200 restriction endonucleases in use, and each recognizes a specific sequence of DNA bases EcoR1 cuts double-stranded DNA at the sequence 5’-GAATTC-3’ wherever it occurs

17
Fig. 4.18

18
RFLPs Differences in DNA sequence generate different recognition sequences and DNA cleavage sites for specific restriction enzymes Two different genes will produce different fragment patterns when cut with the same restriction enzyme due to differences in DNA sequence Fig. 4.19

19
SNPs Single-nucleotide polymorphisms (SNPs) are abundant in the human genome Rare mutants of virtually every nucleotide can probably be found, but rare variants are not generally useful for family studies of heritable variation in susceptibility to disease For this reason, in order for a difference in nucleotide sequence to be considered as an SNP, the less-frequent base must have a frequency of greater than about 5% in the human population. By this definition, the density of SNPs in the human genome averages about one per 1300 bp

20
SSRs A third type of DNA polymorphism results from differences in the number of copies of a short DNA sequence that may be repeated many times in tandem at a particular site in a chromosome When a DNA molecule is cleaved with a restriction endonuclease that cleaves at sites flanking the tandem repeat, the size of the DNA fragment produced is determined by the number of repeats present in the molecule There is an average of one SSR per 2 kb of human DNA

21
Mapping Genes in Human Pedigrees
One source of the utility of SNPs and SSRs in human genetic mapping is their high density across the genome Additional source of utility of SSRs in genetic mapping is the large number of alleles that can be present in any human population.

22
Mapping Genes in Human Pedigrees
Human pedigrees can be analyzed for the inheritance pattern of different alleles of a gene based on differences in SSRs and SNPs Restriction enzyme cleavage of polymorphic alleles that are different in RFLP pattern produces different size fragments by gel electrophoresis

23
A rare recessive disease that affects people late in life
is 90% linked to the RFLP marker on the gel below. What’s the probability that II1 is a carrier of the disease? dd DD Dd 100% What’s the probability that the grandchildren (row III) are carriers? 90% 10% 90%10% 10% 90% 90%
 are carriers 90% 10% 90%10% 10% 90% 90%")
24
A rare recessive disease that affects people late in life
is 90% linked to the RFLP marker on the gel below. What’s the probability that II1 is a carrier of the disease? dd DD Dd 100% What’s the probability that the grandchildren (row III) are carriers? 10% 90% 10% 90% 90% 10% 10%
 are carriers 10% 90% 10% 90% 90% 10% 10%")
25
Tetrad Analysis In some species of fungi, each meiotic tetrad is contained in a sac-like structure, called an ascus Each product of meiosis is an ascospore, and all of the ascospores formed from one meiotic cell remain together in the ascus Several features of ascus-producing organisms are especially useful for genetic analysis: They are haploid, so the genotype is expressed directly in the phenotype They produce very large numbers of progeny Their life cycles tend to be short

26
Tetrad Analysis In tetrads when two pairs of alleles are segregating, three patterns of segregation are possible parental ditype (PD) = two parental genotypes nonparental ditype (NPD) = only recombinant combinations tetratype (TT) = all four genotypes observed
 = two parental genotypes. nonparental ditype (NPD) = only recombinant combinations. tetratype (TT) = all four genotypes observed.")
27
Tetrad Analysis When genes are unlinked, the parental ditype tetrads and the nonparental ditype tetrads are expected in equal frequencies: PD = NPD Linkage is indicated when nonparental ditype tetrads appear with a much lower frequency than parental ditype tetrads: PD » NPD Map distance between two genes that are sufficiently close that double and higher levels of crossing-over can be neglected, equals 1/2 x (Number TT / Total number of tetrads) x 100
 x 100.")
28
Neurospora: Ordered Tetrads
Ordered asci also can be classified as PD, NPD, or TT with respect to two pairs of alleles, which makes it possible to assess the degree of linkage between the genes The fact that the arrangement of meiotic products is ordered also makes it possible to determine the recombination frequency between any particular gene and its centromere

29
Tetrad Analysis: Ordered Tetrads
Homologous centromeres of parental chromosomes separate at the first meiotic division The centromeres of sister chromatids separate at the second meiotic division When there is no crossover between the gene and centromere, the alleles segregate in meiosis I A crossover between the gene and the centromere delays segregation alleles until meiosis II

30
The map distance between the gene and its centromere equals
1/2 x (Number of asci with second division segregation/ Total number of asci) x 100 This formula is valid when the gene is close enough to the centromere and there are no multiple crossovers
 x 100. This formula is valid when the gene is close enough to the centromere and there are no multiple crossovers.")
31
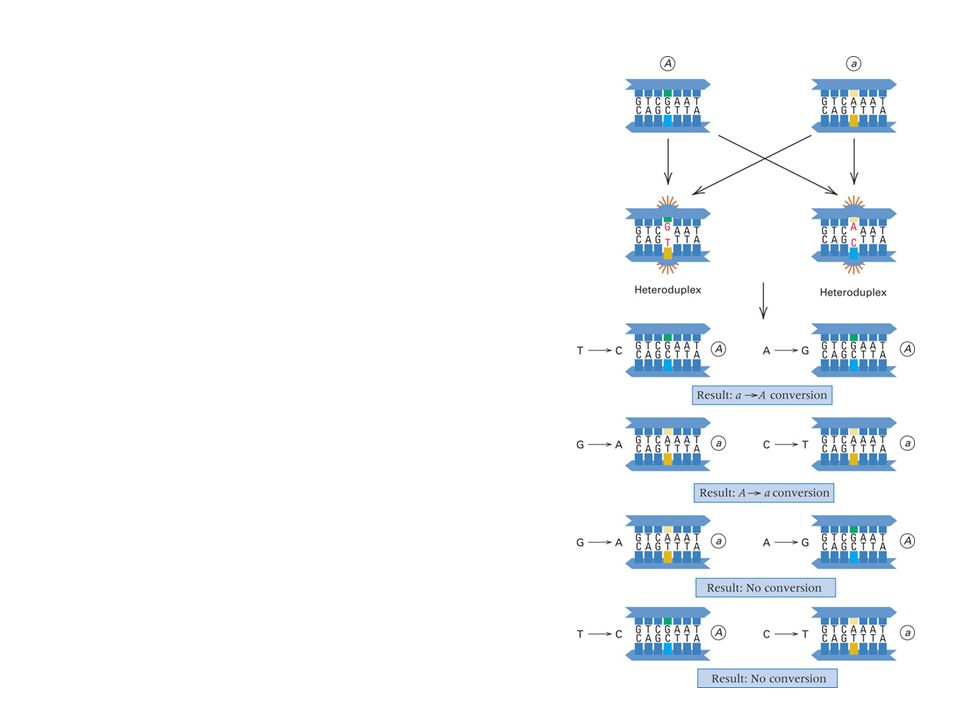
Gene Conversion Most asci from heterozygous Aa diploids demonstrate normal Mendelian segregation and contain ratios of 2A : 2a in four-spored asci, or 4A : 4a in eight-spored asci Occasionally, aberrant ratios are also found, such as 3A : 1a or 1A : 3a and 5A : 3a or 3A : 5a. The aberrant asci are said to result from gene conversion because it appears as if one allele has “converted” the other allele into a form like itself Gene conversion is frequently accompanied by recombination between genetic markers on either side of the conversion event, even when the flanking markers are tightly linked Gene conversion results from a normal DNA repair process in the cell known as mismatch repair Gene conversion suggests a molecular mechanism of recombination

32
One of two ways to resolve the resulting structure, known as a Holliday junction, leads to recombination, the other does not The breakage and rejoining is an enzymatic function carried out by an enzyme called the Holliday junction-resolving enzyme

34
Human Chromosomes and Chromosome Behavior
5 Human Chromosomes and Chromosome Behavior

35
Karyotype = stained and photographed preparation of metaphase chromosomes arranged according to their size and position of centromeres

36
Human Chromosomes Each chromosome in karyotype is divided into two regions (arms) separated by the centromere p = short arm (petit); q = long arm p and q arms are divided into numbered bands and interband regions based on pattern of staining Within each arm the regions are numbered.
; q = long arm. p and q arms are divided into numbered bands and interband regions based on pattern of staining. Within each arm the regions are numbered.")
37
Centromeres • Chromosomes are classified according to the relative position of their centromeres In metacentric it is located in middle of chromosome In submetacentric—closer to one end of chromosome In acrocentric—near one end of chromosome Chromosomes with no centromere, or with two centromeres, are genetically unstable

38
Abnormal Chromosome Numbers
Aneuploid = unbalanced set of chromosomes = relative gene dosage is upset (example: trisomy of chromosome 21) Monosomic = loss of a single chromosome copy Polysomic = extra copies of single chromosomes Most chromosome abnormalities lethal, frequently in spontaneous abortions. Exceptions are trisomy 13, trisomy 18, and trisomy 21 (Down syndrome), and the Sex chromosomes
 Monosomic = loss of a single chromosome copy. Polysomic = extra copies of single chromosomes. Most chromosome abnormalities lethal, frequently in spontaneous abortions. Exceptions are trisomy 13, trisomy 18, and trisomy 21 (Down syndrome), and the Sex chromosomes.")
39
An extra X or Y chromosome usually has a relatively mild effect.
Why? 1) X chromosme inactivation/Dosage Compensation 2) Not much (essential) on the Y EXAMPLES: Trisomy-X = 47, XXX (female) Double-Y = 47, XYY (male) Klinefelter Syndrome = 47, XXY (male, sterile) Turner Syndrome = 45, X (female, sterile)
 X chromosme inactivation/Dosage Compensation. 2) Not much (essential) on the Y. EXAMPLES: Trisomy-X = 47, XXX (female) Double-Y = 47, XYY (male) Klinefelter Syndrome = 47, XXY (male, sterile) Turner Syndrome = 45, X (female, sterile)")
40
Chromosome Abnormalities
Deletions/Duplications Inversions Translocations

41
Deletions Duplications

42
Chromosome Inversions
Inversions = genetic rearrangements in which the order of genes in a chromosome segment is reversed Inversions do not alter the genetic content but change the linear sequence of genetic information In an inversion heterozygote, chromosomes twist into a loop in the region in which the gene order is inverted Chromosome Inversions A B C C B A B A C

43
Paracentric inversion
Does not include centromere Crossing-over produces one acentric (no centromere) and one dicentric (two centromeres) chromosome Pericentric inversion Includes centromere Crossing-over results in duplications and deletions of genetic information
 and one dicentric (two centromeres) chromosome. Pericentric inversion. Includes centromere. Crossing-over results in duplications and deletions of genetic information.")
44
Reciprocal Translocations
Adjacent-2 segregation: homologous centromeres stay together at anaphase I; gametes have a segment duplication and deletion Alternate segregation: half the gametes receive both parts of the reciprocal translocation and the other half receive both normal chromosomes; all gametes are euploid, i.e have normal genetic content, but half are translocation carriers

45
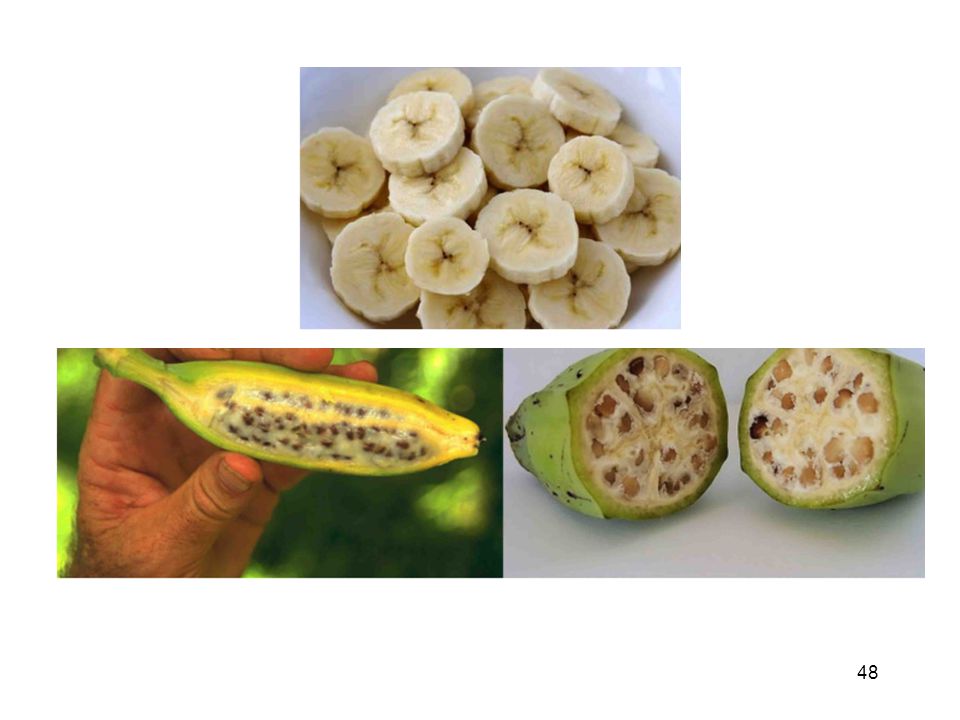
Polyploidy Polyploid species have multiple complete sets of chromosomes The basic chromosome set, from which all the other genomes are formed, is called the monoploid set The haploid chromosome set is the set of chromosomes present in a gamete, irrespective of the chromosome number in the species. Polyploids can arise from genome duplications occurring before or after fertilization Through the formation of unreduced gametes that have double the normal complement of chromosomes or Through abortive mitotic division, called endoreduplication.

46
Polyploids can generate new species

47
A seedless watermelon is a sterile hybrid which is created by crossing male pollen for a watermelon, containing 22 chromosomes per cell, with a female watermelon flower with 44 chromosomes per cell.

49
The karyotype of the Chinook salmon has been characterized as 2N = 68, with 16 pairs of metacentric chromosomes and 18 pairs of acrocentric chromosomes (Simon 1963)
")
Similar presentations


 — ————— Two homologous chromosomes,>")
 Chromosome Structure & Recombination Nov 1 & 6, 2007 BIO 184 Dr. Tom Peavy.>")


