Download presentation
Presentation is loading. Please wait.

1
Jeff Dobur, NWS Peachtree City, GA Michael Moneypenny, NWS Raleigh, NC Rainfall and River Forecasts The Processes and Products

4
SAC-SMA Model Rain to Runoff SAC-SMA Model Rain to Runoff Basin Watershed Rating Curve Stages to Flows Rating Curve Stages to Flows Unit Hydrograph Runoff to Flow Unit Hydrograph Runoff to Flow River Gage

5
River Forecast Points

6
The U.S. Geological Survey Performs Flow Measurements at Each Forecast Point

7
To Produce Rating Curves Volume of Flow is Converted to Stage

8
River Forecast Points The NWS Surveys Each Site Each Site to Determine Impacts

20
NWS Inundation Mapping

21
NC Flood Inundation Mapping Network http://fiman.nc.gov Available for sites other than NWS Forecast Points Need to request a Login & Password

22
FIMAN

24
Observed Rainfall

26
Forecast Rainfall

27
Factors Impacting Rainfall Distribution in Landfalling and Evolving Tropical Cyclones Storm track and location Time of day – core rainfall overnight/ outer band rainfall during day Storm size – the bigger the storm, the more it rains at any given spot Storm motion – slower moving storms typically produce more rain at any given spot Nearby synoptic-scale features (i.e. fronts) Heaviest rainfall usually occurs along and 75 miles either side of the storm track Different with every system Tropical Storm Alberto
 Heaviest rainfall usually occurs along and 75 miles either side of the storm track Different with every system Tropical Storm Alberto.")
28
It’s all about interactions! Forecasting Schematic for Heavy Events

29
Hanna interacted with a cold front and upper level disturbance shifting the rainfall swath left of track. 72 83 Tropical Storm Hanna

30
Hurricane Fran – Along Track Heavy Rainfall

31
Ernesto Example

37
Crest to Crest Relationships

39
What is MMEFS?

40
How does MMEFS work?

41
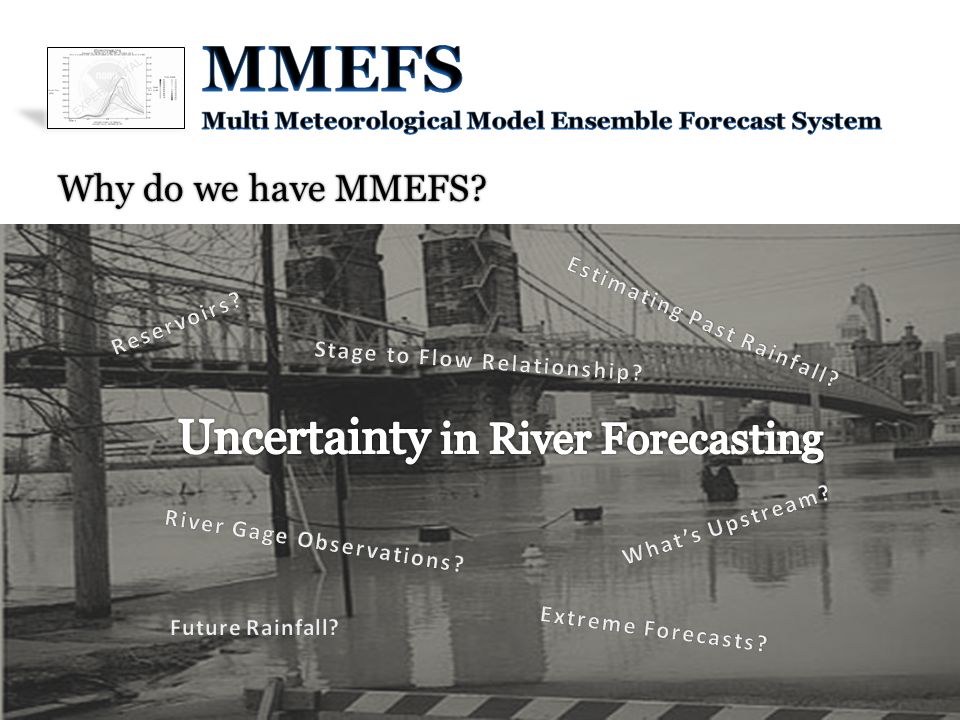
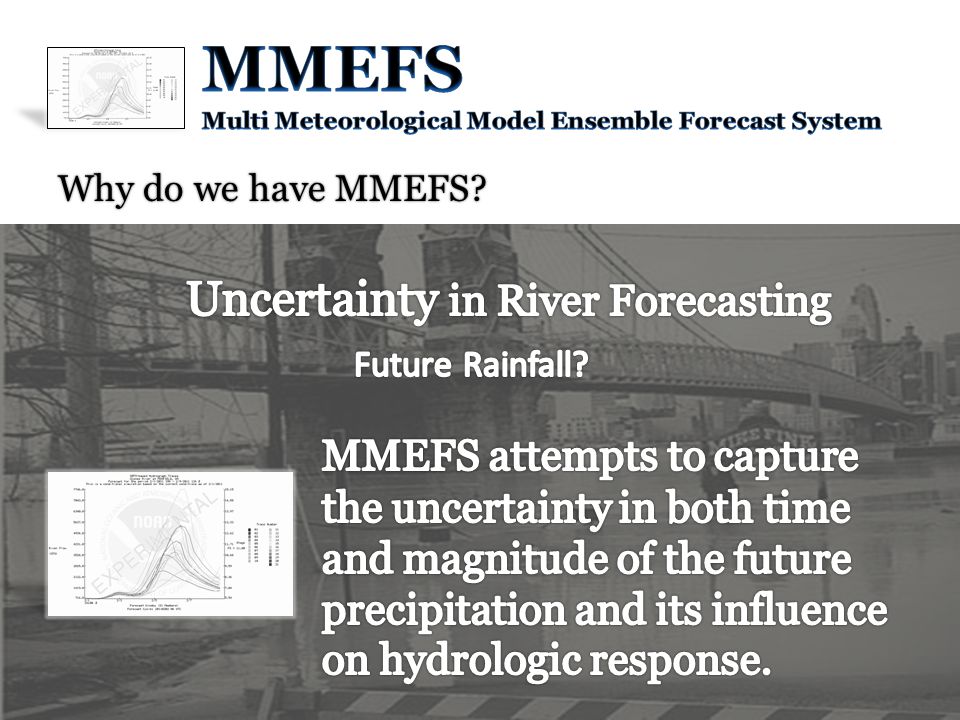
Why do we have MMEFS ? Uncertainty -our inability to know for sure - risk

42
Why do we have MMEFS?

45
http://www.srh.noaa.gov/serfc/?n=mmefsfaq

Similar presentations


 in the Devastating Floods Associated with Tropical Cyclone Agnes Michael L. Jurewicz, Sr. NOAA / NWS, Binghamton,>")


 in Forecasting and Validation in Southeastern New York State.>")


