Download presentation
Presentation is loading. Please wait.

1
2015 Minnesota Economic Outlook January 6, 2015

2
minneapolisfed.org

3
Agenda Minnesota Economy Outlook Surveys Models Sector Analysis Agriculture Manufacturing Home building

4
9 th District Cleveland

5
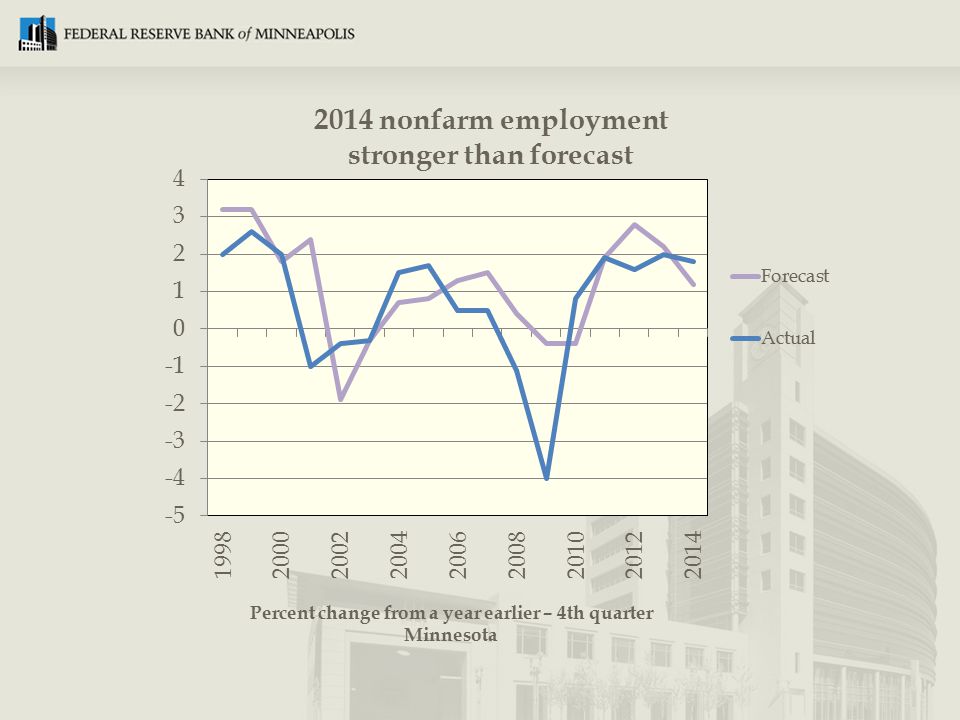
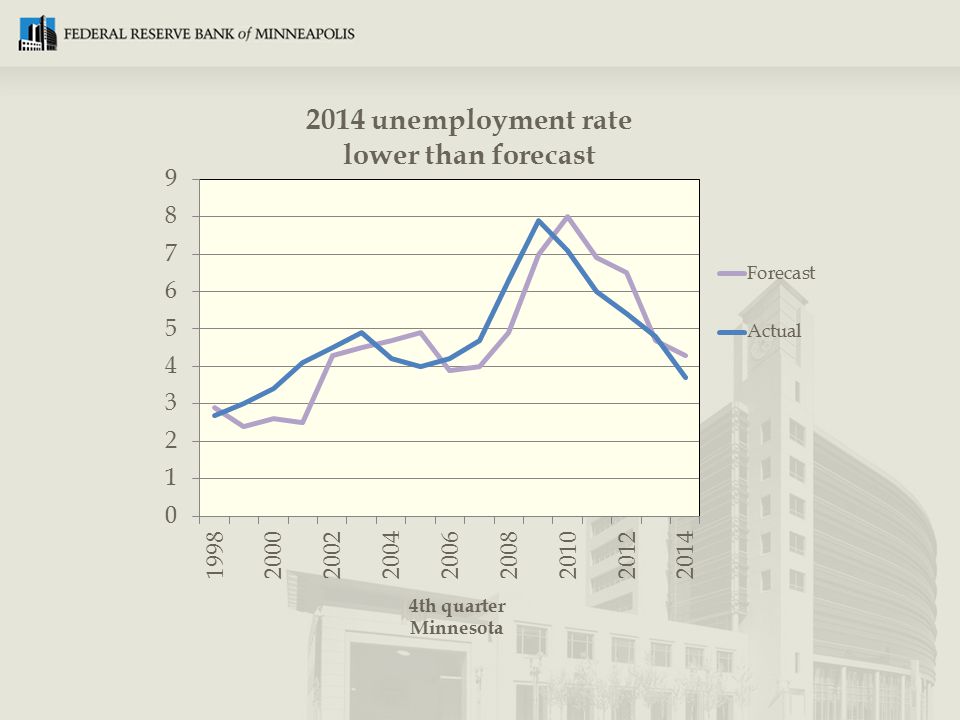
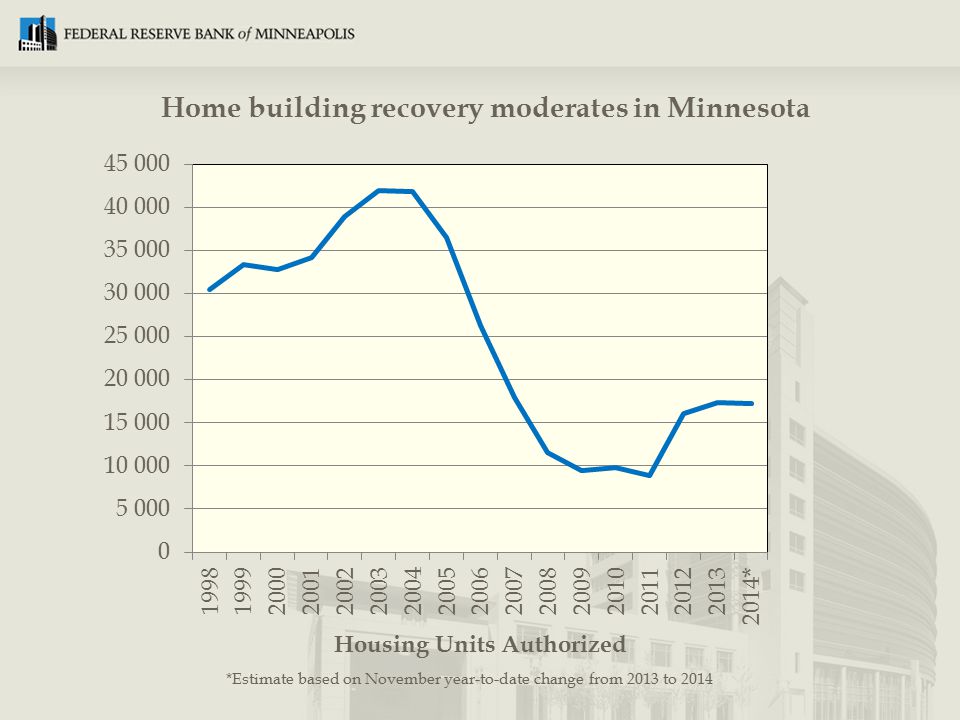
Comparing 2014 with last year’s forecast Employment growth stronger than forecast Unemployment rate lower than forecast Personal income growth slightly slower than forecast Home building somewhat weaker than forecast

8
Employment increased in most sectors Nonfarm employment, percent change from a year earlier, November 2014

9
Minnesota’s unemployment rate below prerecession levels Percent Source: Bureau of Labor Statistics

10
Oil and gasoline prices plunge at the end of 2014 Source: Energy Information Administration

11
Forecast models: Solid employment growth and continued decrease in the unemployment rate Business optimism near record high Manufacturers expect growth Home building flat Minnesota economy: Signs of optimism for 2015

12
Percent of respondents selecting somewhat optimistic or very optimistic

13
Minnesota employment expected to grow by 1.9 percent

14
Twin Cities business leaders expect increased employment at their companies *Index number above 50 indicates expansion. Index number below 50 indicates contraction.

15
Minnesota employment outlook positive *Index number above 50 indicates expansion. Index number below 50 indicates contraction.

16
Minnesota unemployment rate forecast at 3.3 percent by end of 2015

17
Overall Minnesota business leaders anticipate moderate increases in wages and salaries

18
Minnesota business leaders foresee overall moderate price increases *Index number above 50 indicates expansion. Index number below 50 indicates contraction.

19
Minnesota personal income growth expected to increase by 4.6 percent

20
Crop prices dropped Average farm prices 2011/20122012/2013 Estimated 2013/2014 Projected 2014/2015 (Current $ per bushel) Corn6.226.894.463.20-3.80 Soybean12.514.413.009.00-11.00 Wheat7.247.776.875.80-6.20 U.S. Department of Agriculture, estimates as of December 2014

21
Cattle prices solid Average farm prices 20122013 Estimated 2014Projected 2015 (Current $ per cwt) All Milk18.5220.0524.05-24.1518.45-19.25 Steers122.82125.89155.29160-172 Hogs60.8864.0576.2263-68 U.S. Department of Agriculture, estimates as of December 2014

22
Minnesota manufacturing survey indicates faster growth expected in 2015 *Index number above 50 indicates expansion. Index number below 50 indicates contraction.

24
Minnesota business leaders expect slower growth in home building *Index number above 50 indicates expansion. Index number below 50 indicates contraction.

25
Minnesota economy: Signs of optimism for 2015 Forecast models: Solid employment growth and continued decrease in the unemployment rate Business optimism at record high Manufacturers expect growth Home building flat

26
Questions?

Similar presentations