Download presentation
Presentation is loading. Please wait.

1
Jamal Abedi National Center for Research on Evaluation, Standards, and Student Testing UCLA Graduate School of Education & Information Studies November 18, 2004 Psychometric Issues in the ELL Assessment and Special Education Eligibility English Language Learners Struggling to Learn: Emergent Research on Linguistic Differences and Learning Disabilities

2
Why Should English Language Learners be Assessed? Goals 2000 Title I and VII of the Improving America’s School Act of 1994 (IASA) No Child Left Behind Act
 No Child Left Behind Act.")
3
Should Schools Test English Language Learners? Yes Assessment outcomes may not be valid because their low level English proficiency interferes with content knowledge performance Test results affect decisions regarding promotion or graduation They may be inappropriately placed into special educational programs where they receive inappropriate instruction ELL students may not have received the same curriculum which is assumed for the test General Problems English language learners (ELLs) can be placed at a disadvantage because:
 can be placed at a disadvantage because:.")
4
Should Schools Test English Language Learners? Yes Problems In Large-Scale Assessment: Standardized assessment Assessment tools in large-scale assessments are usually constructed based on norms that exclude ELL populations Research shows major differences between the performance of ELL and non-ELL students on the results of standardized large-scale assessments The tests may be biased in favor of non-ELL populations Performance/alternative assessment Such assessments require more language production; thus students with lower language capabilities are at a greater disadvantage Scorers may not be familiar with rating ELL performance

5
Problems Due to the powerful impact of assessment on instruction, ELL and SWD students’ quality of instruction may be affected If excluded, they will be dropped out of the accountability picture Institutions will not be held responsible for their performance in school They will not be included in state or federal policy decision Their academic progress, skills, and needs may not be appropriately assessed Should Schools Test English Language Learners? No

6
States with the Highest Proportion of ELL Students Percentage of Total Student Population: California27.0 New Mexico19.0 Arizona15.4 Alaska 15.0 Texas14.0 Nevada11.8 Florida10.7

7
Problems in AYP Reporting: Focus on LEP Students 1.Problems in classification/reclassification of LEP students (moving target subgroup) 2.Measurement quality 3.Low baseline 4.Instability of the LEP subgroup 5.Sparse LEP population 6.LEP cutoff points (Conjunctive vs. Compensatory model)
.")
8
Site 2 Stanford 9 Sub-scale Reliabilities (1998) Grade 9 Alphas Non-LEP Students Sub-scale (Items)Hi SESLow SES English Only FEPRFEPLEP Reading, N=205,09235,855181,20237,87621,86952,720 -Vocabulary (30).828.781.835.814.759.666 -Reading Comp (54).912.893.916.903.877.833 Average Reliability.870.837.876.859.818.750 Math, N=207,15536,588183,26238,32922,15254,815 -Total (48).899.853.898.876.802 Language, N=204,57135,866180,74337,86221,85252,863 -Mechanics (24).801.759.803.802.755.686 -Expression (24).818.779.812.804.757.680 Average Reliability.810.769.813.803.756.683 Science, N=163,96028,377144,82129,94617,57040,255 -Total (40).800.723.805.778.716.597 Social Science, N=204,96536,132181,07838,05221,96753,925 -Total (40).803.702.805.784.722.530
 Grade 9 Alphas Non-LEP Students Sub-scale (Items)Hi SESLow SES English Only FEPRFEPLEP Reading, N=205,09235,855181,20237,87621,86952,720 -Vocabulary (30) Reading Comp (54) Average Reliability Math, N=207,15536,588183,26238,32922,15254,815 -Total (48) Language, N=204,57135,866180,74337,86221,85252,863 -Mechanics (24) Expression (24) Average Reliability Science, N=163,96028,377144,82129,94617,57040,255 -Total (40) Social Science, N=204,96536,132181,07838,05221,96753,925 -Total (40)")
9
Classical Test Theory: Reliability 2 X = 2 T + 2 E X: Observed Score T: True Score E: Error Score XX’= 2 T / 2 X XX’= 1- 2 E / 2 X Textbook examples of possible sources that contribute to the measurement error: 2 Rater Occasion Item Test Form

10
Classical Test Theory: Reliability 2 X = 2 T + 2 E 2 X = 2 T + 2 E + 2 S + ES XX’= 1- (( 2 E + 2 S + ES )/ 2 X ) 2
/ 2 X ) 2")
11
Generalizability Theory: Partitioning Error Variance into Its Components s 2 (X pro ) = 2 p + 2 r + 2 o + 2 pr + 2 po + 2 ro + 2 pro,e p: Person r: Rater o: Occasion Are there any sources of measurement error that may specifically influence ELL performance? 3

12
Grade 11 Stanford 9 Reading and Science Structural Modeling Results (DF=24), Site 3 All Cases (N=7,176) Even Cases (N=3,588) Odd Cases (N=3,588) Non-LEP (N=6,932) LEP (N=244) Goodness of Fit Chi Square1786943870167581 NFI.931.926.934.932.877 NNFI.898.891.904.900.862 CFI.932.928.936.933.908 Factor Loadings Reading Variables Composite 1.733.720.745.723.761 Composite 2.735.730.741.727.713 Composite 3.784.779.789.778.782 Composite 4.817.722.712.716.730 Composite 5.633.622.644.636.435 Math Variables Composite 1.712.719705709660 Composite 2.695.696.695.701.581 Composite 3.641.628.654.644.492 Composite 4.450.428.470.455.257 Factor Correlation Reading vs. Math.796.795.797.791 Note. NFI = Normed Fit Index. NNFI = Non-Normed Fit Index. CFI = Comparative Fit Index.

13
Normal Curve Equivalent Means & Standard Deviations for Students in Grades 10 and 11, Site 3 School District Reading Science Math MSD M SD M SD Grade 10 SWD only16.412.725.513.322.511.7 LEP only24.016.432.915.336.816.0 LEP & SWD16.311.224.8 9.323.6 9.8 Non-LEP/SWD 38.016.042.617.239.616.9 All students36.016.941.317.538.517.0 Grade 11 SWD Only14.913.221.512.324.313.2 LEP Only22.516.128.414.445.518.2 LEP & SWD15.512.726.120.125.113.0 Non-LEP/SWD 38.418.339.618.845.221.1 All Students36.219.038.218.944.021.2

14
SubgroupReadingMathLanguageSpelling LEP Status LEP Mean26.334.632.328.5 SD15.2 16.616.7 N62,27364,15362,55964,359 Non-LEP Mean51.752.055.251.6 SD19.520.720.920.0 N244,847245,838243,199246,818 SES Low SES Mean34.338.138.936.3 SD18.917.119.820.0 N92,30294,05492,22194,505 Higher SES Mean48.249.451.747.6 SD21.821.622.622.0 N307,931310,684306,176312,321 Site 2 Grade 7 SAT 9 Subsection Scores

15
ReadingMathMath Calculation Math Analytical Non-LEP/Non- SWD Mean45.6349.3049.0948.75 SD21.1020.4720.7819.61 N921791.18984692.50 LEP only Mean20.2636.0039.2033.86 SD16.3918.4821.2516.88 N692687696699 SWD only Mean18.8627.8228.4229.10 SD19.7014.1015.7615.14 N872843883873 LEP/SWD Mean9.7821.3722.7522.87 SD11.5010.7512.9412.06 N93929794 Site 4 Grade 8 Descriptive Statistics for the SAT 9 Test Scores by Strands

16
Accommodations for SWD/LEP Accommodations that are appropriate for the particular subgroup should be used

17
Why Should English Language Learners be Accommodated? Their possible English language deficiency may interfere with their content knowledge performance. Assessment tools may be culturally and linguistically biased for these students. Linguistic complexity of the assessment tools may be a source of measurement error. Language factors may be a source of construct irrelevant variance.

18
SY 2000-2001 Accommodations Designated for ELLs Cited in States’ Policies There are 73 accommodations listed: N:Not Related R:Remotely Related M:Moderately Related H:Highly Related From: Rivera (2003) State assessment policies for English language learners. Presented at the 2003 Large-Scale Assessment Conference

19
N1. Test time increased N2. Breaks provided N3. Test schedule extended N4. Subtests flexibly scheduled N5. Test administered at time of day most beneficial to test-taker N = not related; R = remotely related; M = moderately related; H = highly related I. Timing/Scheduling (N = 5) SY 2000-2001 Accommodations Designated for ELLs Cited in States’ Policies
 SY Accommodations Designated for ELLs Cited in States’ Policies.")
20
There are 73 Accommodations Listed 47 or 64% are not related 7 or 10% are remotely related 8 or 11% are moderately related 11 or 15% are highly related

21
A Clear Language of Instruction and Assessment Works for ELLs, SWDs, and Everyone What is language modification of test items?

22
Examining Complex Linguistic Features in Content-Based Test Items

23
Familiarity/frequency of non-math vocabulary: unfamiliar or infrequent words changed census > video game A certain reference file > Mack ’ s company Length of nominals: long nominals shortened last year ’ s class vice president > vice president the pattern of puppy ’ s weight gain > the pattern above Question phrases: complex question phrases changed to simple question words At which of the following times > When which is best approximation of the number > approximately how many Linguistic Modification Concerns

24
Conditional clauses: conditionals either replaced with separate sentences or order of conditional and main clause changed If Lee delivers x newspapers > Lee delivers x newspapers If two batteries in the sample were found to be dead > he found three broken pencils in the sample Relative clauses: relative clauses either removed or re-cast A report that contains 64 sheets of paper > He needs 64 sheets of paper for each report Voice of verb phrase: passive verb forms changed to active The weights of 3 objects were compared > Sandra compared the weights of 3 rabbits If a marble is taken from the bag > if you take a marble from the bag Linguistic Modification cont.

25
Original: 2. The census showed that three hundred fifty-six thousand, ninety-seven people lived in Middletown. Written as a number, that is: A. 350,697 B. 356,097 C. 356,907 D. 356,970 Modified: 2. Janet played a video game. Her score was three hundred fifty-six thousand, ninety-seven. Written as number, that is: A. 350,697 B. 356,097 C. 356,907 D. 356,970

26
Interview Study Table 1. Student Perceptions Study: First Set (N=19) Item #Original item chosenRevised item chosen 1316 2415 3109 4118 Table 2. Student Perceptions Study: Second Set (N=17) Item #Original item chosenRevised item chosen 5314 64.5a12.5 7215 8215
 Item #Original item chosenRevised item chosen Table 2. Student Perceptions Study: Second Set (N=17) Item #Original item chosenRevised item chosen a")
27
Many students indicated that the language in the revised item was easier: “Well, it makes more sense.” “It explains better.” “Because that one’s more confusing.” “It seems simpler. You get a clear idea of what they want you to do.”

28
Issues in the ELL Special Education Eligibility Issues concerning authenticity of English language Proficiency tests Issues and problems in identifying students with learning disability in general Distribution of English language proficiency across ELL/non-ELL student categories

29
Issues concerning authenticity of English language Proficiency tests Issues in theoretical bases (discrete point approach, holistic approach, Pragmatic approach) Issues in content coverage (language proficiency standards) Issues concerning psychometrics of the assessment Low relationship between ELL classification categories and English proficiency scores
 Issues in content coverage (language proficiency standards) Issues concerning psychometrics of the assessment Low relationship between ELL classification categories and English proficiency scores")
30
Issues and problems in identifying students with learning disability in general A large majority of students with disabilities fall in learning disability Validity of identifying students with learning disability is questionable

31
Distribution of English language proficiency across ELL/non-ELL student Most of the existing tests of English proficiency lack enough discrimination power There is a large number of ELL students perform higher than non- ELL student The line between ELL and non-ELL on their English proficiency is not a clear line

32
Reducing the Language Load of Test Items Reducing unnecessary language complexity of test items helps ELL students (and to some extent SWDs) present a more valid picture of their content knowledge. The language clarification of test items may be used as a form of accommodation for English language learners. The results of our research suggest that linguistic complexity of test items may be a significant source of measurement error for ELL students.

33
Conclusions and Recommendation 1. Classification Issues Classifications of ELLs and SWDs: Must be based on multiple criteria that have predictive power for such classifications These criteria must be objectively defined Must have sound theoretical and practical bases Must be easily and objectively measurable

34
Conclusions and Recommendation 2. Assessment Issues Assessment for ELLs and SWDs: Must be based on a sound psychometric principles Must be controlled for all sources of nuisance or confounding variables Must be free of unnecessary linguistic complexities Must include sufficient number of ELLs and SWDs in its development process (field testing, standard setting, etc.) Must be free of biases, such as cultural biases Must be sensitive to students’ linguistics and cultural needs
 Must be free of biases, such as cultural biases Must be sensitive to students’ linguistics and cultural needs.")
35
3. Issues concerning special education eligibility particularly in placing ELL students at the lower English language proficiency in the learning/ reading disability category There are psychometric issues with the English language proficiency tests Standardized achievement tests may not provide reliable and valid assessment of ELL students Reliable and valid measures are needed to distinguish between learning disability and low level of English proficiency

36
Conclusions and Recommendation 4. Accommodation Issues Accommodations: Must be relevant to the subgroups of students Must be effective in reducing the performance gap between accommodated and non-accommodated students Must be valid, that is, accommodations should not alter the construct being measured The results could be combined with the assessments under standard conditions Must be feasible in the national and state assessments

37
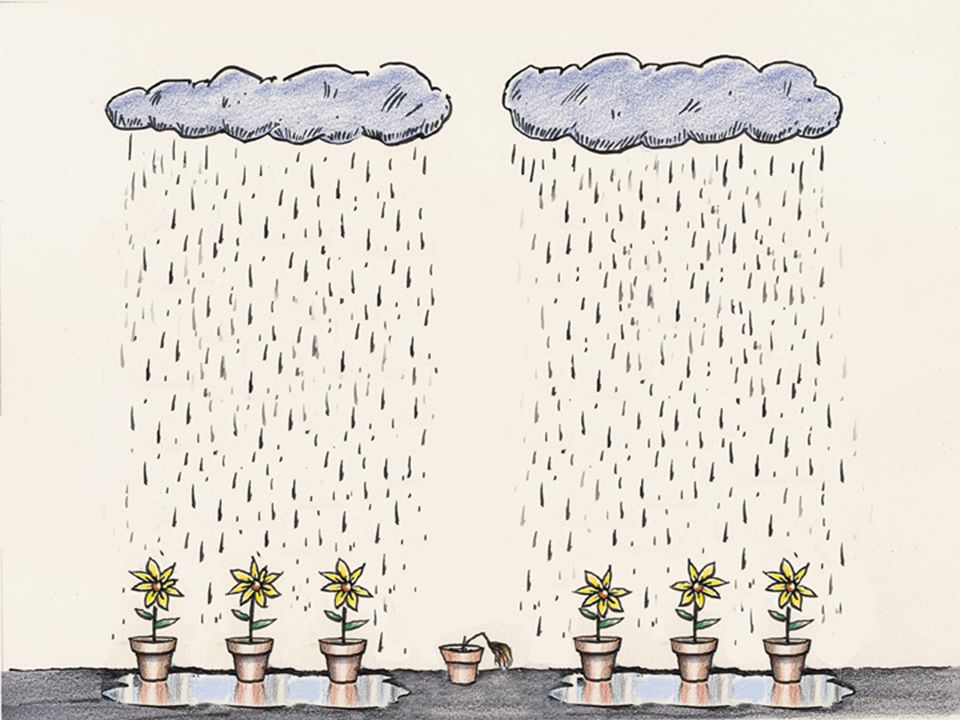
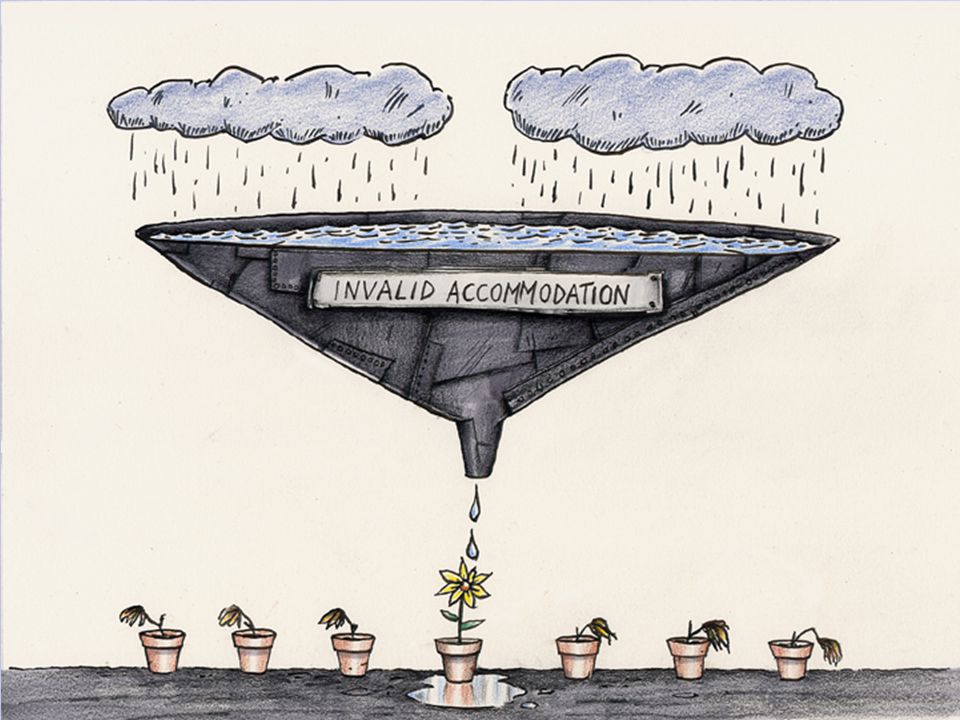
Now for a visual art representation of invalid accommodations…

Similar presentations


>")


