Download presentation
Presentation is loading. Please wait.

1
-PIPING AND INSTRUMENTATION DIAGRAM (P&ID)
")
2
The Piping & Instrumentation Diagram (P&ID)
Sometimes also known as Process & Instrumentation Diagram Detailed graphical representation of a process including the hardware and software (i.e piping, equipment, and instrumentation) necessary to design, construct and operate the facility. Common synonyms for P&IDs include Engineering Flow Diagram (EFD), Utility Flow Diagram (UFD) and Mechanical Flow Diagram (MFD).
 necessary to design, construct and operate the facility. Common synonyms for P&IDs include Engineering Flow Diagram (EFD), Utility Flow Diagram (UFD) and Mechanical Flow Diagram (MFD).")
3
The Piping & Instrumentation Diagram (P&ID)
Sometimes also known as Process & Instrumentation Diagram

4
The Piping & Instrumentation Diagram (P&ID)
Sometimes also known as Process & Instrumentation Diagram Basic Loop Process Sensing Element Measuring Element Transmit Control Element Final Control Transmitter

5
The Piping & Instrumentation Diagram (P&ID)
Sometimes also known as Process & Instrumentation Diagram Basic Loop Set point Controller Transmitter Fluid Fluid Orifice (Flow Sensor)
")
6
The Piping & Instrumentation Diagram (P&ID)
Sometimes also known as Process & Instrumentation Diagram SENSORS (Sensing Element) A device, such as a photoelectric cell, that receives and responds to a signal or stimulus. A device, usually electronic, which detects a variable quantity and measures and converts the measurement into a signal to be recorded elsewhere. A sensor is a device that measures a physical quantity and converts it into a signal which can be read by an observer or by an instrument. For example, a mercury thermometer converts the measured temperature into expansion and contraction of a liquid which can be read on a calibrated glass tube. A thermocouple converts temperature to an output voltage which can be read by a voltmeter. For accuracy, all sensors need to be calibrated against known standards.
 A device, such as a photoelectric cell, that receives and responds to a signal or stimulus. A device, usually electronic, which detects a variable quantity and measures and converts the measurement into a signal to be recorded elsewhere. A sensor is a device that measures a physical quantity and converts it into a signal which can be read by an observer or by an instrument. For example, a mercury thermometer converts the measured temperature into expansion and contraction of a liquid which can be read on a calibrated glass tube. A thermocouple converts temperature to an output voltage which can be read by a voltmeter. For accuracy, all sensors need to be calibrated against known standards.")
7
The Piping & Instrumentation Diagram (P&ID)
Sometimes also known as Process & Instrumentation Diagram Temperature Sensor 1. Thermocouple A thermocouple is a junction between two different metals that produces a voltage related to a temperature difference. Thermocouples are a widely used type of temperature sensor and can also be used to convert heat into electric power.

8
The Piping & Instrumentation Diagram (P&ID)
Sometimes also known as Process & Instrumentation Diagram

9
The Piping & Instrumentation Diagram (P&ID)
Sometimes also known as Process & Instrumentation Diagram Temperature Sensor 2. Resistance Temperature Detector (RTD) Resistance Temperature Detectors (RTD), as the name implies, are sensors used to measure temperature by correlating the resistance of the RTD element with temperature. Most RTD elements consist of a length of fine coiled wire wrapped around a ceramic or glass core. The element is usually quite fragile, so it is often placed inside a sheathed probe to protect it. The RTD element is made from a pure material whose resistance at various temperatures has been documented. The material has a predictable change in resistance as the temperature changes; it is this predictable change that is used to determine temperature.
 Resistance Temperature Detectors (RTD), as the name implies, are sensors used to measure temperature by correlating the resistance of the RTD element with temperature. Most RTD elements consist of a length of fine coiled wire wrapped around a ceramic or glass core. The element is usually quite fragile, so it is often placed inside a sheathed probe to protect it. The RTD element is made from a pure material whose resistance at various temperatures has been documented. The material has a predictable change in resistance as the temperature changes; it is this predictable change that is used to determine temperature.")
10
The Piping & Instrumentation Diagram (P&ID)
Sometimes also known as Process & Instrumentation Diagram Accuracy for Standard OMEGA RTDs Temperature °C Ohms °C -200 ±056 ±1.3 -100 ±0.32 ±0.8 ±0.12 ±0.3 100 ±0.30 200 ±0.48 300 ±0.64 ±1.8 400 ±0.79 ±2.3 500 ±0.93 ±2.8 600 ±1.06 ±3.3 650 ±1.13 ±3.6

11
The Piping & Instrumentation Diagram (P&ID)
Sometimes also known as Process & Instrumentation Diagram Flow Sensor 1. Turbine Meter In a turbine, the basic concept is that a meter is manufactured with a known cross sectional area. A rotor is then istalled inside the meter with its blades axial to the product flow. When the product passes the rotor blades, they impart an angular velocity to the blades and therefore to the rotor. This angular velocity is directly proportional to the total volumetric flow rate. Turbine meters are best suited to large, sustained flows as they are susceptible to start/stop errors as well as errors caused by unsteady flow states.

12
The Piping & Instrumentation Diagram (P&ID)
Sometimes also known as Process & Instrumentation Diagram Flow Sensor 2. Magnetic Flow Meter Measurement of slurries and of corrosive or abrasive or other difficult fluids is easily made. There is no obstruction to fluid flow and pressure drop is minimal. The meters are unaffected by viscosity, density, temperature, pressure and fluid turbulence. Magnetic flow meters utilize the principle of Faraday’s Law of Induction; similar principle of an electrical generator. When an electrical conductor moves at right angle to a magnetic field, a voltage is induced.

13
The Piping & Instrumentation Diagram (P&ID)
Sometimes also known as Process & Instrumentation Diagram

14
The Piping & Instrumentation Diagram (P&ID)
Sometimes also known as Process & Instrumentation Diagram Flow Sensor 3. Orifice Meter

15
The Piping & Instrumentation Diagram (P&ID)
Sometimes also known as Process & Instrumentation Diagram Flow Sensor 4. Venturi Meter A device for measuring flow of a fluid in terms of the drop in pressure when the fluid flows into the constriction of a Venturi tube. A meter, developed by Clemens Herschel, for measuring flow of water or other fluids through closed conduits or pipes. It consists of a venturi tube and one of several forms of flow registering devices.

16
The Piping & Instrumentation Diagram (P&ID)
Sometimes also known as Process & Instrumentation Diagram TRANSMITTER Transmitter is a transducer* that responds to a measurement variable and converts that input into a standardized transmission signal. *Transducer is a device that receives output signal from sensors. Pressure Level Transmitter Differential Pressure Transmitter Pressure Transmitter

17
Indicating Controller
The Piping & Instrumentation Diagram (P&ID) Sometimes also known as Process & Instrumentation Diagram CONTROLLER Controller is a device which monitors and affects the operational conditions of a given dynamical system. The operational conditions are typically referred to as output variables of the system which can be affected by adjusting certain input variables Indicating Controller Recording Controller
 Sometimes also known as Process & Instrumentation Diagram. CONTROLLER. Controller is a device which monitors and affects the operational conditions of a given dynamical system. The operational conditions are typically referred to as output variables of the system which can be affected by adjusting certain input variables. Indicating Controller. Recording Controller.")
18
The Piping & Instrumentation Diagram (P&ID)
Sometimes also known as Process & Instrumentation Diagram FINAL CONTROL ELEMENT Final Control Element is a device that directly controls the value of manipulated variable of control loop. Final control element may be control valves, pumps, heaters, etc. Pump Control Valve Heater

19
-Instrumentation Symbology-
PART I -Instrumentation Symbology-

20
The Piping & Instrumentation Diagram (P&ID)
Sometimes also known as Process & Instrumentation Diagram Instrumentation Symbology Instruments that are field mounted -Instruments that are mounted on process plant (i.e sensor that mounted on pipeline or process equipments. Field mounted on pipeline

21
The Piping & Instrumentation Diagram (P&ID)
Sometimes also known as Process & Instrumentation Diagram Instrumentation Symbology Instruments that are board mounted -Instruments that are mounted on control board.

22
The Piping & Instrumentation Diagram (P&ID)
Sometimes also known as Process & Instrumentation Diagram Instrumentation Symbology Instruments that are board mounted (invisible). -Instruments that are mounted behind a control panel board.
. -Instruments that are mounted behind a control panel board.")
23
The Piping & Instrumentation Diagram (P&ID)
Sometimes also known as Process & Instrumentation Diagram Instrumentation Symbology Instruments that are functioned in Distributed Control System (DCS) - A distributed control system (DCS) refers to a control system usually of a manufacturing system, process or any kind of dynamic system, in which the controller elements are not central in location (like the brain) but are distributed throughout the system with each component sub-system controlled by one or more controllers. The entire system of controllers is connected by networks for communication and monitoring.
 - A distributed control system (DCS) refers to a control system usually of a manufacturing system, process or any kind of dynamic system, in which the controller elements are not central in location (like the brain) but are distributed throughout the system with each component sub-system controlled by one or more controllers. The entire system of controllers is connected by networks for communication and monitoring.")
24
The Piping & Instrumentation Diagram (P&ID)
Sometimes also known as Process & Instrumentation Diagram Instrumentation Symbology

25
The Piping & Instrumentation Diagram (P&ID)
Sometimes also known as Process & Instrumentation Diagram FC Flow Controller PT Pressure Transmitter FE Flow Element PTD Pressure Transducer FI Flow Indicator FT Flow Transmitter LC Level Controller FS Flow Switch LG Level Gauge FIC Flow Indicating Controller LR Level Recorder FCV Flow Control Valve LT Level Transmitter FRC Flow Recording Controller LS Level Switch LIC Level Indicating Controller PC Pressure Controller LCV Level Control Valve PG Pressure Gauge LRC Level Recording Controller PI Pressure Indicator PR Pressure Recorder TE Temperature Element PS Pressure Switch TI Temperature Indicator PIC Pressure Indicating Controller TR Temperature Recorder PCV Pressure Control Valve TS Temperature Switch PRC Pressure Recording Controller TC Temperature Controller PDI Pressure Differential Indicator TT Temperature Transmitter PDR Pressure Differential Recorder PDS Pressure Differential Switch PDT Pressure Differential Transmitter

27
The Piping & Instrumentation Diagram (P&ID)
Sometimes also known as Process & Instrumentation Diagram Signal Lines Symbology

28
PART II -Principal of P&ID-

29
The Piping & Instrumentation Diagram (P&ID)
Sometimes also known as Process & Instrumentation Diagram Principal of P&ID Example 1 With using these following symbols; Complete control loop for LCV 101 V-100 LC LC LV 100 LT LCV 101

30
The Piping & Instrumentation Diagram (P&ID)
Sometimes also known as Process & Instrumentation Diagram Example 2 With using these following symbology; Draw control loop to show that PRV-100 will be activated to relief pressure when the pressure in the V-100 is higher than desired value. PRV-100 Where PE is locally mounted on V-100 V-100 PE PE PIC PT Where PT is locally mounted PT PIC Where PIC is function in DCS

31
The Piping & Instrumentation Diagram (P&ID)
Sometimes also known as Process & Instrumentation Diagram Exercise 1 pHE 1 pHT 1 pHIC 1 pHE 2 pHT 2 pHIC 2 CV-102 TK-102 (base feed tank) The diagram shows pH adjustment; part of waste water treatment process. With using above symbols, draw control loop where the process need is: The process shall maintained at pH 6. When the process liquid states below pH 6, CV-102 will be opened to dosing NaOH to the tank TK-100. When the process liquid states above pH 6, CV-101 will be operated to dosing HCl. CV-101 TK-100 (pH adjustment tank) TK-101 (acid feed tank)
 The diagram shows pH adjustment; part of waste water treatment process. With using above symbols, draw control loop where the process need is: The process shall maintained at pH 6. When the process liquid states below pH 6, CV-102 will be opened to dosing NaOH to the tank TK-100. When the process liquid states above pH 6, CV-101 will be operated to dosing HCl. CV-101. TK-100. (pH adjustment tank) TK-101. (acid feed tank)")
32
The Piping & Instrumentation Diagram (P&ID)
Sometimes also known as Process & Instrumentation Diagram pHIC 2 Answer 1 pHE 1 pHT 1 pHIC 1 pHTE 2 pHT 2 pHIC 2 CV-102 TK-102 (base feed tank) pHT 2 The diagram shows pH adjustment; part of waste water treatment process. With using above symbols, draw control loop where the process need is: The process shall maintained at pH 6. When the process liquid states below pH 6, CV-102 will be opened to dosing NaOH in the base feed tank. When the process liquid states above pH 6, CV-101 will be operated to dosing HCl in the acid fed tank. pHT 1 pHIC 1 pHE 2 pHE 1 CV-101 TK-100 (pH adjustment tank) TK-101 (acid feed tank)
 pHT 2. The diagram shows pH adjustment; part of waste water treatment process. With using above symbols, draw control loop where the process need is: The process shall maintained at pH 6. When the process liquid states below pH 6, CV-102 will be opened to dosing NaOH in the base feed tank. When the process liquid states above pH 6, CV-101 will be operated to dosing HCl in the acid fed tank. pHT 1. pHIC 1. pHE 2. pHE 1. CV-101. TK-100. (pH adjustment tank) TK-101. (acid feed tank)")
33
The Piping & Instrumentation Diagram (P&ID)
Sometimes also known as Process & Instrumentation Diagram Exercise 2 LT 1 LIC 1 FC L3 Where LT 1 and LIC 1 to control PCV-100 (failure close); PCV-100 close when level reached L 3 PCV-100 open when level below L3 PCV-100 L2 TK-100 L1 FC V-100 L5 PCV-101 LT 2 LIC 2 L4 Where LT 2 and LIC 2 to control PCV-101 (failure close); PCV-101 close when level reached L5 PCV-101 open when level below L5
; PCV-100 close when level reached L 3. PCV-100 open when level below L3. PCV-100. L2. TK-100. L1. FC. V-100. L5. PCV-101. LT 2. LIC 2. L4. Where LT 2 and LIC 2 to control PCV-101 (failure close); PCV-101 close when level reached L5. PCV-101 open when level below L5.")
34
The Piping & Instrumentation Diagram (P&ID)
Sometimes also known as Process & Instrumentation Diagram Answer 2 LIC 1 LT 1 LIC 1 FC L3 Where LT 1 and LIC 1 to control PRV-100 (failure close); PRV-100 close when level reached L 3 PRV-100 open when level below L3 LT 1 PRV-100 L2 TK-100 L1 LIC 2 V-100 FC L5 LT 2 LIC 2 LT 2 PRV-101 L4 Where LT 1 and LIC 1 to control PRV-101 (failure close); PRV-101 close when level reached L5 PRV-101 open when level below L5
; PRV-100 close when level reached L 3. PRV-100 open when level below L3. LT 1. PRV-100. L2. TK-100. L1. LIC 2. V-100. FC. L5. LT 2. LIC 2. LT 2. PRV-101. L4. Where LT 1 and LIC 1 to control PRV-101 (failure close); PRV-101 close when level reached L5. PRV-101 open when level below L5.")
35
-Instrumentation Numbering-
PART II -Instrumentation Numbering-

36
The Piping & Instrumentation Diagram (P&ID)
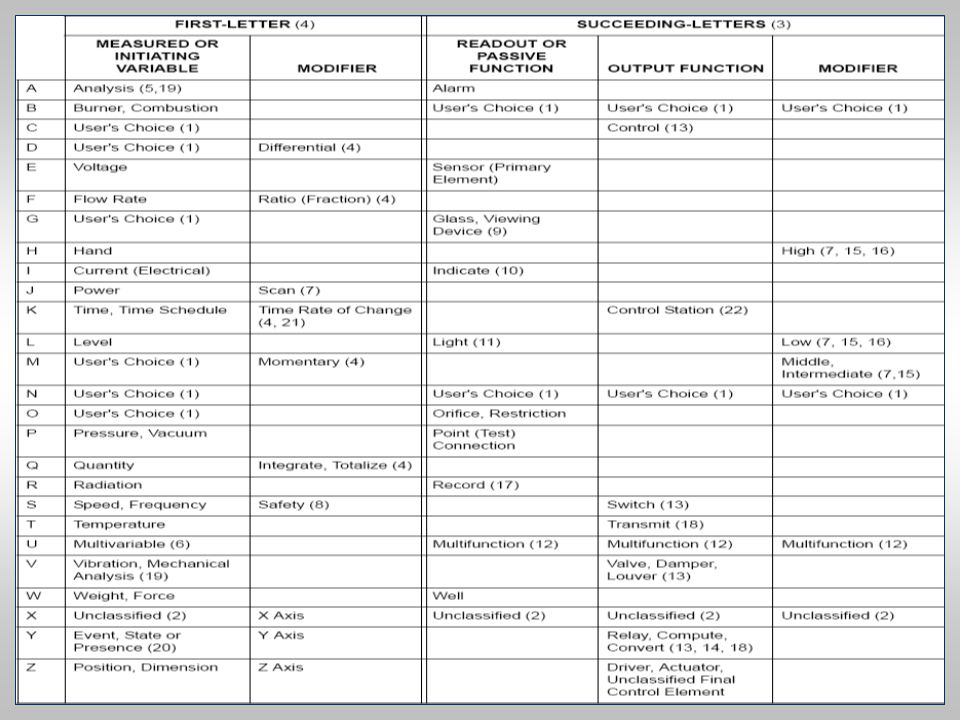
Sometimes also known as Process & Instrumentation Diagram Instrumentation Numbering XYY CZZLL X represents a process variable to be measured. (T=temperature, F=flow, P=pressure, L=level) YY represents type of instruments. C designates the instruments area within the plant. ZZ designates the process unit number. LL designates the loop number.
 YY represents type of instruments. C designates the instruments area within the plant. ZZ designates the process unit number. LL designates the loop number.")
37
The Piping & Instrumentation Diagram (P&ID)
Sometimes also known as Process & Instrumentation Diagram Instrumentation Numbering LIC 10003 L = Level shall be measured. IC = Indicating controller. 100 = Process unit no. 100 in the area of no. 1 03 = Loop number 3

38
The Piping & Instrumentation Diagram (P&ID)
Sometimes also known as Process & Instrumentation Diagram Instrumentation Numbering FRC 82516 F = Flow shall be measured. RC = Recording controller 825 = Process unit no. 825 in the area of no. 8. 16 = Loop number 16

39
4) Test 2- 21 October 2010 (1500-1600) INFORMATION
1) Seminar from industrial Expert- 7 October 2010 (time) 2) Submit assignment October 2010 before 1200 noon. 3) Submit Mini Project- 14 October 2010 before 1700 3) Presentation Mini Project- 19 ( ) and 26 October 2010 ( ) and ( ) 4) Test October 2010 ( )
 Seminar from industrial Expert- 7 October 2010 (time) 2) Submit assignment October 2010 before 1200 noon. 3) Submit Mini Project- 14 October 2010 before ) Presentation Mini Project- 19 ( ) and 26 October 2010 ( ) and ( ) 4) Test October 2010 ( )")
40
PART IV

41
PIPING & INSTRUMENTATION DIAGRAM -PROCESS CONTROL VARIETY-

42
The Piping & Instrumentation Diagram (P&ID)
Sometimes also known as Process & Instrumentation Diagram SCOPE: Students will be able to know:- Type of Process Control Loop Definition and application of various type of Process Control Loop

43
The Piping & Instrumentation Diagram (P&ID)
The Piping & Instrumentation Diagram (P&ID) Sometimes also known as Process & Instrumentation Diagram Type of Process Control Loop Feedback Control Feedforward Control Feedforward-plus-Feedback Control Ratio Control Split Range Control Cascade Control Differential Control
 Sometimes also known as Process & Instrumentation Diagram. Type of Process Control Loop. Feedback Control. Feedforward Control. Feedforward-plus-Feedback Control. Ratio Control. Split Range Control. Cascade Control. Differential Control.")
44
The Piping & Instrumentation Diagram (P&ID)
Sometimes also known as Process & Instrumentation Diagram Feedback Control One of the simplest process control schemes. A feedback loop measures a process variable and sends the measurement to a controller for comparison to set point. If the process variable is not at set point, control action is taken to return the process variable to set point. The advantage of this control scheme is that it is simple using single transmitter. This control scheme does not take into consideration any of the other variables in the process. V-100 LCV-100 LC Fluid in Fluid out LT Y

45
The Piping & Instrumentation Diagram (P&ID)
Sometimes also known as Process & Instrumentation Diagram Feedback Control (cont…) Feedback loop are commonly used in the process control industry. The advantage of a feedback loop is that directly controls the desired process variable. The disadvantage of feedback loops is that the process variable must leave set point for action to be taken. V-100 LCV-100 LC Fluid in Fluid out LT Y
 Feedback loop are commonly used in the process control industry. The advantage of a feedback loop is that directly controls the desired process variable. The disadvantage of feedback loops is that the process variable must leave set point for action to be taken. V-100. LCV-100. LC. Fluid in. Fluid out. LT. Y.")
46
The Piping & Instrumentation Diagram (P&ID)
Sometimes also known as Process & Instrumentation Diagram Example 1 Figure below shows the liquid vessel for boiler system. This system has to maximum desired temperature of 120 degree Celcius (L2) where the heater will be cut off when the temperature reached desired temperature. Draw feedback control loop for the system. TC V-100 Fluid in TT Fluid out V 100
 where the heater will be cut off when the temperature reached desired temperature. Draw feedback control loop for the system. TC. V-100. Fluid in. TT. Fluid out. V 100.")
47
The Piping & Instrumentation Diagram (P&ID)
Sometimes also known as Process & Instrumentation Diagram Feedforward Control Feedforward loop is a control system that anticipates load disturbances and controls them before they can impact the process variable. For feedforward control to work, the user must have a mathematical understanding of how the manipulated variables will impact the process variable. LCV-100 FT FC Y Steam TI Process variable need to be controlled = Temperature Fluid in Fluid out

48
The Piping & Instrumentation Diagram (P&ID)
Sometimes also known as Process & Instrumentation Diagram Feedforward Control (cont…) An advantage of feedforward control is that error is prevented, rather than corrected. However, it is difficult to account for all possible load disturbances in a system through feedforward control. In general, feedforward system should be used in case where the controlled variable has the potential of being a major load disturbance on the process variable ultimately being controlled. LCV-100 FT FC Y Steam TI Process variable need to be controlled = Temperature Fluid in Fluid out
 An advantage of feedforward control is that error is prevented, rather than corrected. However, it is difficult to account for all possible load disturbances in a system through feedforward control. In general, feedforward system should be used in case where the controlled variable has the potential of being a major load disturbance on the process variable ultimately being controlled. LCV-100. FT. FC. Y. Steam. TI. Process variable need to be controlled = Temperature. Fluid in. Fluid out.")
49
The Piping & Instrumentation Diagram (P&ID)
Sometimes also known as Process & Instrumentation Diagram Example 2 Figure below shows compressed gas vessel. Process variable that need to be controlled is pressure where the vessel should maintain pressure at 60 psi. This pressure controlled through the gas flow measurement into the vessel. By using feedforward control system, draw the loop. Y FC V-100 Process variable need to be controlled = Pressure FT PI

50
The Piping & Instrumentation Diagram (P&ID)
Sometimes also known as Process & Instrumentation Diagram Exercise 1 Figure below shows the boiler system that used to supply hot steam to a turbine. This system need to supply 100 psi hot steam to the turbine where the PCV-100 will be opened when the pressure reached that desired pressure. With using pressure control through temperature measurement in the boiler, draw a feedforward loop control system. BOILER Hot steam Water PCV-100 Process variable need to be controlled = Pressure

51
The Piping & Instrumentation Diagram (P&ID)
Sometimes also known as Process & Instrumentation Diagram Answer 1 Figure below shows the boiler system that used to supply hot steam to a turbine. This system need to supply 100 psi hot steam to the turbine where the PCV-100 will be opened when the pressure reached that desired pressure. With using pressure control through temperature measurement in the boiler, draw a feedforward loop control system. TIC Y TT BOILER Hot steam Water Process variable need to be controlled = Pressure PI

52
The Piping & Instrumentation Diagram (P&ID)
Sometimes also known as Process & Instrumentation Diagram Feedforward-plus-Feedback Control Because of the difficulty of accounting for every possible load disturbance in a feedforward system, this system are often combined with feedback systems. Controller with summing functions are used in these combined systems to total the input from both the feedforward loop and the feedback loop, and send a unified signal to the final control element. FC TC FT Process variable need to be controlled = Temperature Fluid in TT Y Steam Fluid out LCV-100

53
The Piping & Instrumentation Diagram (P&ID)
Sometimes also known as Process & Instrumentation Diagram Example 3 Figure below shows compressed gas vessel. Process variable that need to be controlled is pressure where the vessel should maintain pressure at 60 psi. By using pressure controlled through both the gas flow measurement into the vessel and vessel pressure itself, draw a feedforward-plus-feedback control loop system. Y PIC PT FC V-100 Process variable need to be controlled = Pressure FT

54
The Piping & Instrumentation Diagram (P&ID)
Sometimes also known as Process & Instrumentation Diagram Exercise 2 Figure below shows the boiler system that used to supply hot steam to a turbine. This system need to supply 100 psi hot steam to the turbine where the PCV-100 will be opened when the pressure reached that desired pressure. With using pressure control through temperature and pressure measurement in the boiler, draw a feedforward-plus-feedback control loop system. BOILER Hot steam Water Process variable need to be controlled = Pressure

55
The Piping & Instrumentation Diagram (P&ID)
Sometimes also known as Process & Instrumentation Diagram Answer 2 Figure below shows the boiler system that used to supply hot steam to a turbine. This system need to supply 100 psi hot steam to the turbine where the PCV-100 will be opened when the pressure reached that desired pressure. With using pressure control through temperature and pressure measurement in the boiler, draw a feedforward-plus-feedback control loop system. TIC PIC Y TT PT BOILER Hot steam Water Process variable need to be controlled = Pressure

56
The Piping & Instrumentation Diagram (P&ID)
Sometimes also known as Process & Instrumentation Diagram Ratio Control Ratio control is used to ensure that two or more flows are kept at the same ratio even if the flows are changing. FIC FF FT FT Water Acid 2 part of water 1 part of acid

57
The Piping & Instrumentation Diagram (P&ID)
Sometimes also known as Process & Instrumentation Diagram Ratio Control (cont…) Application: - Blending two or more flows to produce a mixture with specified composition. - Blending two or more flows to produce a mixture with specified physical properties. - Maintaining correct air and fuel mixture to combustion. FIC FF FT FT Water Acid 2 part of water 1 part of acid
 Application: - Blending two or more flows to produce a mixture with specified composition. - Blending two or more flows to produce a mixture with specified physical properties. - Maintaining correct air and fuel mixture to combustion. FIC. FF. FT. FT. Water. Acid. 2 part of water. 1 part of acid.")
58
The Piping & Instrumentation Diagram (P&ID)
Sometimes also known as Process & Instrumentation Diagram Ratio Control (Auto Adjusted) If the physical characteristic of the mixed flow is measured, a PID controller can be used to manipulate the ratio value. For example, a measurement of the density, gasoline octane rating, color, or other characteristic could be used to control that characteristic by manipulating the ratio. FF Remote Set Point FIC Remote Ratio Adjustment FT AIC FT Physical Property Measurement Water Acid 2 part of water 1 part of acid
 If the physical characteristic of the mixed flow is measured, a PID. controller can be used to manipulate the ratio value. For example, a measurement of the density, gasoline octane rating, color, or other characteristic could be used to control that characteristic. by manipulating the ratio. FF. Remote Set Point. FIC. Remote Ratio Adjustment. FT. AIC. FT. Physical Property Measurement. Water. Acid. 2 part of water. 1 part of acid.")
59
The Piping & Instrumentation Diagram (P&ID)
Sometimes also known as Process & Instrumentation Diagram Cascade Control Cascade Control uses the output of the primary controller to manipulate the set point of the secondary controller as if it were the final control element. Reasons for cascade control: Allow faster secondary controller to handle disturbances in the secondary loop. Allow secondary controller to handle non-linear valve and other final control element problems. Allow operator to directly control secondary loop during certain modes of operation (such as startup).
.")
60
The Piping & Instrumentation Diagram (P&ID)
Sometimes also known as Process & Instrumentation Diagram Cascade Control (cont…) Requirements for cascade control: Secondary loop process dynamics must be at least four times as fast as primary loop process dynamics. Secondary loop must have influence over the primary loop. Secondary loop must be measured and controllable.
 Requirements for cascade control: Secondary loop process dynamics must. be at least four times as fast as primary. loop process dynamics. Secondary loop must have influence. over the primary loop. Secondary loop must be measured and. controllable.")
61
The Piping & Instrumentation Diagram (P&ID)
Sometimes also known as Process & Instrumentation Diagram Exercise 3 Figure below shows pH adjustment process where pH 6.5 need to be maintained. pH in the tank is controlled by NaOH dosing to the tank. But somehow, the flow of waste (pH 4.5) also need to considered where excess flow of the waste shall make that pH in the tank will decrease. Draw a cascade control loop system. Waste, pH 4.5 NaOH Tank pH 6.5 Process variable need to be controlled = pH pH Adjustment Tank
 also need to considered where excess flow of the waste shall make that pH in the tank will decrease. Draw a cascade control loop system. Waste, pH 4.5. NaOH Tank. pH 6.5. Process variable need to be controlled = pH. pH Adjustment Tank.")
62
The Piping & Instrumentation Diagram (P&ID)
Sometimes also known as Process & Instrumentation Diagram Answer 3 Figure below shows pH adjustment process where pH 6.5 need to be maintained. pH in the tank is controlled by NaOH dosing to the tank. But somehow, the flow of waste (pH 4.5) also need to considered where excess flow of the waste shall make that pH in the tank will decrease. Draw a cascade control loop system. FC pHC Y FT pHT Waste, pH 4.5 NaOH Tank pH 6.5 Process variable need to be controlled = pH pH Adjustment Tank
 also need to considered where excess flow of the waste shall make that pH in the tank will decrease. Draw a cascade control loop system. FC. pHC. Y. FT. pHT. Waste, pH 4.5. NaOH Tank. pH 6.5. Process variable need to be controlled = pH. pH Adjustment Tank.")
63
The Piping & Instrumentation Diagram (P&ID)
Sometimes also known as Process & Instrumentation Diagram Split Range Control FC FT Valve A Valve B

64
The Piping & Instrumentation Diagram (P&ID)
Sometimes also known as Process & Instrumentation Diagram Split Range Control The diagram shows pH adjustment; part of waste water treatment process.The process shall maintained at pH 6. When the process liquid states below pH 6, CV-102 will be opened to dosing NaOH to the tank TK-100. When the process liquid states above pH 6, CV-101 will be operated to dosing HCl. CV-102 TK-102 (base feed tank) pHIC pHT 1 CV-101 TK-100 (pH adjustment tank) TK-101 (acid feed tank)
 pHIC. pHT 1. CV-101. TK-100. (pH adjustment tank) TK-101. (acid feed tank)")
65
QUESTION?

Similar presentations


>")


