Download presentation
Presentation is loading. Please wait.

1
Motion Displacement, or changes in position can be positive or negative & indicated w/arrow. Right of the reference is positive left of the reference is negative Time is always positive

2
Uniform Motion

3
Non-uniform motion

4
Motion w/ constant acceleration

5
Motion w/ constant acceleration

6
Motion w/ constant acceleration

7
Falling object in air

8
A bouncing ball

9
Motion in a straight line

10
Never connect the dots if the points do not form a smooth line,
draw the best smooth curve possible. App. The same # above & below the line.

11
Interpolation- reading from the graph between data points
Extrapolation- reading the graph beyond the limits

12
Use + and – to indicate the position in relationship to the reference point.
We can use – points!

14
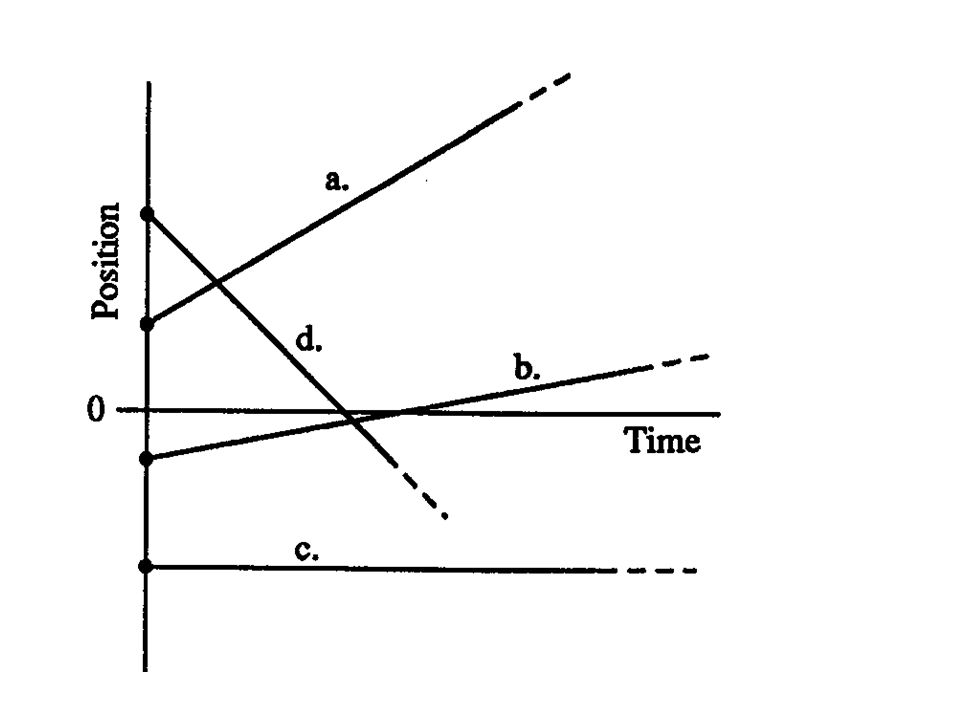
Sketch position-time graphs for these four motions: a
Sketch position-time graphs for these four motions: a. starting at a positive position with a positive velocity b. starting at a negative position with a smaller positive velocity c. remaining at a negative position d starting at a positive position with a negative velocity

16
How would you describe the motion of the runner shown in the graph
How would you describe the motion of the runner shown in the graph. The vertical value of any point is the instantaneous velocity at that time . 1st 5 sec- increase next 5 s- runs at a a constant 8 m/s last 3 sec. - slows to a stop

17
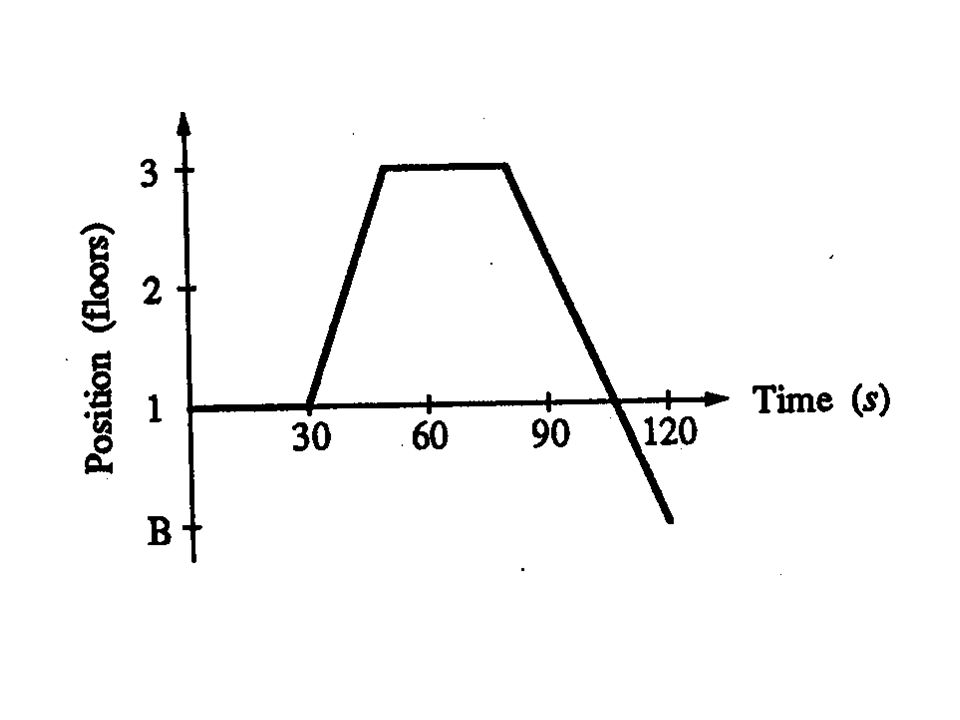
Draw a position-time graph of a moving elevator.
Use the first floor as reference point and up as positive. The elevator waits on the 1st floor for 30 s, rises to the third floor in 20s, where it stops for 30 s, before going to the basement, which it reaches in 40 s.

19
Instantaneous position
Position at the moment Moving objects have a series of instantaneous Positions.

20
The triangle (delta) stands for change & is used in many measurements
Time interval t = t 2 - t 1 The triangle (delta) stands for change & is used in many measurements
 stands for change & is used in many measurements.")
21
Y Dependent Independent- X

22
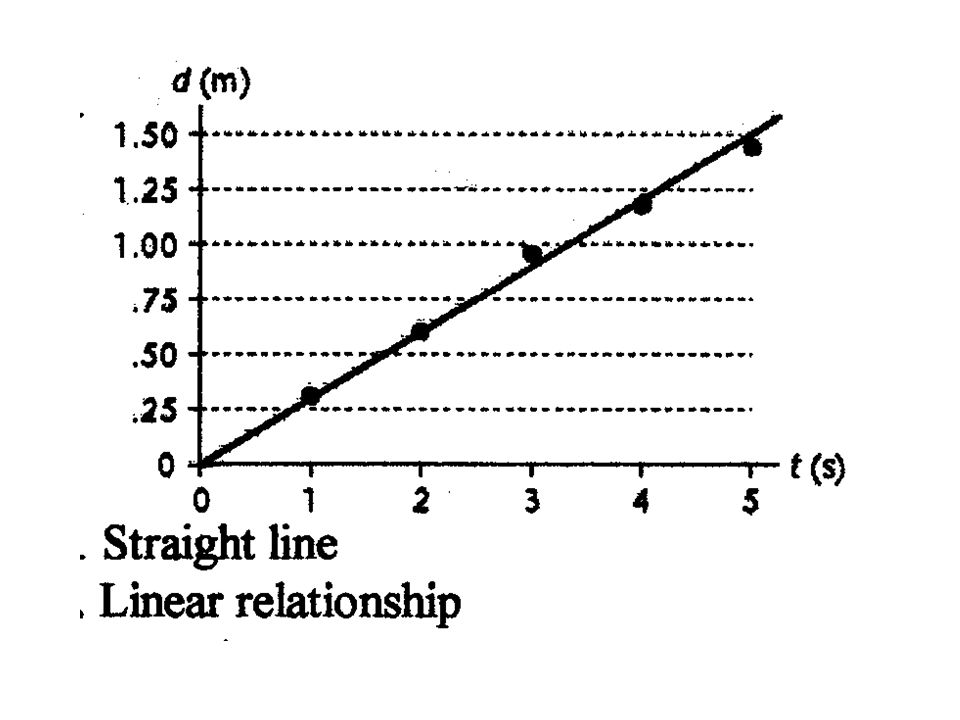
Dependent variable varies directly w/independent
- Linear - straight line y = mx + b m & b are constants

23
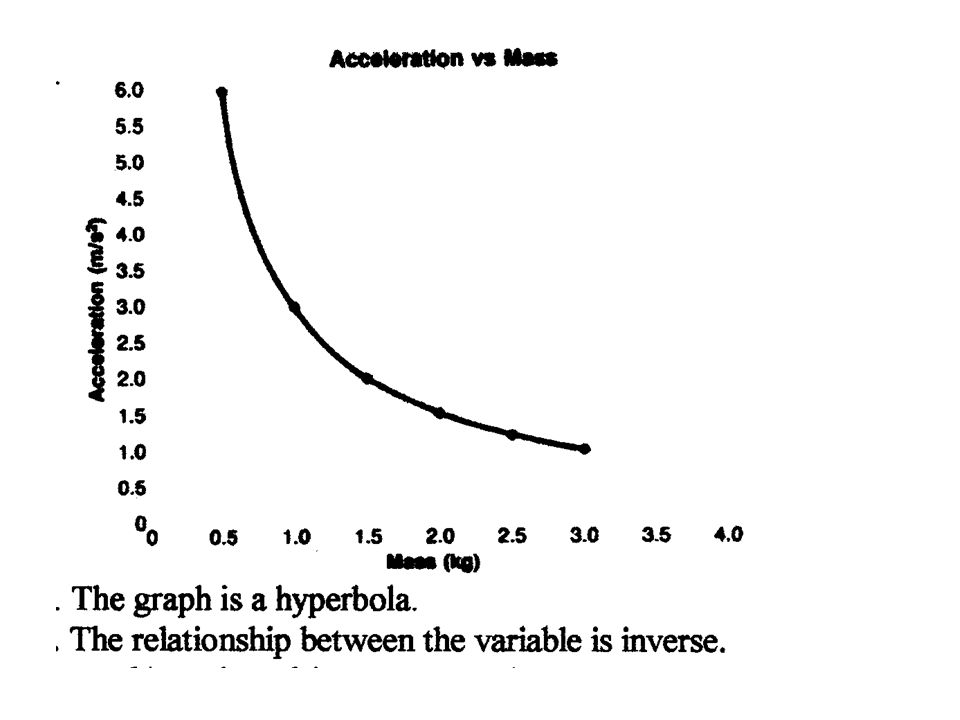
If y varies inversely with x- Hyberbola
xy= k Boyle’s law- When the Pressure of a gas is doubled, the volume will be reduced to 1/2 its original volume

24
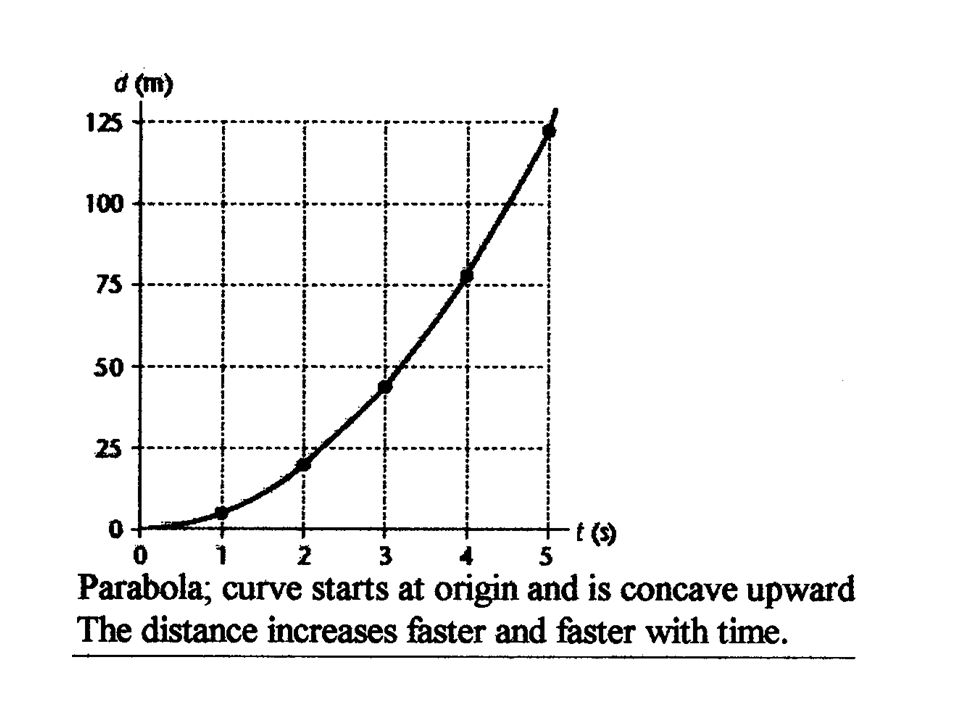
Y varies directly w/square of x;
Parabola y = kx2

25
Slope The displacement is the vertical separation Rise
the time is the horizontal separation-Run The ratio of the rise to the run use the largest possible rise & run for more accuracy

26
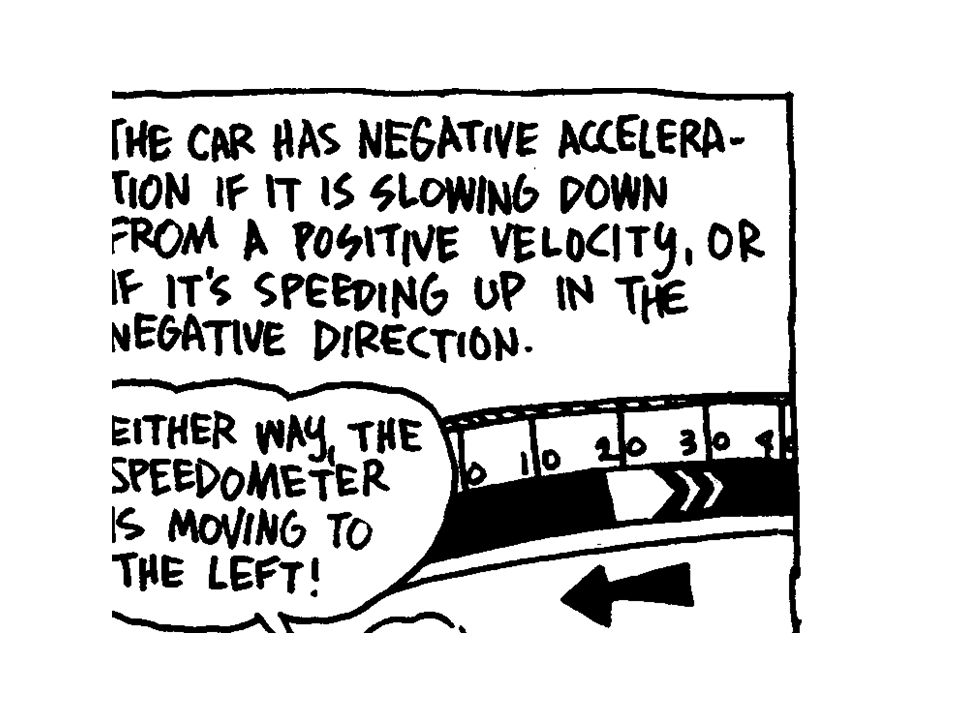
Backing up- the acceleration is negative.
When it comes to a stop the final velocity will be less negative than the initial velocity. The acceleration will be positive even though the car is moving slower.

27
Position- time graphs indicate velocity
velocity-time graphs indicate acceleration

28
Uniform or constant Acceleration
Does not change velocity-time graph = straight line initial velocity- when the clock reading is zero

29
Position-Time graph Shows how position depends on clock reading or time time is the independent variable position is dependent variable straight line used (best)
")
30
Motion at constant speed
Acceleration- zero

31
Motion at constant speed
Acceleration- zero Motion at constant speed

32
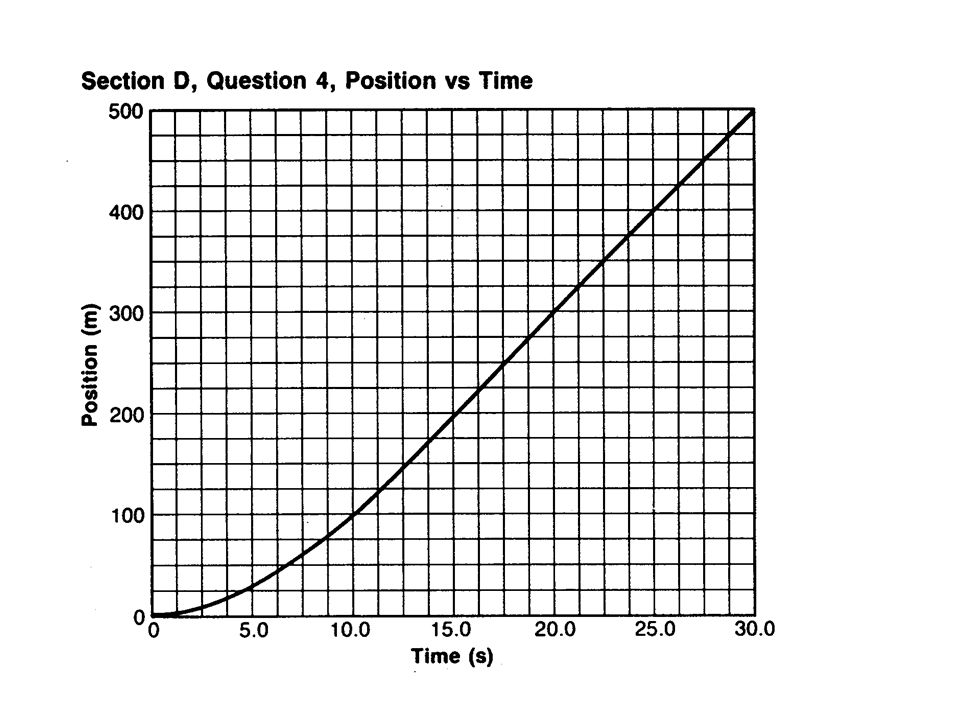
A position-time graph for uniformly accelerating motion parabola- varies directly w/square

33
Instantaneous Velocity
May use a position-time graph to determine the slope at different times. Is the tangent to a curve on a position-time graph

34
Velocity-Time Graphs Describes motion with either constant or changing velocity Model the motion with your hand the displacement between 2 times is the area under the curve of a velocity-time graph

35
The position-time graph
Velocity-time graph for an airplane moving w/a constant velocity of 260 m/s Velocity is constant

36
Constant velocity The time interval is the same at all time intervals
called uniform velocity the ratio of d/ t is constant uniform velocity= v = d t

37
Constant Velocity

38
Uniform Velocity

39
average velocity The slope is the average velocity V= d/t
slope = rise = d run t

40
car Shifting w/four gears

41
Slope (acceleration) is greatest just as the car begins accelerating from rest.
The acceleration is smallest when the velocity is largest.

42
Constant acceleration
The straight line “curve” on a velocity-time graph indicates that the change in velocity is the same in each time interval The slope (acceleration) is constant The airplane acceleration = 20 m/s/s/. Velocity inc. 20 m/s for every second
 is constant. The airplane acceleration = 20 m/s/s/. Velocity inc. 20 m/s for every second.")
43
Constant Acceleration

44
Uniform Acceleration

45
Uniformly accelerated motion- airplane

46
Finding the Avg acceleration of a runner during a 100 m dash.

48
The slope at any point on a position-time graph = the velocity of the object

49
The slope of a position-time graph is the velocity of the object
W/constant velocity/constant slope -straight line w/acceleration-parabola

50
The slope of a position-time graph w/acceleration -parabola
to find the slope of the curve at a given point draw a line tangent to the curve at that point the slope of the tangent line is the instantaneous velocity

51
Displacement When Velocity & Time Are Known
Consider the velocity-time graph for an object w/constant acceleration . The shaded area represents displacement

52
Area under curve of velocity-time graph=displacement (uniform acc)
Shaded area between ti = 0 & t. Made up of rectangle w/triangle on top area of rectangle = height vi x base (t) area + vit w/constant velocity
 area + vit. w/constant velocity.")
53
Avg & Instantaneous Acceleration
Using a velocity-time graph change in velocity is the rise of the curve (ordinate) Time interval is the change in the run (abscissa)
 Time interval is the change in the run (abscissa)")
54
Avg & Instantaneous Acceleration
Avg acceleration = change in velocity divided by the time interval, the avg acceleration is given by the slope of the curve. Slope = rise = v = a run t

55
Instantaneous Acceleration
Acceleration at a given time slope of the tangent to the curve at that moment

57
know velocity & Acceleration Vf 2 = vi 2 + 2ad
An airplane must reach a velocity of 71 m/s for takeoff. If the runway is 1.0 km long, what must the constant acceleration be? Vi = 0 m/s vf = 71 m/s d = km or x 10 3 m unknown; a

59
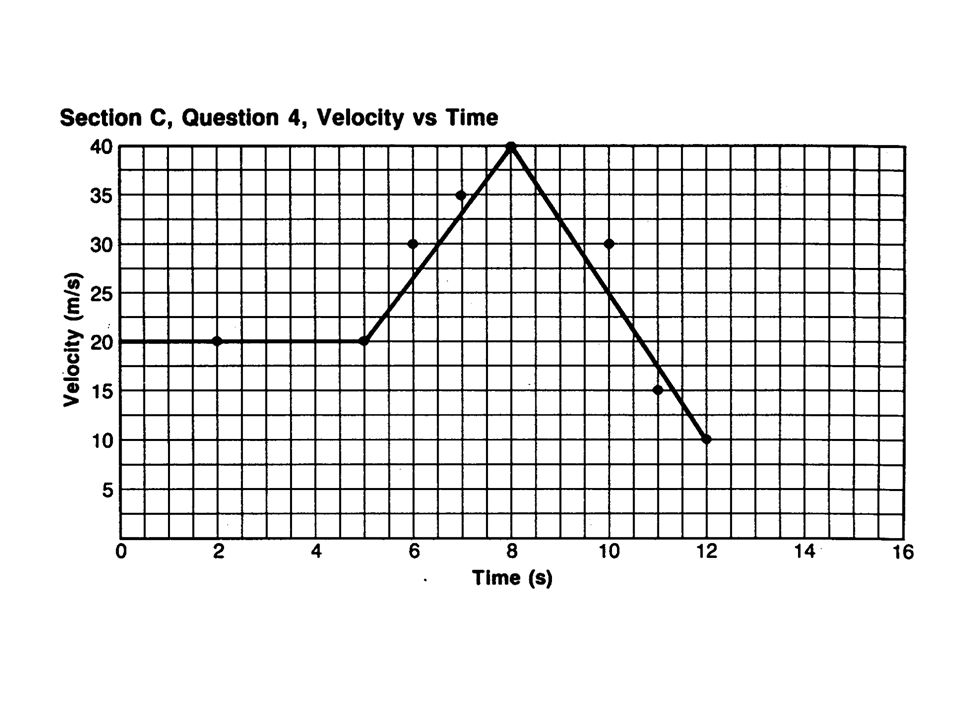
6. Figure 4-6 shows a velocity-time graph of a toy train.
a. During which time interval or intervals is the speed constant? 5 to 15 s and 21 to 28 s. b. During which interval or intervals is the train's acceleration positive? 0 to 6 s.

60
6. c. During which interval or intervals is its acceleration less than zero? 15 to 20 s, 28 s to 40 s. d During which time interval is the acceleration most negative? 16 to 19 s.

61
a. O to 5s. 2 m/s2. b. 0 to 10 s. 1 m/s2. c. 15 to 20 s. -1.2 m/s2. d O to 40s. 0 m/s2. 7. For Figure 4-6 find the average acceleration over the given time intervals.

62
A high school athlete runs 1. 00 X 10 2 m in 12. 20 s
A high school athlete runs 1.00 X 10 2 m in s. What is the velocity in m/s & km/h? V = d t

63
A high school athlete runs. 1. 00 X 10 2 m in 12. 20 s
A high school athlete runs X 10 2 m in s. What is the velocity in m/s & km/h? V = d t (1.00 X 10 2 m) s 8.20 m/s
 s m/s.")
64
A high school athlete runs. 1. 00 X 10 2 m in 12. 20 s
A high school athlete runs X 10 2 m in s. What is the velocity in km/h? 8.20 m/ X 1km X s s m 1 hr = 29.5 km/hr

65
A person walks 13 km in 2.0 h. What is the person’s average velocity in km/h & m/s?
V = d t

66
A person walks 13 km in 2.0 h. What is the person’s average velocity in km/h & m/s?
V = d t 13 km/ 2.0 h 6.5 km/h

67
A person walks 13 km in 2.0 h. What is the person’s average velocity in km/h & m/s?
6.5 km X 1000m X 1 h h 1km s 1.8 m/s

68
A train leaves the station at the 0
A train leaves the station at the 0.0 marker traveling w/a constant velocity of 36.0 m/s. How many seconds later sill the train pass the m marker? V = d so t = d m = 45.0 s t v m/s

69
A train leaves the station at the 0
A train leaves the station at the 0.0 marker traveling w/a constant velocity of 36.0 m/s. What is the volocity of the train in km/hr? V = 36.0 m/s X 1 km X s m hr = 130 km/h

70
The radius of Earth is 6.37 X 10 3 Km
Find the speed in km/h, resulting from the rotation of Earth, of a person standing on the equator. 1.67 X 10 3 km/h or 1.67 X 10 3 km X 1 hr X m hr s km 464 m/s

71
A car moved from -47 to -27m in 2
A car moved from -47 to -27m in 2.0 s would have an average velocity of +10 m/s

72
Suppose the car in Problem 7 started 17 km east of your school at the same time, moving in the same direction at the same velocity. a. Where would it be at 3:30 pm? Same displacement, but position is -17 kIn +235 kIn = 218 kIn west of school. b. When would it be at your school? Ad (17 km) . At = -=- = (94 kIn / h) = 11 mm, v so t = 1:11 pm.
 . At = -=- = (94 kIn / h) = 11 mm, v so t = 1:11 pm.")
73
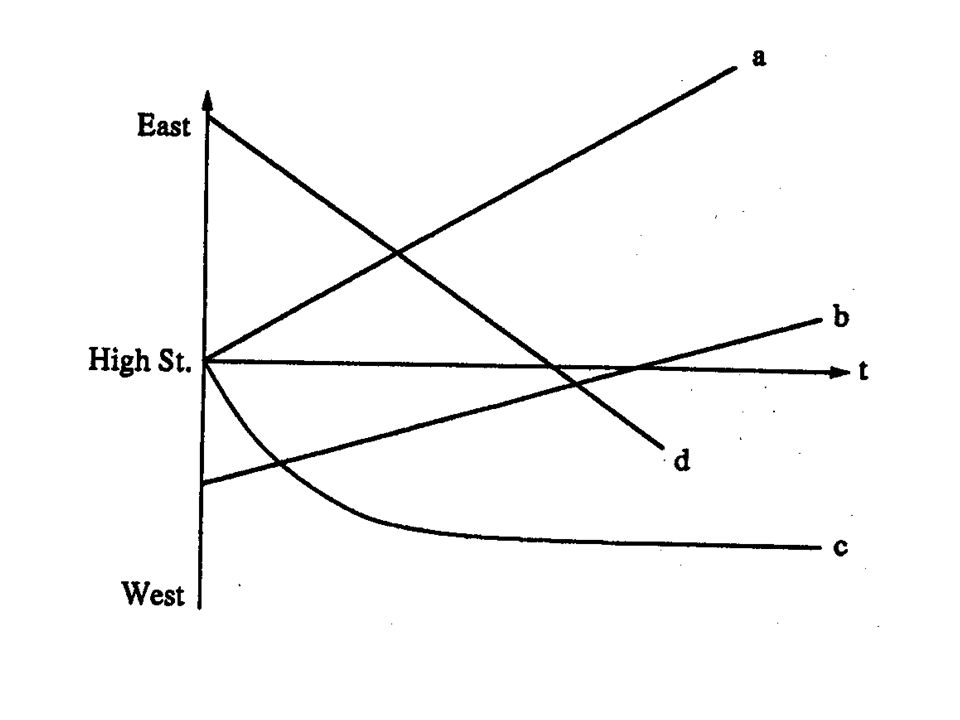
Describe in your own words the motion of the
four walkers shown in the four curves in Figure 3-10. Assume the positive direction is east and the reference point is the comer of High Street. a. Starts at High St, walking east at constant velocity. b. Starts west of High St, walking east at slower constant velocity. c. Walks west from High St., first fast, but slowing to a stop. d. Starts east of High St, walking west at constant velocity.

74
When velocity is constant, displacement increase linearly w/time
Plotted- you will get a straight line w/a slope equal to the velocity

75
Relativity of Velocity
When measuring either position or velocity, you must 1st define the reference frame. A person on a boat traveling 10 m/s A person walking on the boat, walking + 2 m/s a person standing on the bank watching.

76
Answer The velocity of the ship-___________ +10 m/s
the velocity of the passenger-___________. +2 m/s Walking away from- +10 m/s + 2 m/s= +12m/s Walking toward observer- +10 m/s -2= +8m/s

77
Review .The position of an object is its separation from a reference point. .Displacement is a vector quantity indicating the magnitude and direction of an object's change of position. .A scalar quantity is described completely by its magnitude, while a vector quantity requires both magnitude and direction.

78
Review .Average velocity is the displacement (change in position) divided by the time interval. The position of an object is its separation from a reference point. .Displacement is a vector quantity indicating the magnitude and direction of an object's change of position.

79
Review ..A scalar quantity is described completely by its magnitude, while a vector quantity requires both magnitude and direction. .Average velocity is the displacement (change in position) divided by the time interval. .
 divided by the time interval. .")
80
Review .The slope of a position-time graph is the velocity of the object. .If the position-time graph is a straight line, the object is moving with constant velocity.

81
Review .The area under the curve of a velocity-time graph is the displacement of the object. .Instantaneous velocity is the velocity of an object at a given instant. .A frame of reference defines a reference point from which Positions are measured. ~

82
#1 D. Extending concepts V relative to Earth =
=V rel.to walk + V walk rel. to earth = (+2 m/s) + (+ 1.0 m/s) = +3 m/s t = d = m v m/s = 67 sec
 + (+ 1.0 m/s) = +3 m/s. t = d = m v 3.0 m/s. = 67 sec.")
83
#2 D. Extending concepts V relative to Earth =
=V rel.to walk + V walk rel. to earth = (+2 m/s) + (- 1.0 m/s) = +1 m/s t = d = m v m/s = 2.0 X 10² sec
 + (- 1.0 m/s) = +1 m/s. t = d = m v 1.0 m/s. = 2.0 X 10² sec.")
84
# 3 D. Extending concepts If the 2 passengers step on the moving sidewalk at the same time, how far will the 2nd passenger have moved, relative to the sidewalk, when the 1st passenger steps off the sidewalk? d = v t d = 2.0 m/s X 67 s d = 134m

Similar presentations


 is defined as the rate of change of velocity. It has units of m/s 2 Acceleration can be positive, negative, or zero. An.>")