Download presentation
Presentation is loading. Please wait.

1
How Walkable and Bike-able Is UCLA ? Multi-Modal Level Of Service Analysis in the UCLA Campus HYERAN LEE CLASS OF 2014 MASTER OF URBAN AND REGIONAL PLANNING AT UCLA

2
What is Multi-Modal Level Of Service? Conventional Level Of Service (LOS) ◦Traffic volume on the road ◦A to F Letter Grade ◦No consideration to other modes Multi-Modal Level Of Service (MMLOS) ◦Includes other modes in formula ◦Observational Survey (PEQI & BEQI, Fort Collins, Charlotte) ◦Mathematical Modeling (Highway Capacity Manual, Florida DOT)
 ◦Traffic volume on the road ◦A to F Letter Grade ◦No consideration to other modes Multi-Modal Level Of Service (MMLOS) ◦Includes other modes in formula ◦Observational Survey (PEQI & BEQI, Fort Collins, Charlotte) ◦Mathematical Modeling (Highway Capacity Manual, Florida DOT).")
3
Study Area: UCLA Campus & Westwood Village

4
PEQI Pedestrian Environmental Quality Index BEQI Bicycle Environmental Quality Index Developed by San Francisco Department of Public Health in 2008 Peer-reviewed formula – domains and indicators selected and weighted based on surveys by city planners, planning consultants, and pedestrian advocates Microsoft Access Database + GIS Mapping Relatively less labor and capital intensive than other methodologies

5
PEQI Domains and Indicators Intersection Safety Segments Traffic VolumeStreet DesignLand UseSafety Crosswalks High visibility crosswalk Intersection lighting Traffic control Pedestrian/ Countdown signal Wait time Crossing speed Pedestrian refuge island Curb ramps Intersection traffic calming features Pedestrian engineering countermeasures Number of vehicle lanes Posted speed limit Traffic volume Street traffic calming features Continuous sidewalk Width of sidewalk Width of throughway Large sidewalk obstructions Sidewalk impediments Trees Driveway cuts Presence of a buffer Planters/ gardens Public seating Public art/ historic sites Retail use and public places Pedestrian scale lighting Illegal graffiti Litter Empty spaces

6
Bicycle Domains and Indicators Intersection Safety Segments Vehicle TrafficStreet DesignSafety/OtherLand Use Dashed Intersection Bicycle Lane Bicycle Pavement Treatment and Amenities No Turn on Red Signs Number of vehicle lanes Vehicle Speed Traffic calming features Parallel Parking Adjacent to Bicycle Lane/Route Traffic Volume Percentage of Heavy Vehicles Presence of a Marked Area for Bicycle Traffic Width of bicycle lane Trees Connectivity of Bicycle Network Pavement Condition Driveway cuts Street grade Presence of Street Lighting Presence of Bicycle Lane or Share Roadway Signs Line of site Bicycle Parking Retail Use

7
PEQI and BEQI Formula (unadjusted score*) – (minimum score) (maximum score) – (minimum score) * Unadjusted Score = sum of weighted scores of all indices x 100 Total score =
 – (minimum score) (maximum score) – (minimum score) * Unadjusted Score = sum of weighted scores of all indices x 100 Total score =")
8
Results: PEQI

12
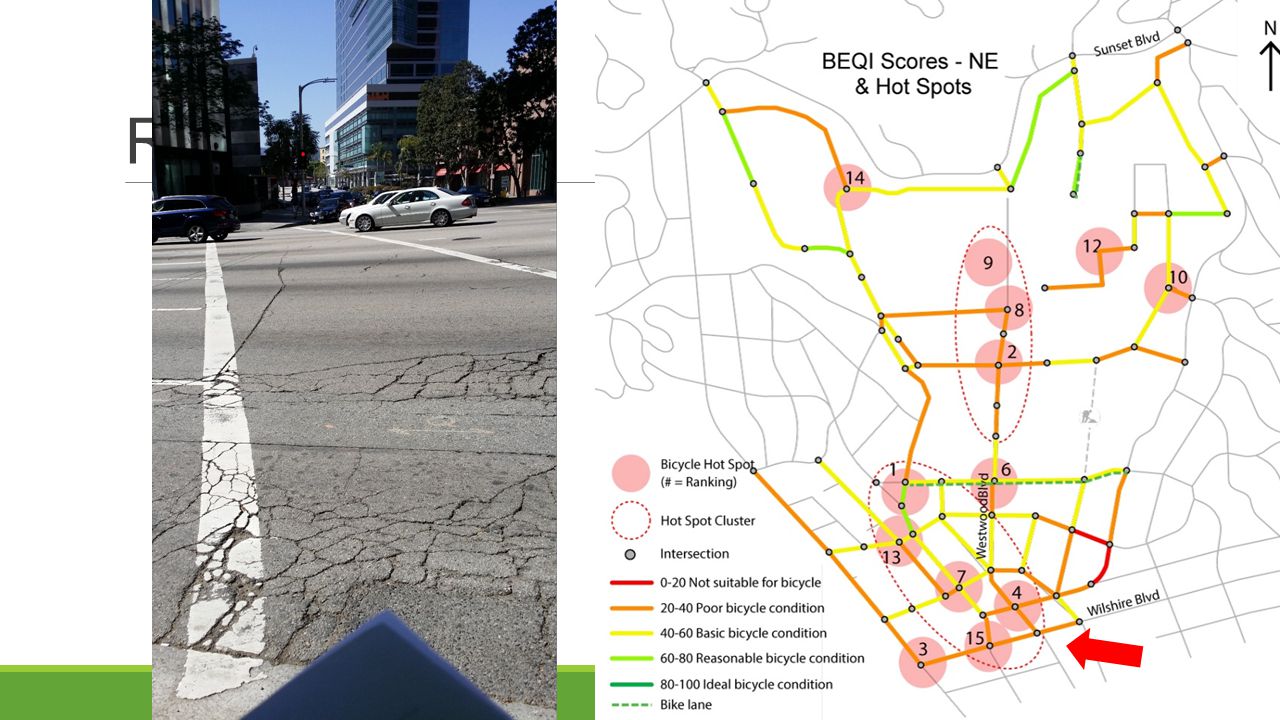
Results: BEQI

16
Application of BEQI and PEQI Select priority areas based on PEQI and BEQI scores Analyze each location to determine the appropriate mix of the 3E’s process Incorporate with existing transportation database Post-improvement assessment

Similar presentations


 )Project Community Advisory Committee July 11, 2007 Meeting.>")


 Sidewalk Feasibility Study Town of Pierson, Florida.>")

