Download presentation
Presentation is loading. Please wait.

1
Accuracy, Transparency, and Incentives: Contrasting Criteria for Evaluating Growth Models Andrew Ho Harvard Graduate School of Education Maryland Assessment Research Center for Education Success (MARCES) Assessment Conference: Value Added Modeling and Growth Modeling with Particular Application to Teacher and School Effectiveness College Park, Maryland, October 18, 2012
 Assessment Conference: Value Added Modeling and Growth Modeling with Particular Application to Teacher and School Effectiveness College Park, Maryland, October 18, 2012")
2
How can we advance from passing judgment on schools and teachers to facilitating their improvement? By which criteria should we evaluate accountability models? Predictive accuracy of individual student “growth” models for school-level accountability. – Projection Model – Trajectory Model – Conditional Status Percentile Rank models (e.g., SGPs) Incentives. – Conditional Incentive diagrams and alignment to policy goals. Transparency, black boxes, and score reporting. What makes a good growth model?
 Incentives. – Conditional Incentive diagrams and alignment to policy goals. Transparency, black boxes, and score reporting. What makes a good growth model .")
3
School accountability metrics that count students who are “on track” to proficiency, career and college readiness, or some other future outcome. A seemingly straightforward criterion is minimization of the distance between predicted and actual future performance. Context

4
Once the discussion is framed in terms of standards, the only rhetorically acceptable choice is high standards. Once the discussion is framed in terms of predictive accuracy, the only rhetorically acceptable choice is maximal accuracy. How “predictive accuracy” is like “standards”

5
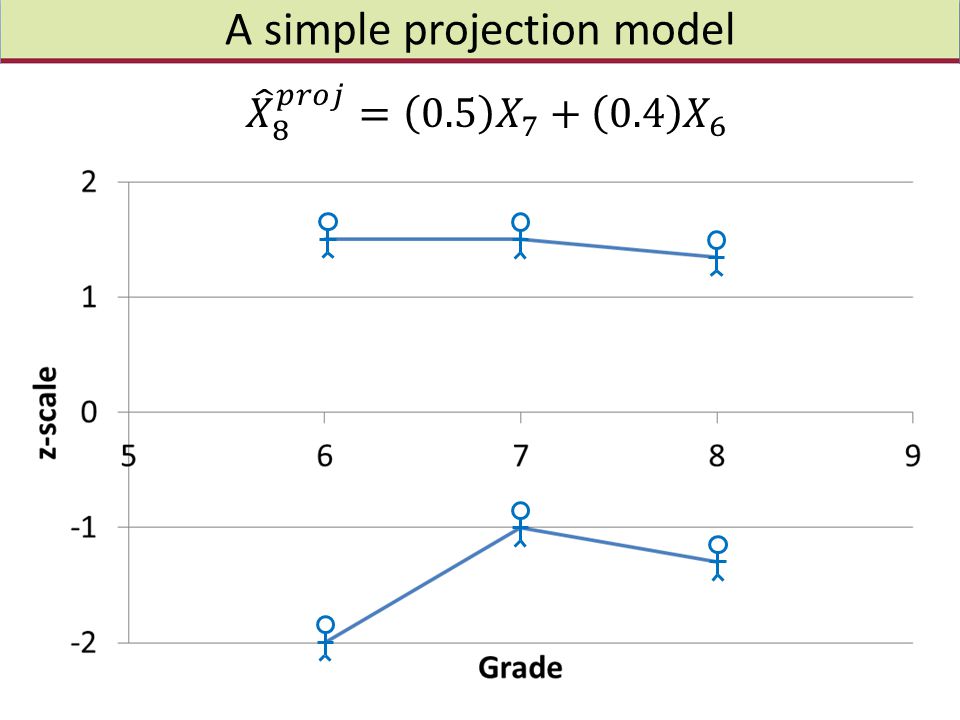
A simple projection model

7
Minimize Squared Error

8
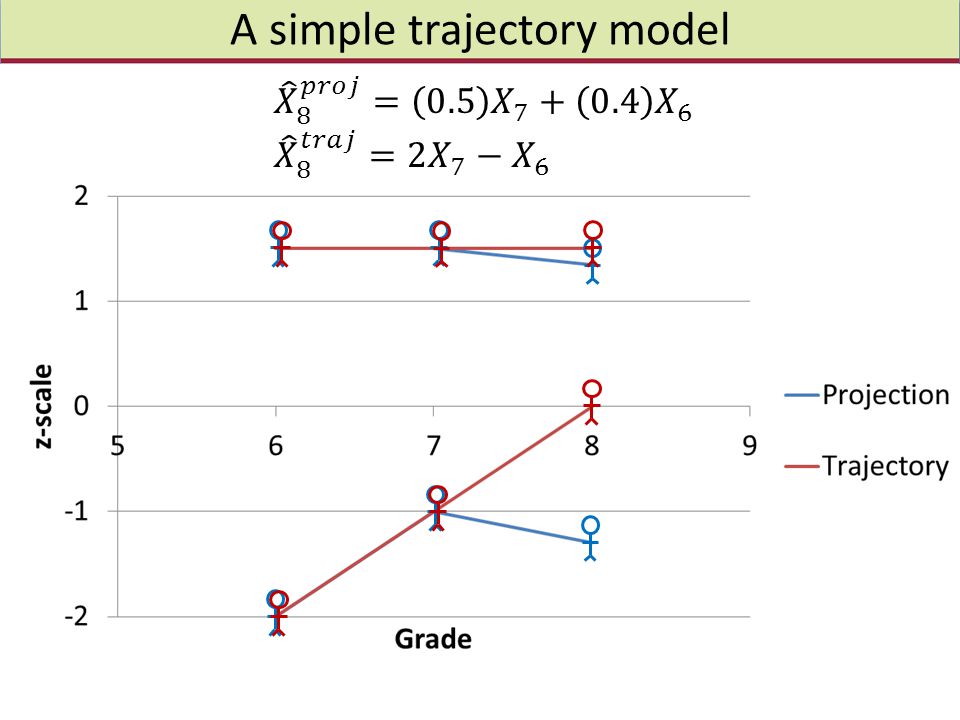
A simple trajectory model

10
Projections from Conditional Status Percentile Ranks

11
Contrasting all predictive models

12
Growth DescriptionGrowth Prediction Gain Scores, Trajectories Status Beyond Prediction, CSPR Trajectory, Gain- Score Model Projection/Regre ssion Model Use a regression model to predict future scores from past scores, statistically, empirically. Where a student was, where a student is, and what has been learned in between. Where a student is, above and beyond where we would have predicted she would be, given past scores. Extend past gains in systematic fashion into the future. Consider whether future performance is adequate An important contrast in “growth” use and interpretation

13
Gain Prediction from previous score (or scores, or scores and demographics) Status beyond prediction Adding two students with equal gains Adding two different students with equal status beyond predictions. Gain Scores, Trajectories Status Beyond Prediction Two Approaches to Growth Description

14
Extends gains over time in straightforward fashion. With more prior years, a best-fit line or curve can be extended similarly. Extended trajectories do not have to be linear. Estimates a prediction equation for the “future” score. Because current students have unknown future scores, estimate the prediction equation from a previous cohort that does have their “future” year’s score. Input current cohort data into this prediction equation. Trajectory ModelProjection/Regression Model Two Approaches to Growth Prediction

15
Three students with equal projections from a regression model. The same three students’ predictions with a regression model. Three students with equal projections from a gain-score model Stark Contrasts in Projections

16
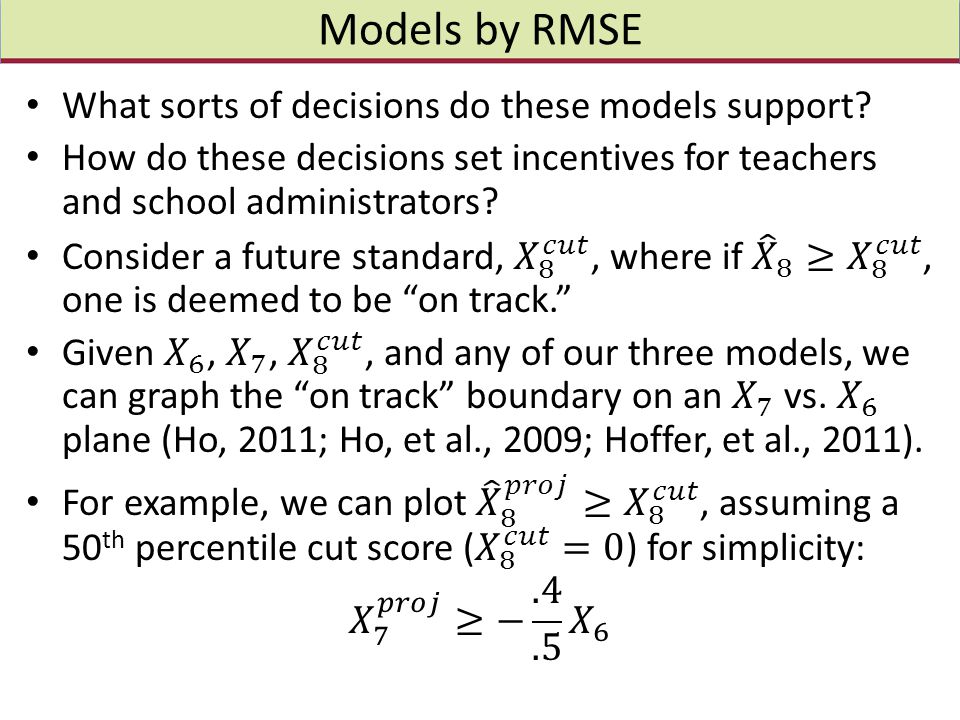
Models by RMSE

18
Decision Plots For a Grade 6 score of -2, projection models require a 1.6, CSPRs require a -.5, and trajectory models require a -1. For a Grade 6 score of 2, projection models require anything above a -1.6, CSPRs require a.5, and trajectory models require a 1.

19
Torquing Projection Lines

20
Aspirational Models vs. Predictive Models The CSPR and trajectory model lines are, from this perspective, more aspirational than predictive. They envision a covariance structure where relative position is less fixed over time than it is empirically. Can this be okay, even if it decreases predictive accuracy?

21
From Decision Plots to Effort Plots The regression line or “conditional expectation” line gives us a baseline expectation given our Grade 6 scores. Anything above this line may require “effort.” We can plot this effort on prior-year scores by subtracting out this regression line.

22
Conditional Effort Plots Required gain beyond expectation. Maximizing predictive accuracy may lead to implausible gains required to get low- achieving students to be “on track.” A low score as a “ball and chain.” A high score as a “free pass.”

23
Conditional Incentive Plots In a zero-sum model for incentives to teach certain students, these conditional effort plots imply conditional incentive plots, as shown. The question may be, what is the goal of the policy? This informs conditional incentive plots, and these can inform model selection. This is a useful alternative to letting prediction drive model selection and then being surprised by the shape of incentives.

24
Lower initial scores can inflate trajectories: New Model Rewards Low Scores, Encourages “Fail-First Strategy” Very intuitive, requires vertical scales, less accurate in terms of future classifications. Low scorers require huge gains. High scorers can fall comfortably. New Model Labels High and Low Achievers Early, Permanently. Counterintuitive, does not require vertical scales, more accurate classifications. Trajectory, Gain-Score ModelRegression/Prediction Model Stark Contrasts in Incentives

25
I argue that school accountability metrics should be designed with less attention to “standards” and “prediction” and closer attention to conditional incentives and their alignment with policy goals. What about teacher accountability metrics? Conditional incentive plots for VAMs are generally uniform across the distributions of variables included in the model. Scaling anomalies may lead to distortions, if equal intervals do not correspond with equal “effort for gains,” although this is difficult to game. Conditional Incentive Plots for VAMs

26
As accountability calculations become increasingly complicated, score reporting and transparency become even more necessary mechanisms for the improvement of schools and teaching. Systems will be more successful with clear reporting of actionable (and presumably defensible) results. An example: I used to be very suspicious of categorical/value-table models, as they create pseudo- vertical scales and sacrifice information. – I still have reservations, but they are still excellent tools for reporting and communicating results, even when the underlying models are not themselves categorical. – An actionable, interpretable categorical framework layered over a continuous model. Transparency and Score Reporting
 results. An example: I used to be very suspicious of categorical/value-table models, as they create pseudo- vertical scales and sacrifice information. – I still have reservations, but they are still excellent tools for reporting and communicating results, even when the underlying models are not themselves categorical. – An actionable, interpretable categorical framework layered over a continuous model. Transparency and Score Reporting.")
27
If I had a choice between – A simple VAM that communicated actionable responses and incentives clearly, vs. – A complicated VAM that did not have any guidance about how to improve… This is a false dichotomy. We can make the complex seem simple. Conditional incentive plots and similar attention to differential student contribution to VAM estimates are one approach to this. Both to anticipate gaming behavior and encourage desired responses. Communicating Incentives Clearly

28
In his NCME Career Award address, Haertel distinguished between two categories of purposes of large-scale testing: Measurement and Influence. A “influencing” purpose is often depends less on the results of the test itself. – Directing student effort – “Shaping public perception” Validation arguments for Influencing purposes are rarely well described. These plots are a modest first step for visualizing the Influencing mechanisms of proposed models. Haertel (2012) Measurement vs. Influence
 Measurement vs. Influence.")
29
A medical analogy (thanks to Catherine McClellan) can be helpful in thinking about where VAM and school accountability research should continue to go. Doctors must gather data, identify symptoms, reach a diagnosis, and prescribe a treatment. – In school and teacher effectiveness conversations, we often get stuck at “symptoms.” – Doctors do not average blood pressure results with fMRI results to get increasingly reliable and accurate measures of “health.” Or at least they don’t stop there. – We need to continue advancing the science of diagnosis (what’s wrong) and treatment (now what). We must continue beyond predictive accuracy and even conditional incentives to deeper understanding of teachers’ and administrators’ learning in response to evaluation systems. School/Teacher Effectiveness and House, MD
 and treatment (now what). We must continue beyond predictive accuracy and even conditional incentives to deeper understanding of teachers’ and administrators’ learning in response to evaluation systems. School/Teacher Effectiveness and House, MD.")
Similar presentations


![Enquiring mines wanna no.... Who is it? Coleman Report “[S]chools bring little influence to bear upon a child’s achievement that is independent of.](/15/4758624/big_thumb.jpg "Enquiring mines wanna no.... Who is it? Coleman Report “[S]chools bring little influence to bear upon a child’s achievement that is independent of.>")


